| Param | Original file | Final file |
|---|---|---|
| Filename | modeM0/AS1A09_008T02_9000003796_26306cztM0_level2.evt | modeM0/AS1A09_008T02_9000003796_26306cztM0_level2_quad_clean.evt |
| Size (bytes) | 462,654,720 | 112,449,600 |
| Size | 441.2 MB | 107.2 MB |
| Events in quadrant A | 3,278,291 | 724,806 |
| Events in quadrant B | 3,329,394 | 744,571 |
| Events in quadrant C | 3,498,349 | 719,217 |
| Events in quadrant D | 3,416,491 | 716,297 |
| Mode M0 | |||
|---|---|---|---|
| Quadrant | BADHDUFLAG | Total packets | Discarded packets |
| A | 0 | 14574 | 0 |
| B | 0 | 14629 | 0 |
| C | 0 | 14929 | 0 |
| D | 0 | 15141 | 0 |
| Mode M9 | |||
|---|---|---|---|
| Quadrant | BADHDUFLAG | Total packets | Discarded packets |
| A | 0 | 3 | 0 |
| B | 0 | 3 | 0 |
| C | 0 | 3 | 0 |
| D | 0 | 3 | 0 |
| Quadrant | Total seconds | Saturated seconds | Saturation percentage |
|---|---|---|---|
| A | 7190 | 88 | 1.223922% |
| B | 7190 | 108 | 1.502086% |
| C | 7190 | 156 | 2.169680% |
| D | 7189 | 99 | 1.377104% |
Noise dominated data is calculated using 1-second bins in cleaned event files. If a bin has >2000 counts, and if more than 50% of those come from <1% of pixels, then it is considered to be noise-dominated and hence unusable.
| Quadrant | # 1 sec bins | Bins with >0 counts | Bins with >2000 counts | High rate bins dominated by noise | Noise dominated (total time) | Noise dominated (detector-on time) | Marked lightcurve |
|---|---|---|---|---|---|---|---|
| A | 7525 | 7191 | 0 | 0 | 0.00% | 0.00% | 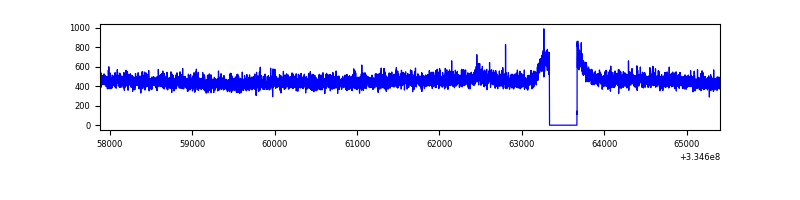 |
| B | 7525 | 7191 | 0 | 0 | 0.00% | 0.00% | 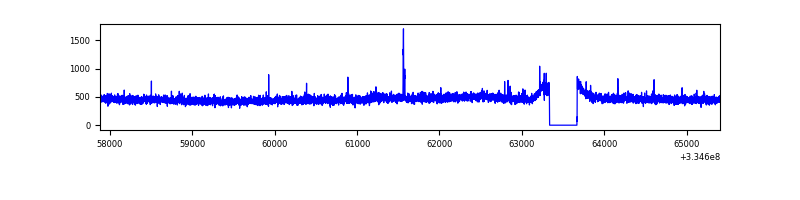 |
| C | 7525 | 7191 | 21 | 21 | 0.28% | 0.29% | 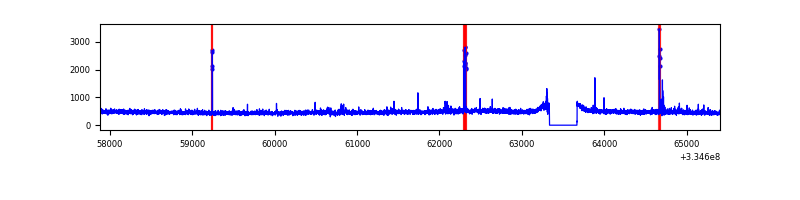 |
| D | 7524 | 7190 | 19 | 19 | 0.25% | 0.26% | 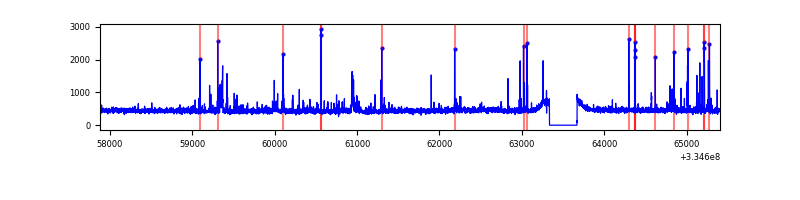 |
Top three noisy pixels from each quadrant. If the there are fewer than three noisy pixels in the level2.evt file, extra rows are filled as -1
| Pixel properties | Quadrant properties | ||||||
|---|---|---|---|---|---|---|---|
| Quadrant | DetID | PixID | Counts | Sigma | Mean | Median | Sigma |
| A | 13 | 254 | 11096 | 59.85 | 849 | 830 | 171.5 |
| A | 3 | 137 | 8129 | 42.55 | 849 | 830 | 171.5 |
| A | 0 | 226 | 7212 | 37.21 | 849 | 830 | 171.5 |
| B | 12 | 111 | 20080 | 119.48 | 843 | 819 | 161.2 |
| B | 11 | 111 | 18221 | 107.95 | 843 | 819 | 161.2 |
| B | 14 | 111 | 16341 | 96.29 | 843 | 819 | 161.2 |
| C | 14 | 238 | 129510 | 663.51 | 823 | 826 | 193.9 |
| C | 2 | 16 | 94989 | 485.52 | 823 | 826 | 193.9 |
| C | 3 | 233 | 48558 | 246.11 | 823 | 826 | 193.9 |
| D | 11 | 176 | 135757 | 681.62 | 835 | 813 | 198.0 |
| D | 12 | 33 | 56465 | 281.11 | 835 | 813 | 198.0 |
| D | 2 | 234 | 32025 | 157.66 | 835 | 813 | 198.0 |
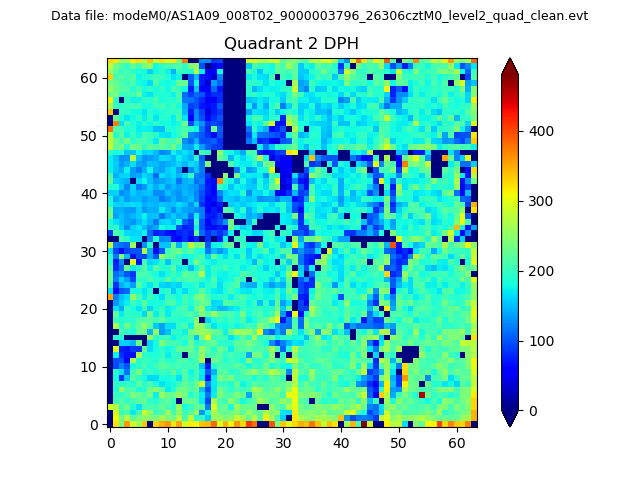
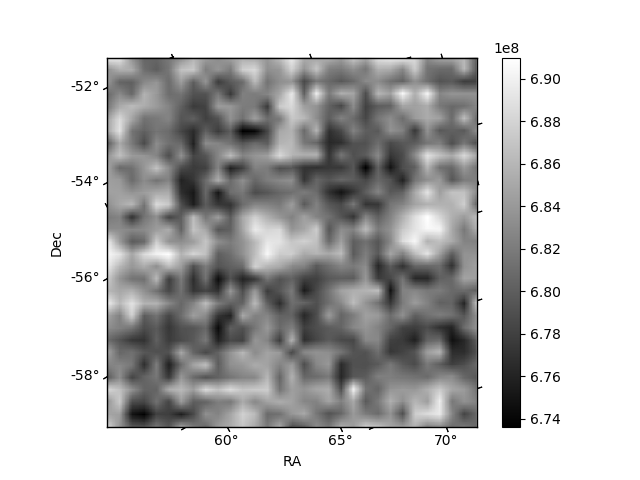
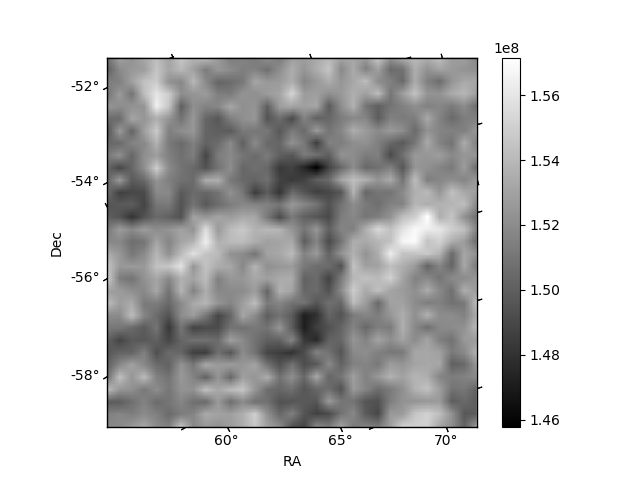
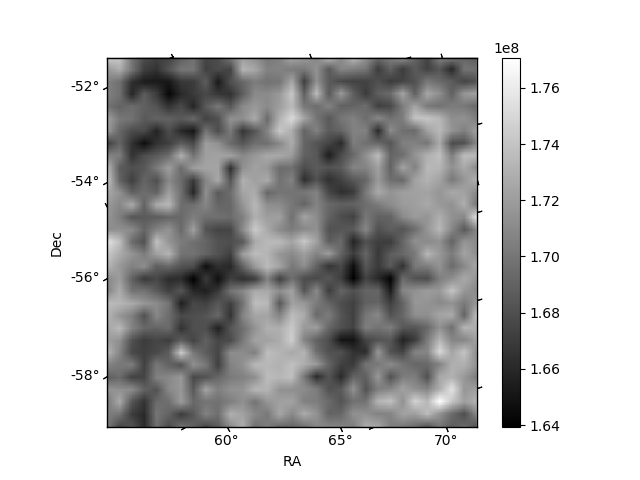
Histogram calculated using DETX and DETY for each event in the final _common_clean file
| Quadrant A | 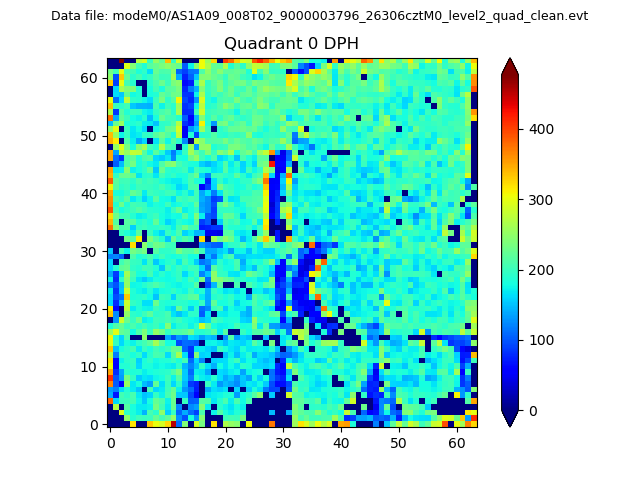 |
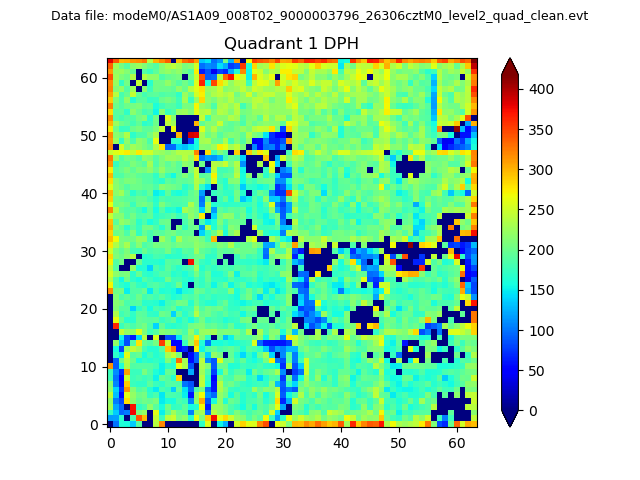 |
Quadrant B |
|---|---|---|---|
| Quadrant D | 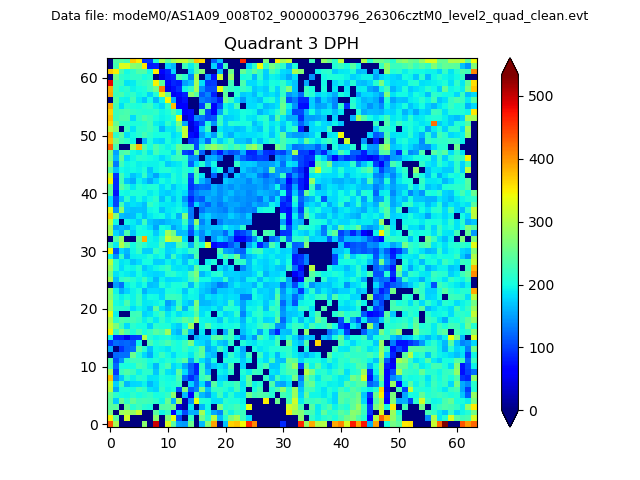 |
 |
Quadrant C |
| Plot type | Count rate plots | Images |
|---|---|---|
| Comparison with Poisson distribution Blue bars denote a histogram of data divided into 1 sec bins. Red curve is a Poisson curve with rate = median count rate of data. |
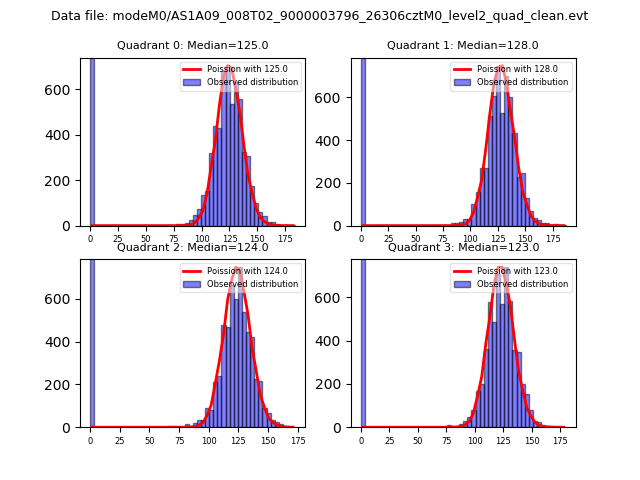 |
 |
| Quadrant-wise count rates Data is divided into 100 sec bins |
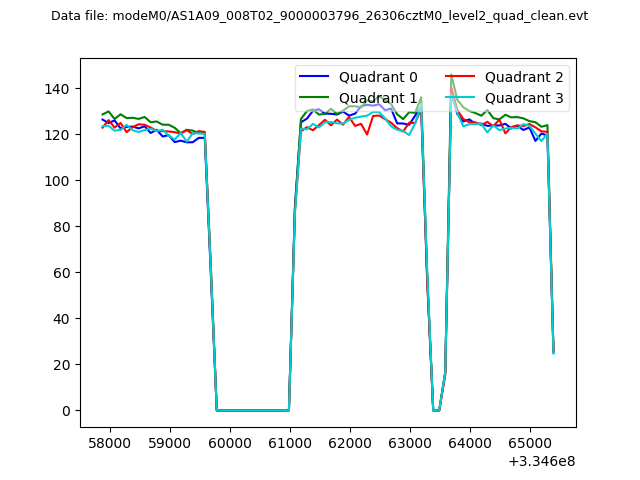 |
|
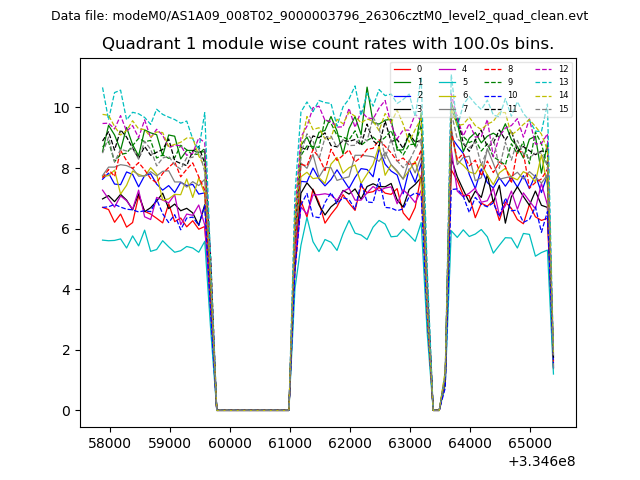
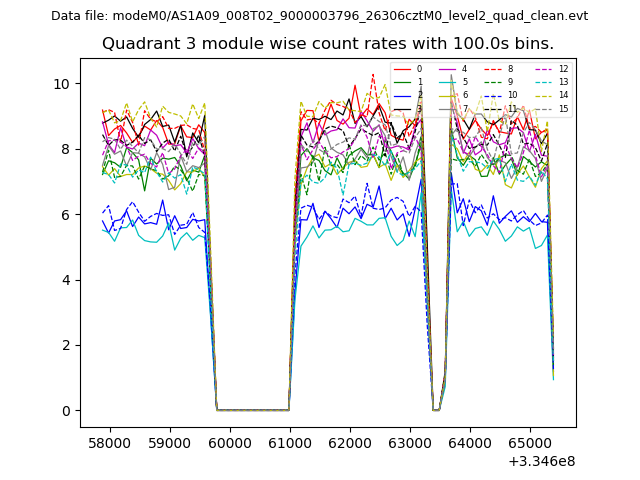
| Module-wise count rates for Quadrant A Data is divided into 100 sec bins |
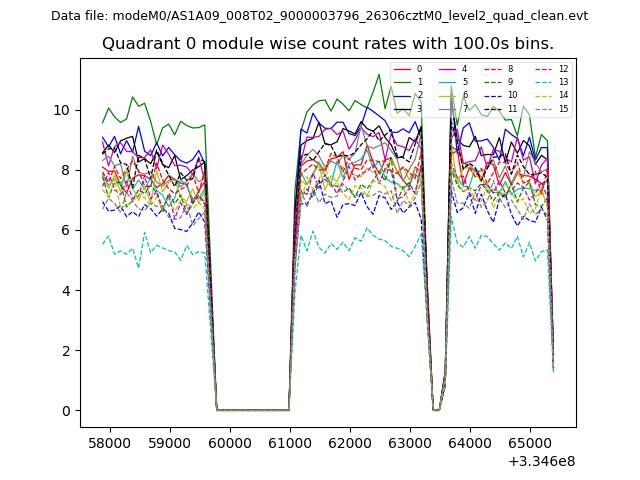 |
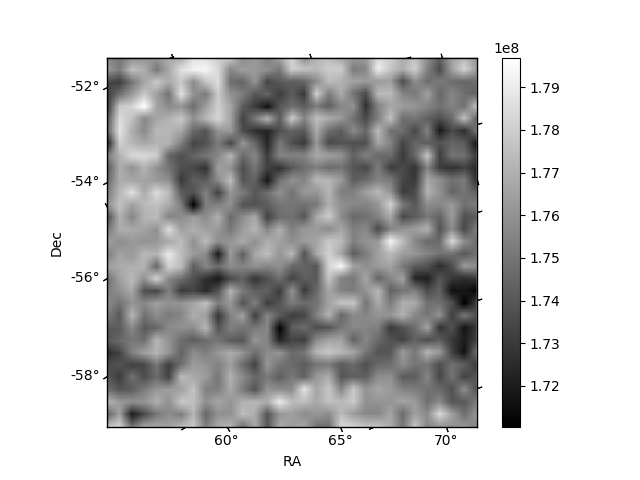 |
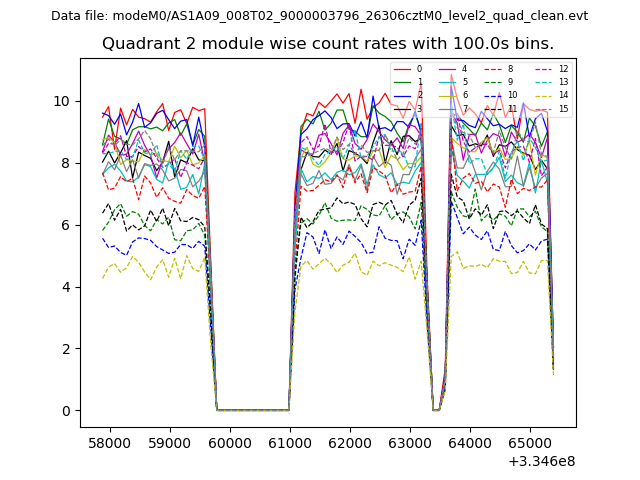
| Module-wise count rates for Quadrant B Data is divided into 100 sec bins |
 |
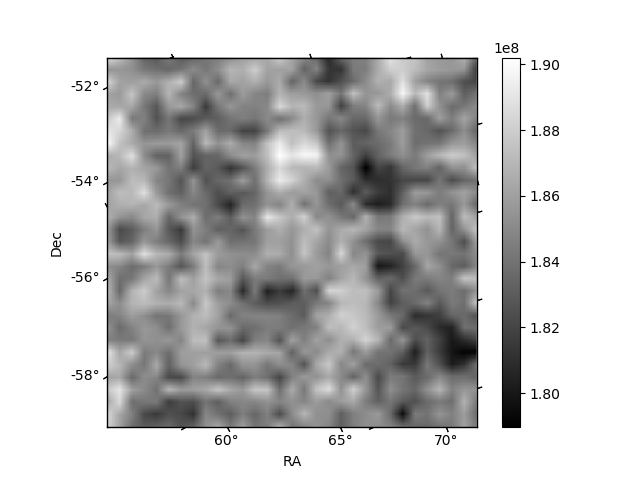 |
| Module-wise count rates for Quadrant C Data is divided into 100 sec bins |
 |
 |
| Module-wise count rates for Quadrant D Data is divided into 100 sec bins |
 |
 |
| Parameter | Plot |
|---|---|
| CZT HV Monitor | 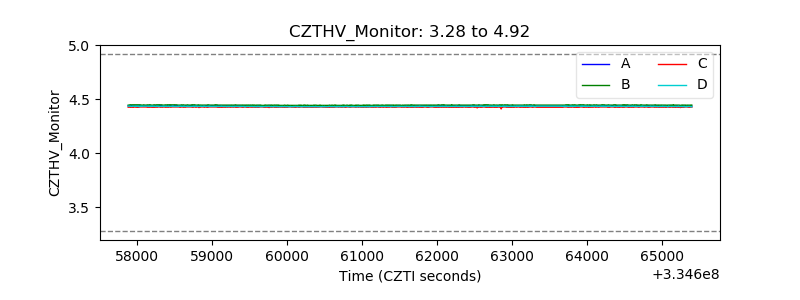 |
| D_VDD | 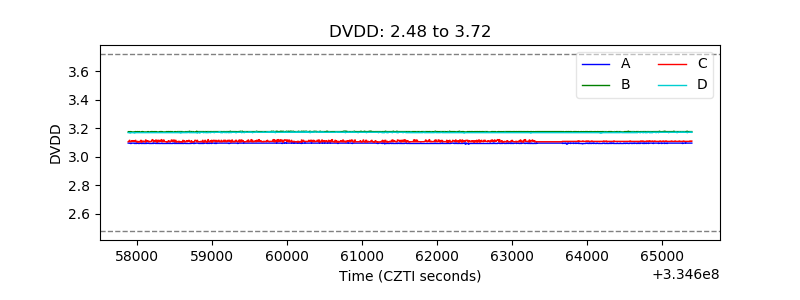 |
| Temperature 1 | 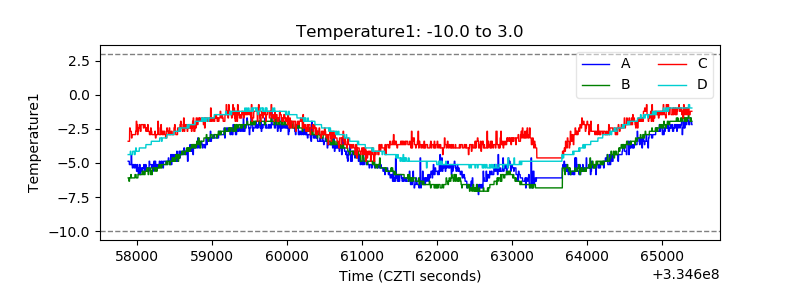 |
| Veto HV Monitor | 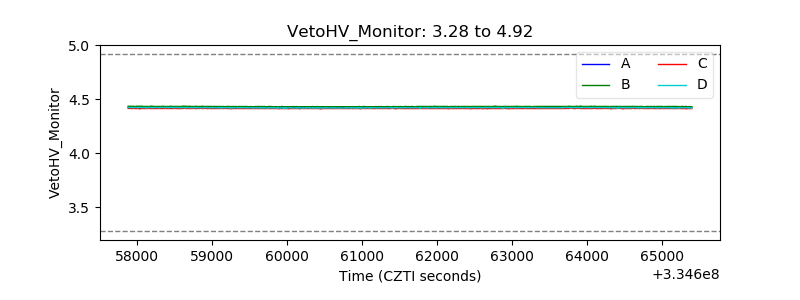 |
| Veto LLD | 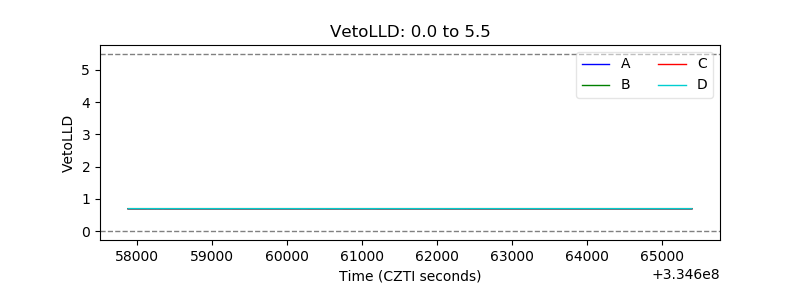 |
| Alpha Counter | 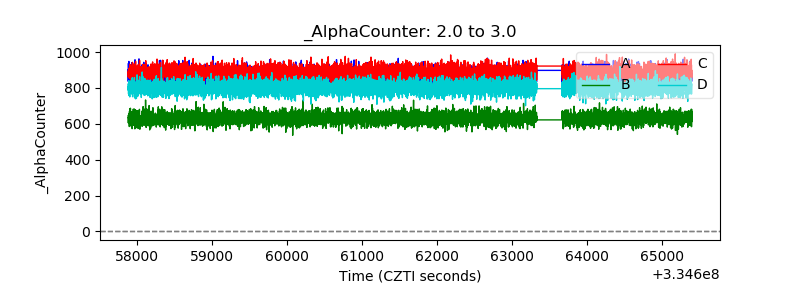 |
| _CPM_Rate | 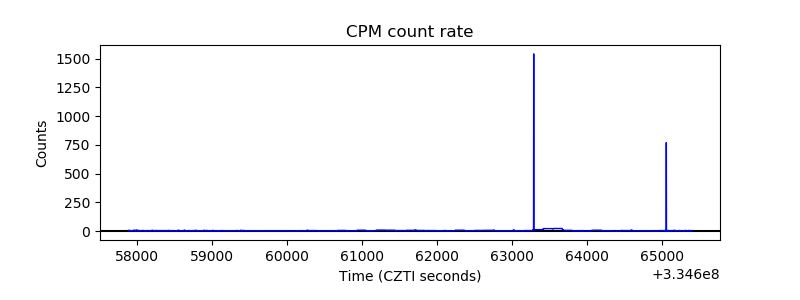 |
| CZT Counter | 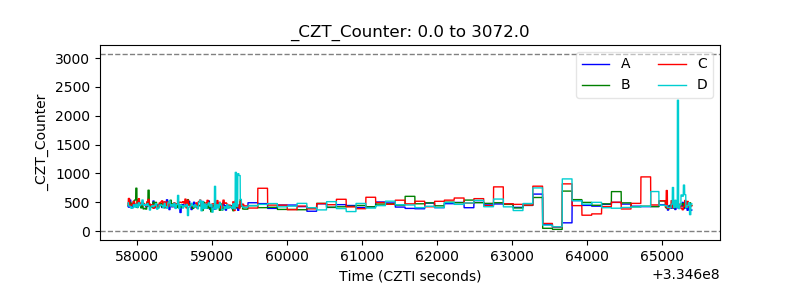 |
| +2.5 Volts monitor |  |
| +5 Volts monitor |  |
| _ROLL_ROT | 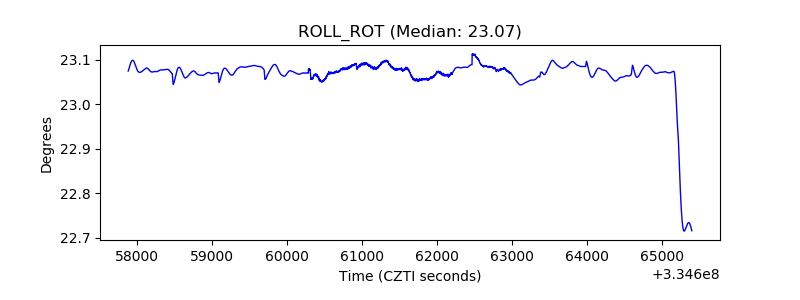 |
| _Roll_DEC | 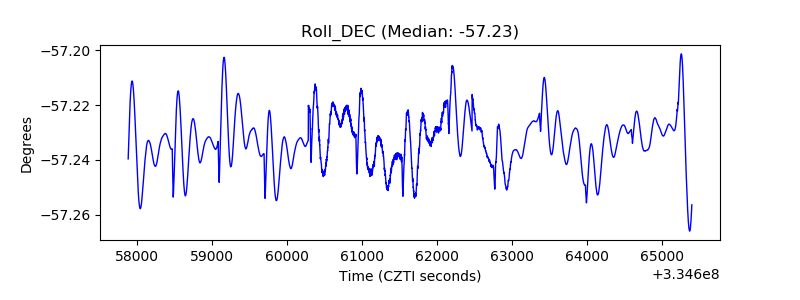 |
| _Roll_RA | 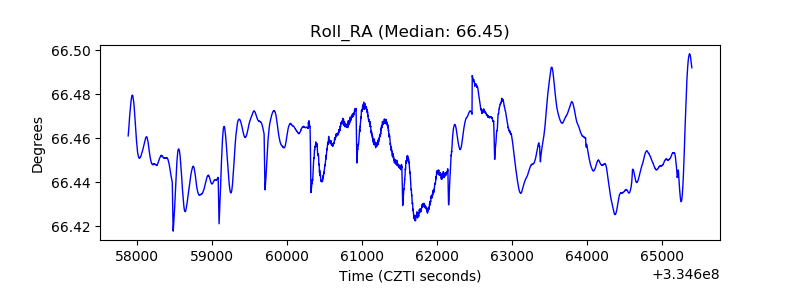 |
| Veto Counter | 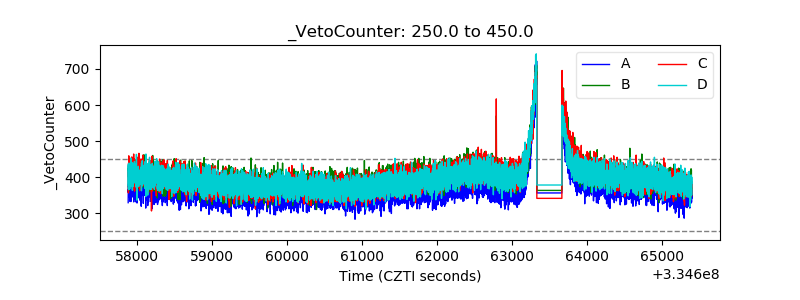 |