| Param | Original file | Final file |
|---|---|---|
| Filename | modeM0/AS1A09_008T02_9000003796_26309cztM0_level2.evt | modeM0/AS1A09_008T02_9000003796_26309cztM0_level2_quad_clean.evt |
| Size (bytes) | 1,266,140,160 | 248,624,640 |
| Size | 1.2 GB | 237.1 MB |
| Events in quadrant A | 8,255,868 | 1,593,413 |
| Events in quadrant B | 8,599,272 | 1,630,412 |
| Events in quadrant C | 9,242,708 | 1,555,999 |
| Events in quadrant D | 11,048,926 | 1,528,727 |
| Mode M0 | |||
|---|---|---|---|
| Quadrant | BADHDUFLAG | Total packets | Discarded packets |
| A | 0 | 36313 | 0 |
| B | 0 | 36904 | 0 |
| C | 0 | 38899 | 0 |
| D | 0 | 44947 | 0 |
| Mode M9 | |||
|---|---|---|---|
| Quadrant | BADHDUFLAG | Total packets | Discarded packets |
| A | 0 | 20 | 0 |
| B | 0 | 20 | 0 |
| C | 0 | 20 | 0 |
| D | 0 | 20 | 0 |
| Quadrant | Total seconds | Saturated seconds | Saturation percentage |
|---|---|---|---|
| A | 17723 | 169 | 0.953563% |
| B | 17724 | 238 | 1.342812% |
| C | 17724 | 596 | 3.362672% |
| D | 17724 | 755 | 4.259761% |
Noise dominated data is calculated using 1-second bins in cleaned event files. If a bin has >2000 counts, and if more than 50% of those come from <1% of pixels, then it is considered to be noise-dominated and hence unusable.
| Quadrant | # 1 sec bins | Bins with >0 counts | Bins with >2000 counts | High rate bins dominated by noise | Noise dominated (total time) | Noise dominated (detector-on time) | Marked lightcurve |
|---|---|---|---|---|---|---|---|
| A | 19683 | 17725 | 0 | 0 | 0.00% | 0.00% | 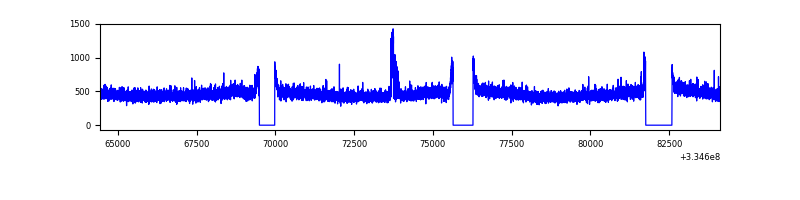 |
| B | 19684 | 17726 | 22 | 22 | 0.11% | 0.12% | 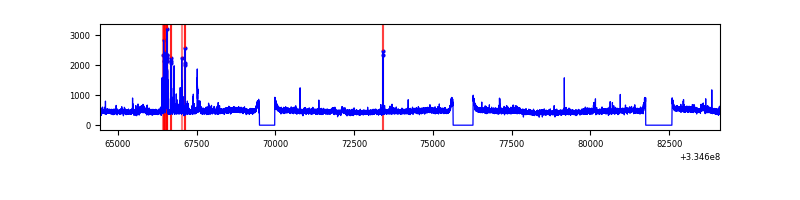 |
| C | 19684 | 17726 | 155 | 155 | 0.79% | 0.87% | 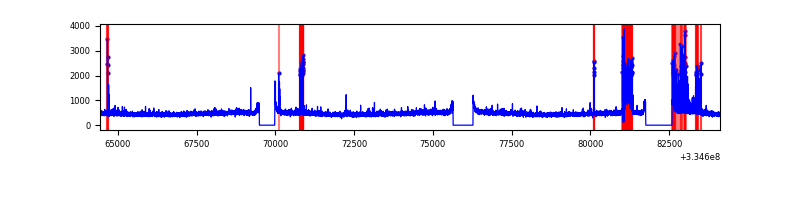 |
| D | 19684 | 17727 | 473 | 473 | 2.40% | 2.67% | 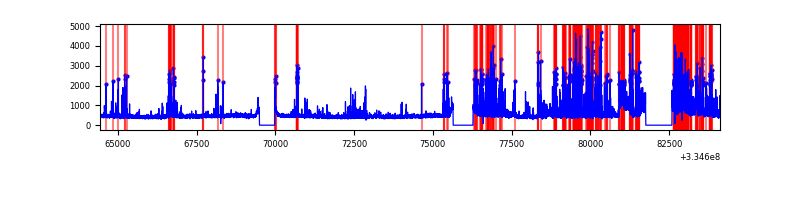 |
Top three noisy pixels from each quadrant. If the there are fewer than three noisy pixels in the level2.evt file, extra rows are filled as -1
| Pixel properties | Quadrant properties | ||||||
|---|---|---|---|---|---|---|---|
| Quadrant | DetID | PixID | Counts | Sigma | Mean | Median | Sigma |
| A | 7 | 192 | 101126 | 235.17 | 2112 | 2064 | 421.2 |
| A | 13 | 254 | 27614 | 60.65 | 2112 | 2064 | 421.2 |
| A | 3 | 137 | 20364 | 43.44 | 2112 | 2064 | 421.2 |
| B | 3 | 64 | 198345 | 491.51 | 2103 | 2045 | 399.4 |
| B | 0 | 230 | 90152 | 220.61 | 2103 | 2045 | 399.4 |
| B | 12 | 111 | 50307 | 120.84 | 2103 | 2045 | 399.4 |
| C | 4 | 254 | 667925 | 1411.82 | 2025 | 2036 | 471.7 |
| C | 14 | 238 | 322148 | 678.7 | 2025 | 2036 | 471.7 |
| C | 3 | 233 | 284249 | 598.35 | 2025 | 2036 | 471.7 |
| D | 1 | 52 | 1749137 | 3617.48 | 2041 | 1994 | 483.0 |
| D | 11 | 176 | 1042648 | 2154.69 | 2041 | 1994 | 483.0 |
| D | 12 | 233 | 407296 | 839.18 | 2041 | 1994 | 483.0 |
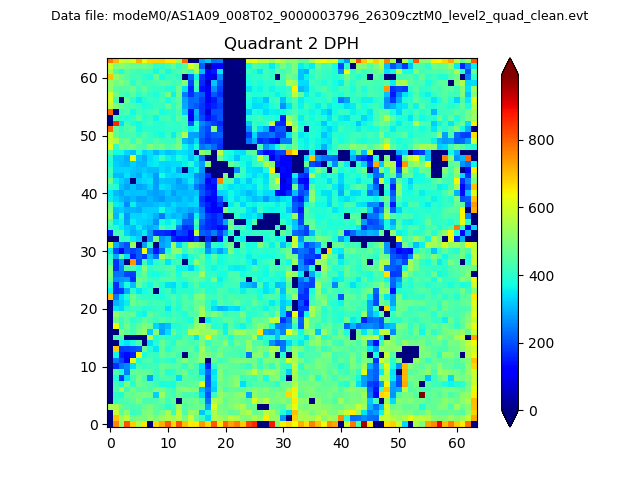
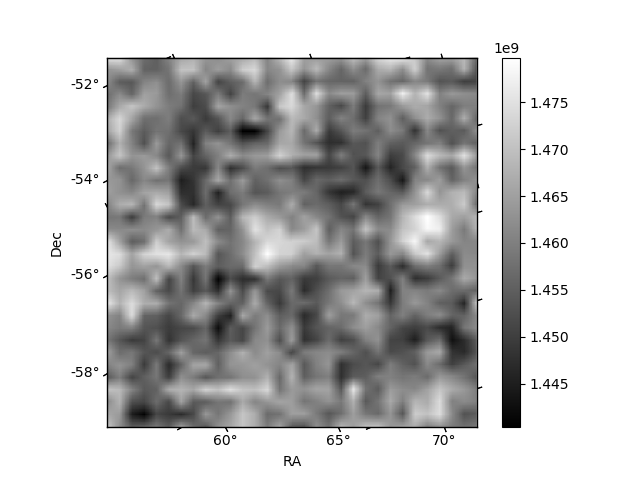
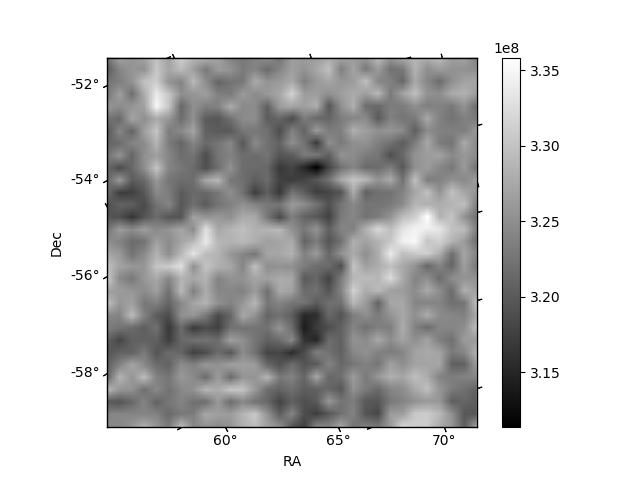
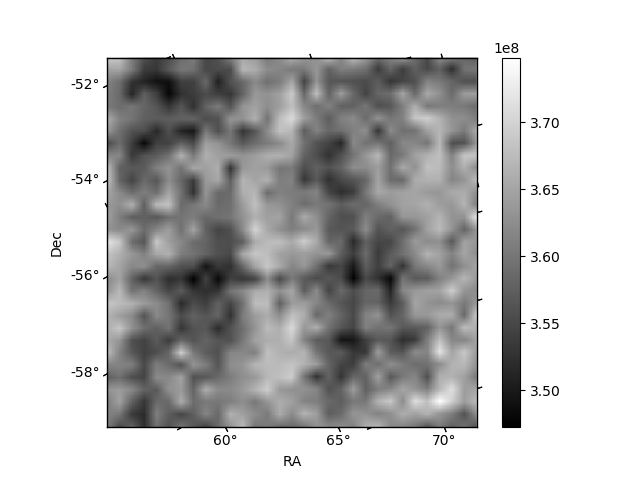
Histogram calculated using DETX and DETY for each event in the final _common_clean file
| Quadrant A | 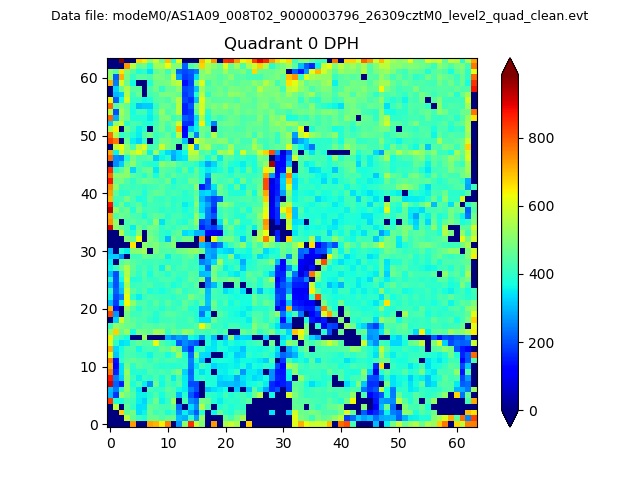 |
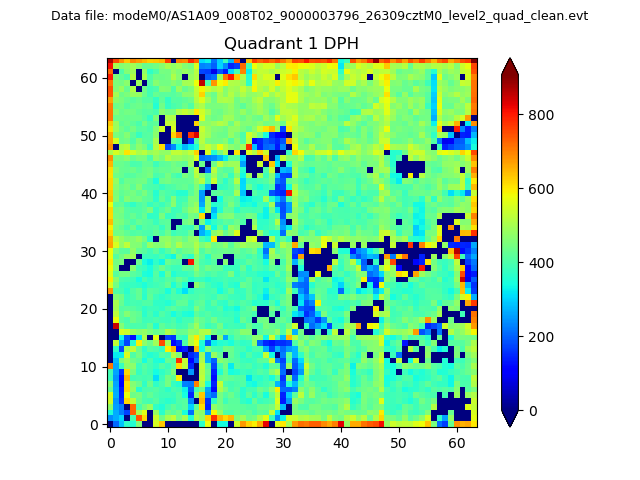 |
Quadrant B |
|---|---|---|---|
| Quadrant D | 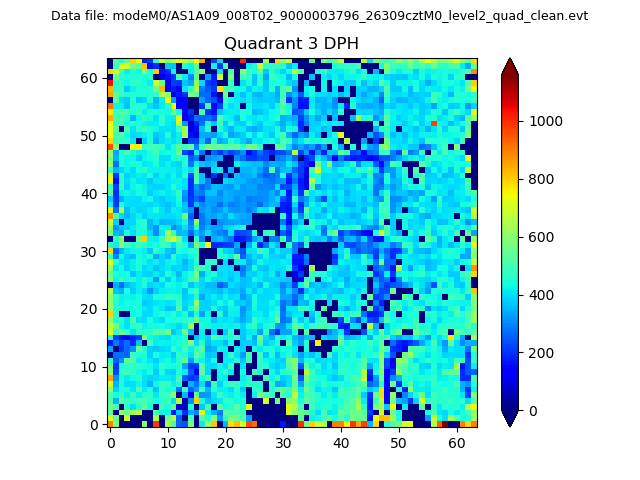 |
 |
Quadrant C |
| Plot type | Count rate plots | Images |
|---|---|---|
| Comparison with Poisson distribution Blue bars denote a histogram of data divided into 1 sec bins. Red curve is a Poisson curve with rate = median count rate of data. |
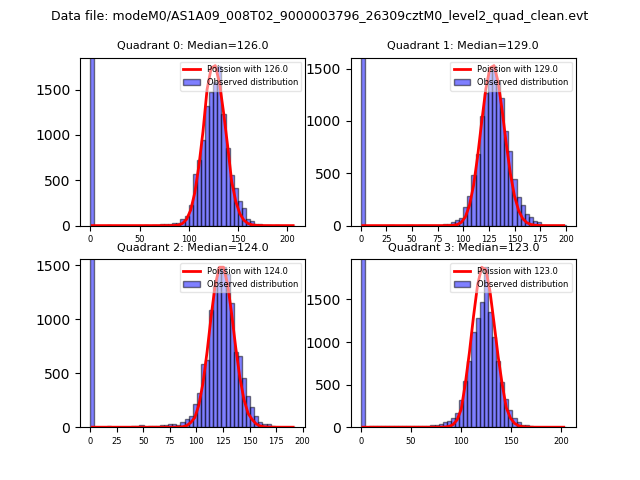 |
 |
| Quadrant-wise count rates Data is divided into 100 sec bins |
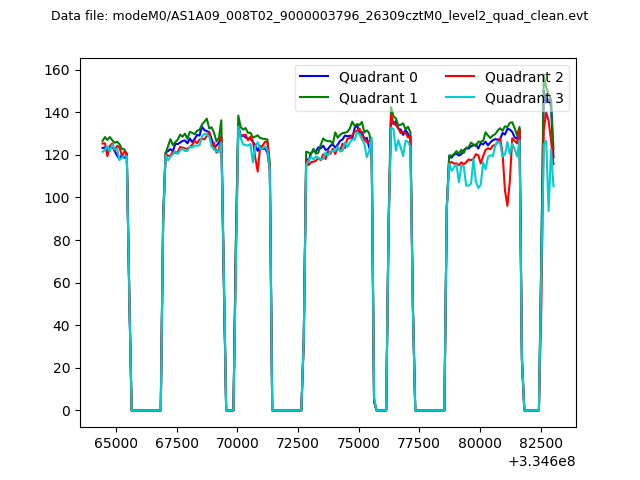 |
|
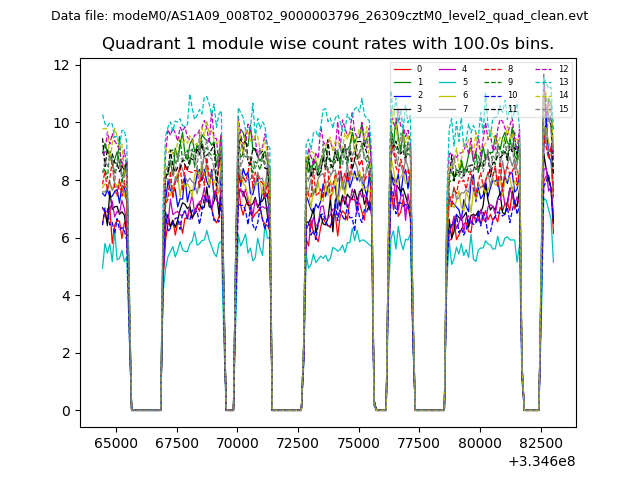
| Module-wise count rates for Quadrant A Data is divided into 100 sec bins |
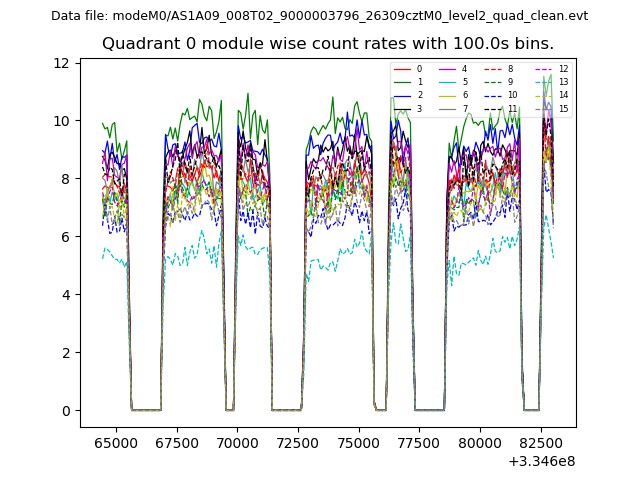 |
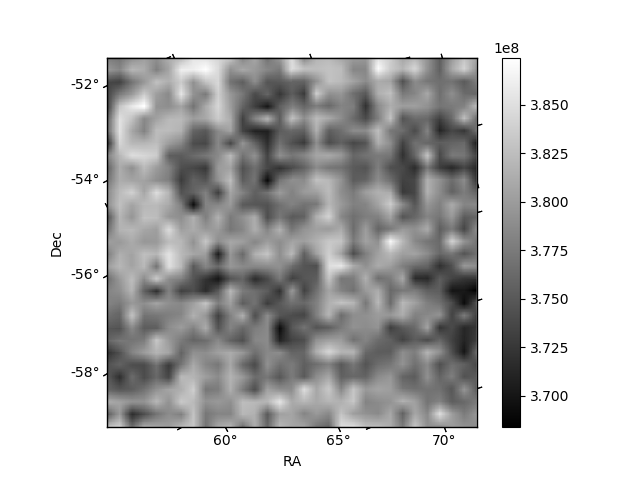 |
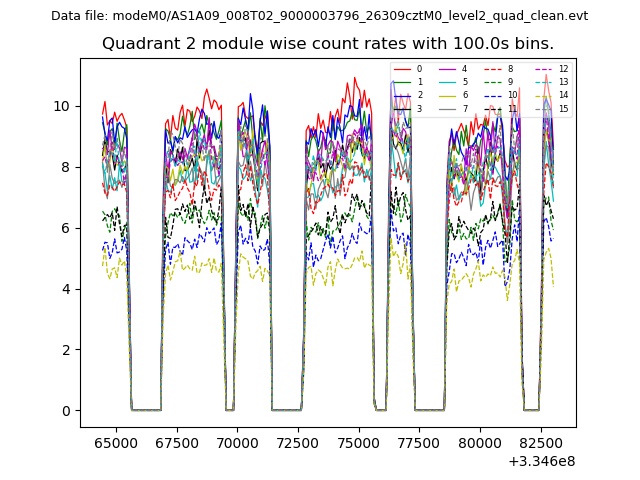
| Module-wise count rates for Quadrant B Data is divided into 100 sec bins |
 |
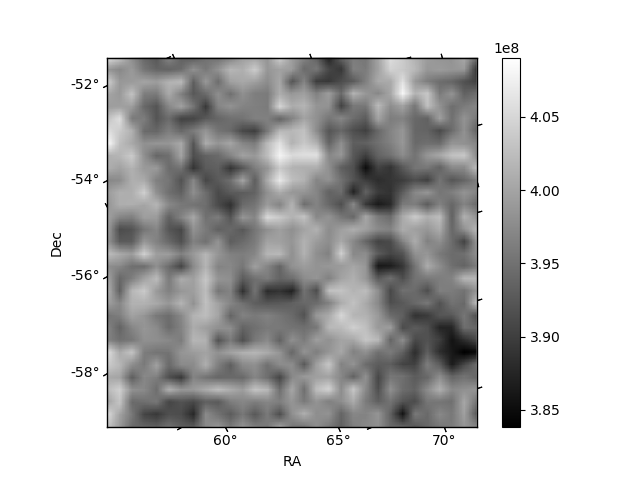 |
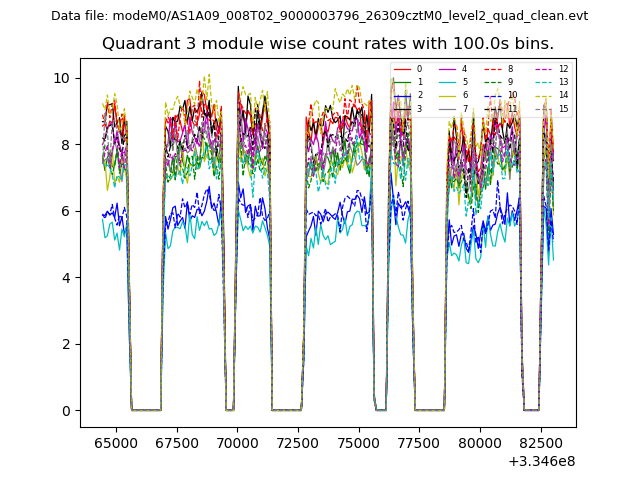
| Module-wise count rates for Quadrant C Data is divided into 100 sec bins |
 |
 |
| Module-wise count rates for Quadrant D Data is divided into 100 sec bins |
 |
 |
| Parameter | Plot |
|---|---|
| CZT HV Monitor | 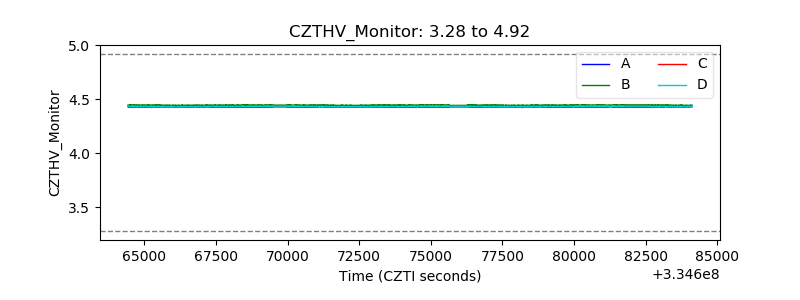 |
| D_VDD | 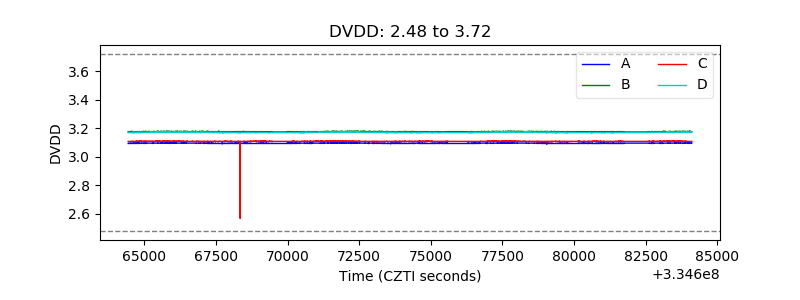 |
| Temperature 1 | 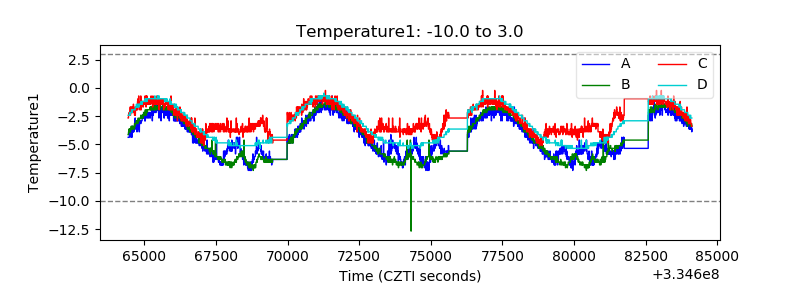 |
| Veto HV Monitor | 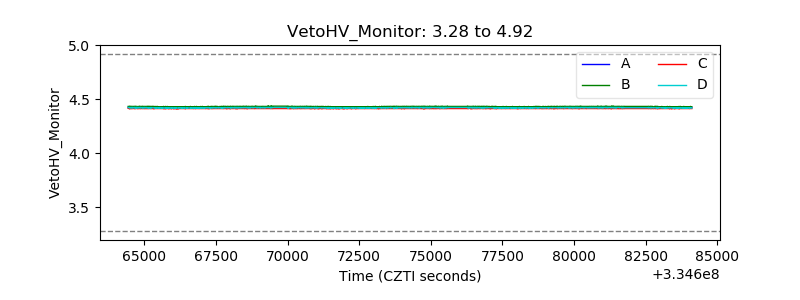 |
| Veto LLD | 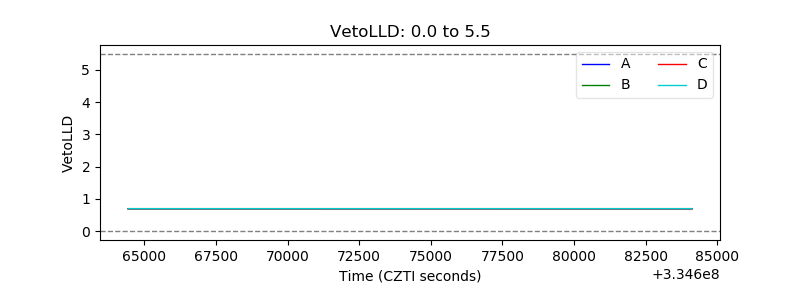 |
| Alpha Counter | 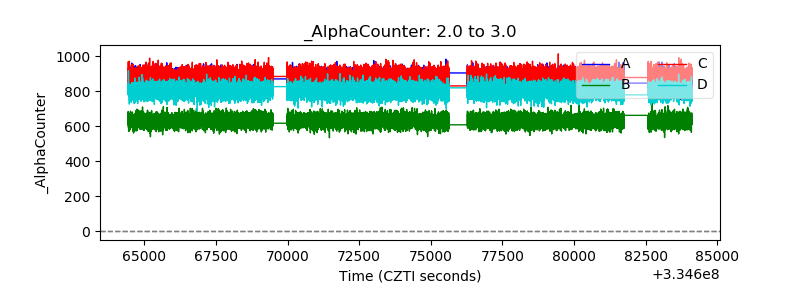 |
| _CPM_Rate | 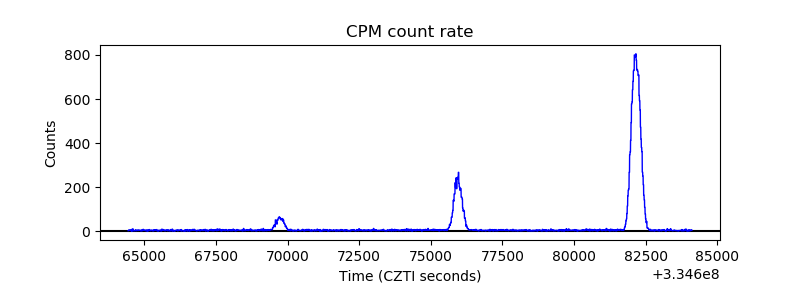 |
| CZT Counter | 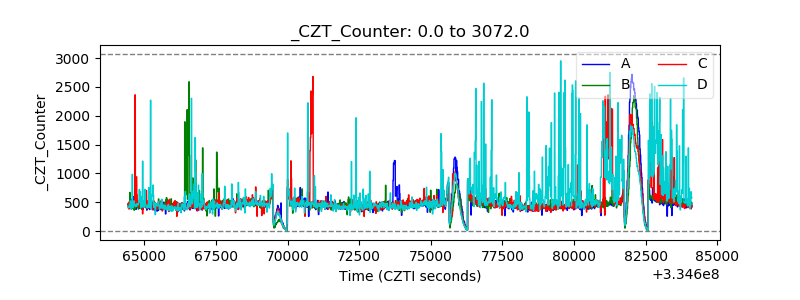 |
| +2.5 Volts monitor | 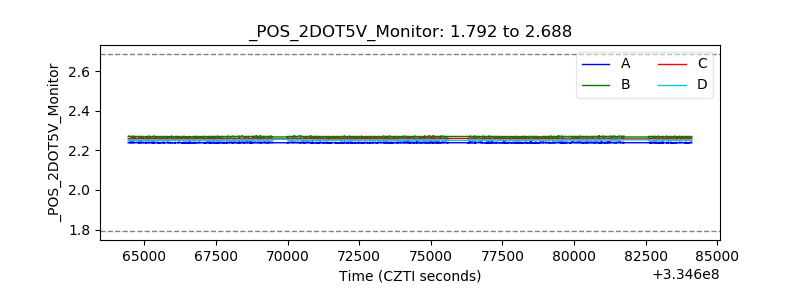 |
| +5 Volts monitor |  |
| _ROLL_ROT | 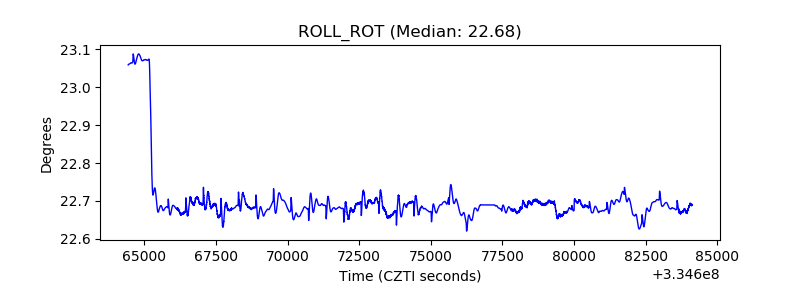 |
| _Roll_DEC | 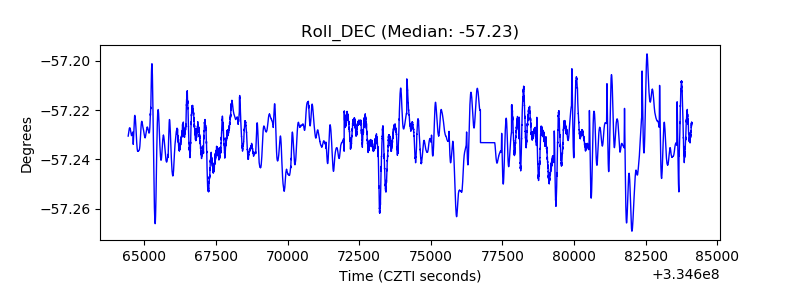 |
| _Roll_RA | 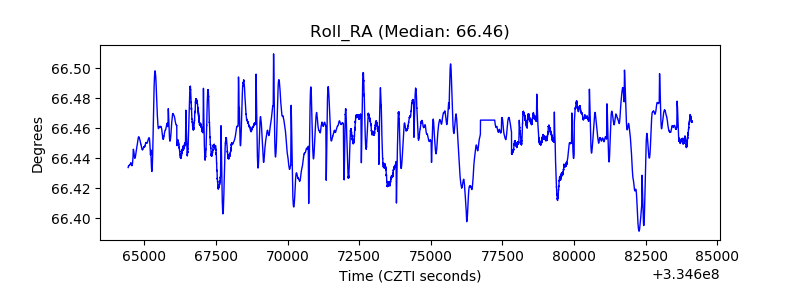 |
| Veto Counter | 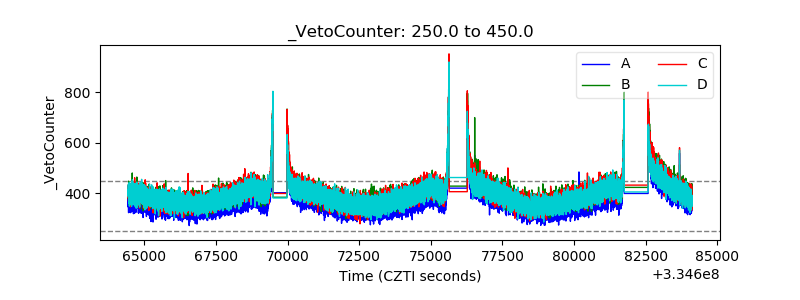 |