| Param | Original file | Final file |
|---|---|---|
| Filename | modeM0/AS1A09_008T02_9000003796_26310cztM0_level2.evt | modeM0/AS1A09_008T02_9000003796_26310cztM0_level2_quad_clean.evt |
| Size (bytes) | 1,552,469,760 | 310,824,000 |
| Size | 1.4 GB | 296.4 MB |
| Events in quadrant A | 10,457,044 | 1,977,970 |
| Events in quadrant B | 11,031,985 | 2,023,734 |
| Events in quadrant C | 11,075,428 | 1,943,703 |
| Events in quadrant D | 12,928,728 | 1,917,846 |
| Mode M0 | |||
|---|---|---|---|
| Quadrant | BADHDUFLAG | Total packets | Discarded packets |
| A | 0 | 46215 | 0 |
| B | 0 | 47596 | 0 |
| C | 0 | 47388 | 0 |
| D | 0 | 53911 | 0 |
| Mode M9 | |||
|---|---|---|---|
| Quadrant | BADHDUFLAG | Total packets | Discarded packets |
| A | 0 | 21 | 0 |
| B | 0 | 21 | 0 |
| C | 0 | 21 | 0 |
| D | 0 | 21 | 0 |
| Quadrant | Total seconds | Saturated seconds | Saturation percentage |
|---|---|---|---|
| A | 22530 | 260 | 1.154017% |
| B | 22528 | 392 | 1.740057% |
| C | 22528 | 526 | 2.334872% |
| D | 22528 | 871 | 3.866300% |
Noise dominated data is calculated using 1-second bins in cleaned event files. If a bin has >2000 counts, and if more than 50% of those come from <1% of pixels, then it is considered to be noise-dominated and hence unusable.
| Quadrant | # 1 sec bins | Bins with >0 counts | Bins with >2000 counts | High rate bins dominated by noise | Noise dominated (total time) | Noise dominated (detector-on time) | Marked lightcurve |
|---|---|---|---|---|---|---|---|
| A | 33726 | 22536 | 0 | 0 | 0.00% | 0.00% | 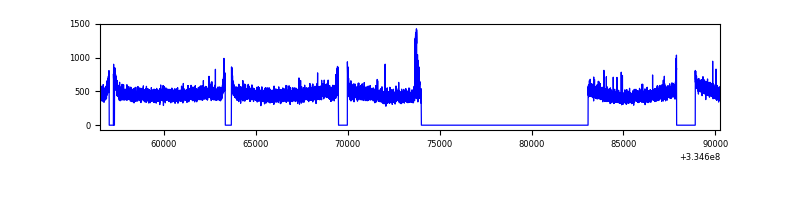 |
| B | 33725 | 22534 | 37 | 37 | 0.11% | 0.16% | 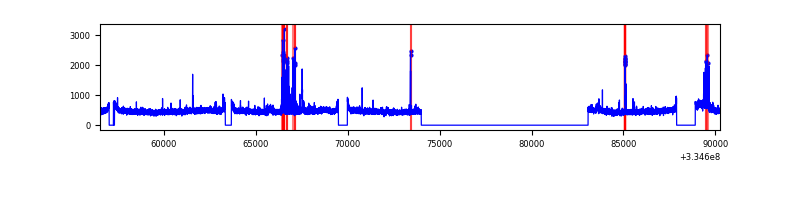 |
| C | 33725 | 22534 | 73 | 73 | 0.22% | 0.32% | 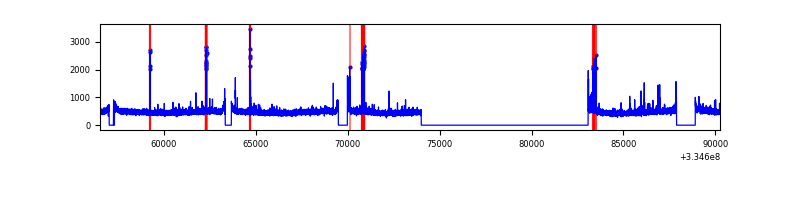 |
| D | 33725 | 22534 | 525 | 525 | 1.56% | 2.33% | 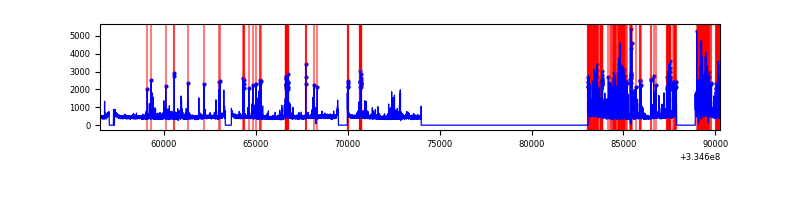 |
Top three noisy pixels from each quadrant. If the there are fewer than three noisy pixels in the level2.evt file, extra rows are filled as -1
| Pixel properties | Quadrant properties | ||||||
|---|---|---|---|---|---|---|---|
| Quadrant | DetID | PixID | Counts | Sigma | Mean | Median | Sigma |
| A | 7 | 192 | 94347 | 171.93 | 2685 | 2629 | 533.5 |
| A | 13 | 254 | 34546 | 59.83 | 2685 | 2629 | 533.5 |
| A | 3 | 137 | 25476 | 42.83 | 2685 | 2629 | 533.5 |
| B | 3 | 64 | 199082 | 390.71 | 2671 | 2598 | 502.9 |
| B | 0 | 230 | 148786 | 290.7 | 2671 | 2598 | 502.9 |
| B | 15 | 185 | 87393 | 168.62 | 2671 | 2598 | 502.9 |
| C | 14 | 238 | 411086 | 680.6 | 2587 | 2602 | 600.2 |
| C | 3 | 233 | 284948 | 470.43 | 2587 | 2602 | 600.2 |
| C | 4 | 254 | 163917 | 268.78 | 2587 | 2602 | 600.2 |
| D | 1 | 52 | 2148226 | 3498.08 | 2592 | 2529 | 613.4 |
| D | 11 | 176 | 428275 | 694.08 | 2592 | 2529 | 613.4 |
| D | 12 | 233 | 274418 | 443.25 | 2592 | 2529 | 613.4 |
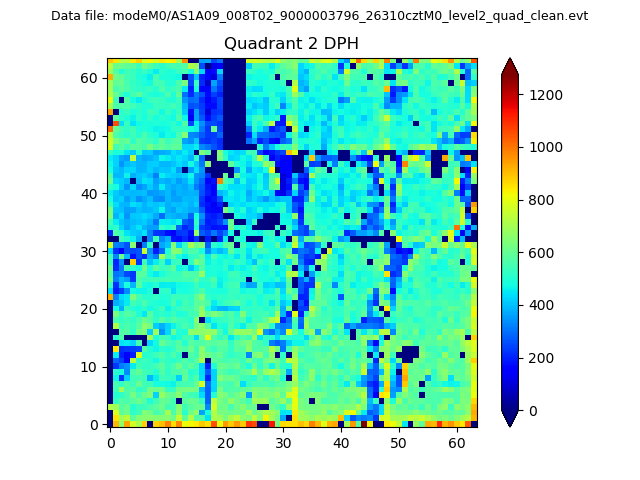
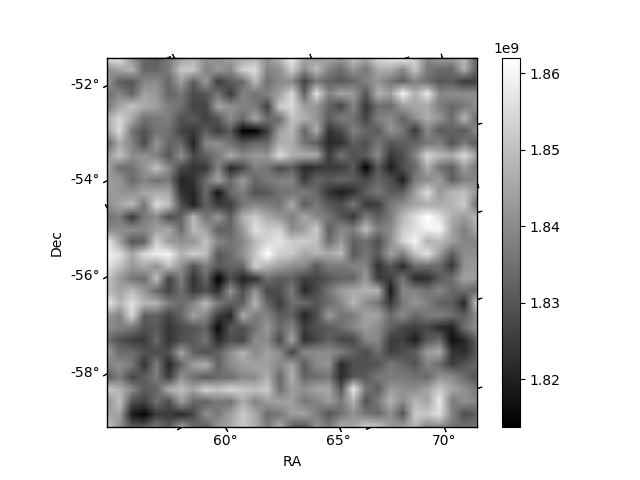
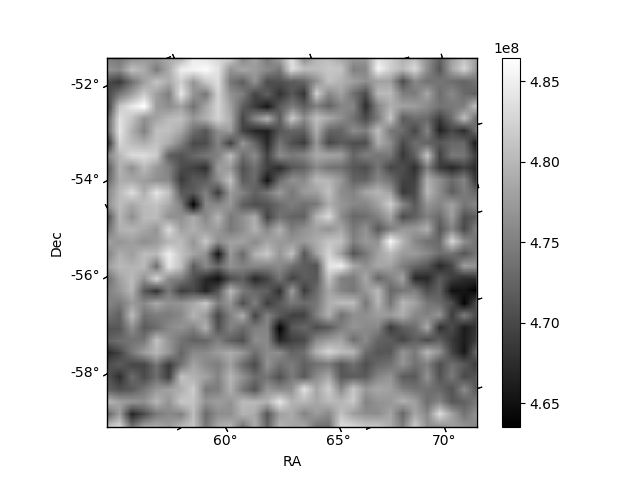
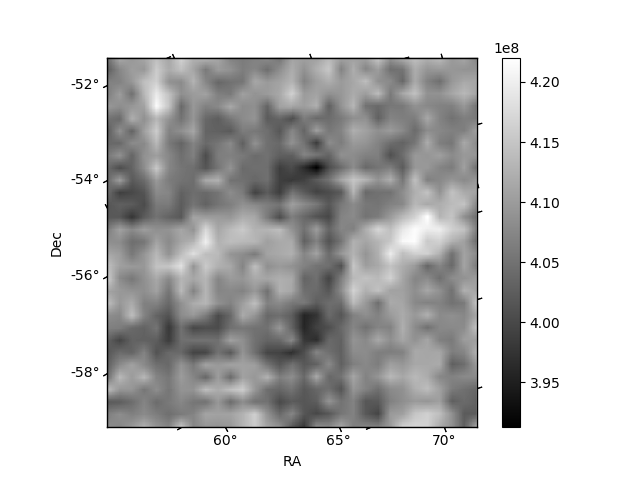
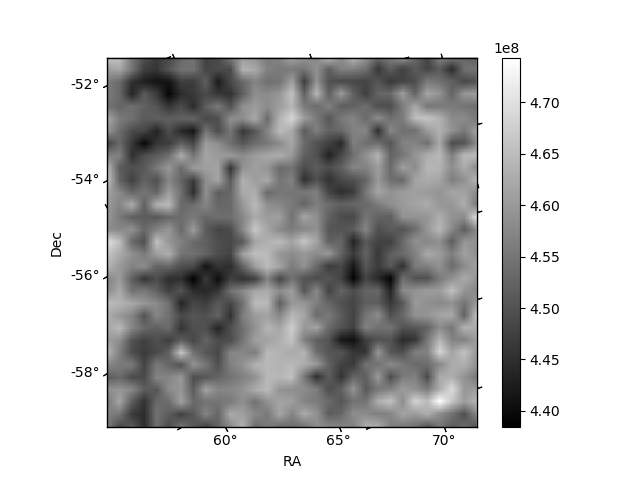
Histogram calculated using DETX and DETY for each event in the final _common_clean file
| Quadrant A | 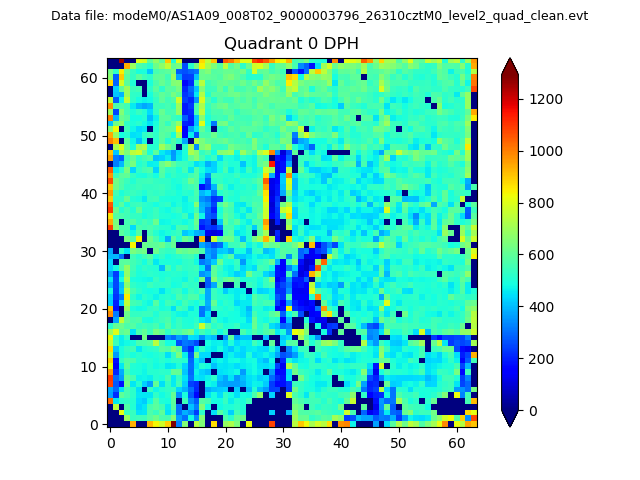 |
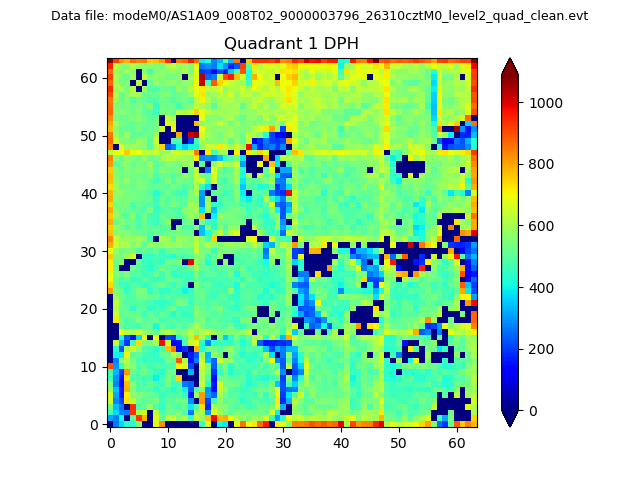 |
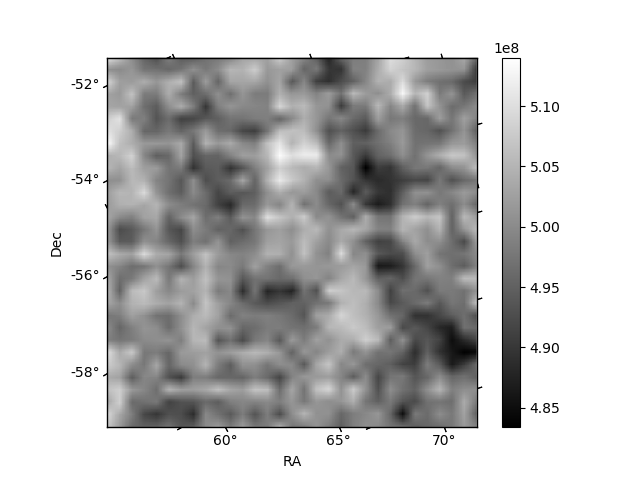
Quadrant B |
|---|---|---|---|
| Quadrant D | 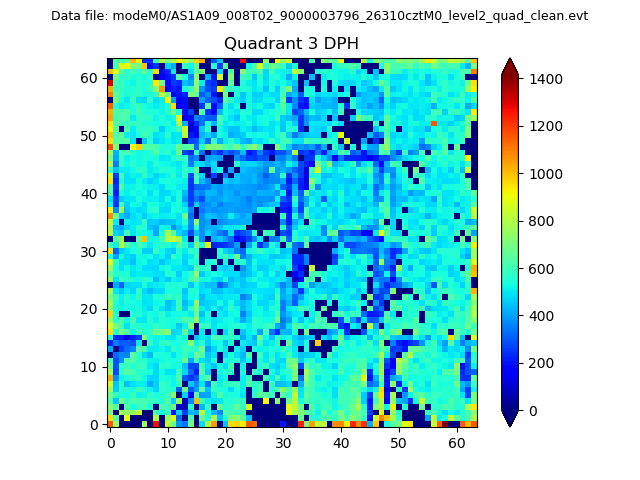 |
 |
Quadrant C |
| Plot type | Count rate plots | Images |
|---|---|---|
| Comparison with Poisson distribution Blue bars denote a histogram of data divided into 1 sec bins. Red curve is a Poisson curve with rate = median count rate of data. |
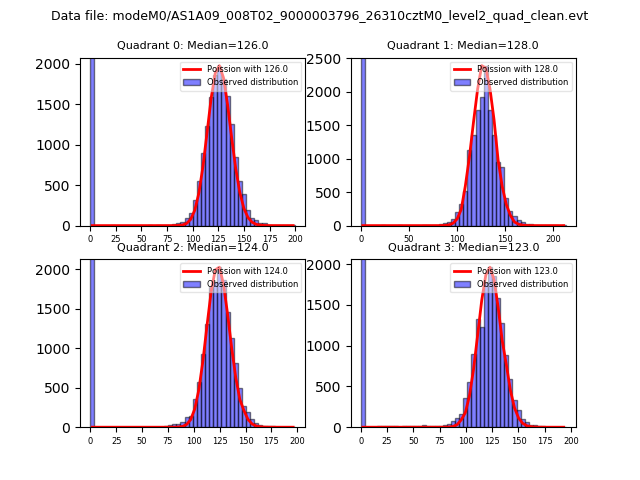 |
 |
| Quadrant-wise count rates Data is divided into 100 sec bins |
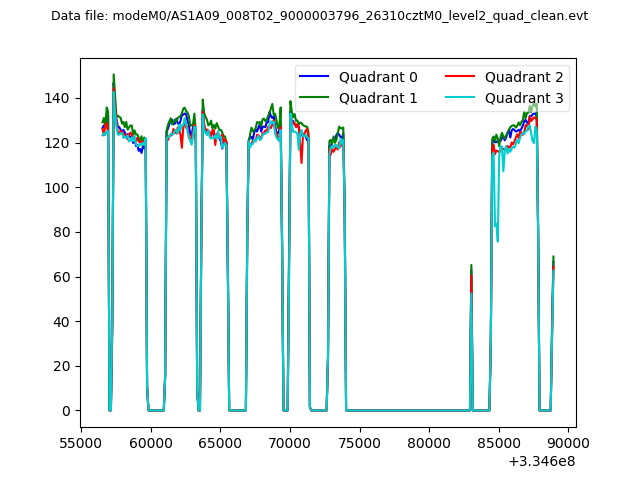 |
|
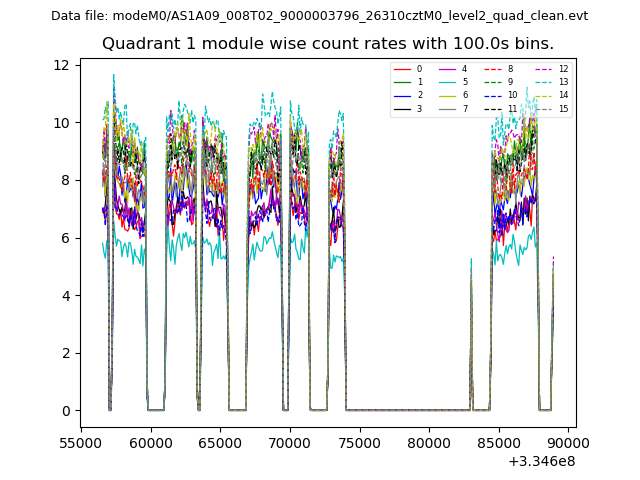
| Module-wise count rates for Quadrant A Data is divided into 100 sec bins |
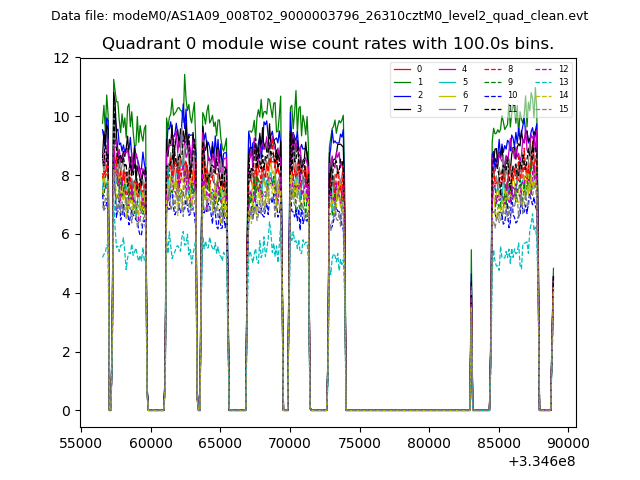 |
 |
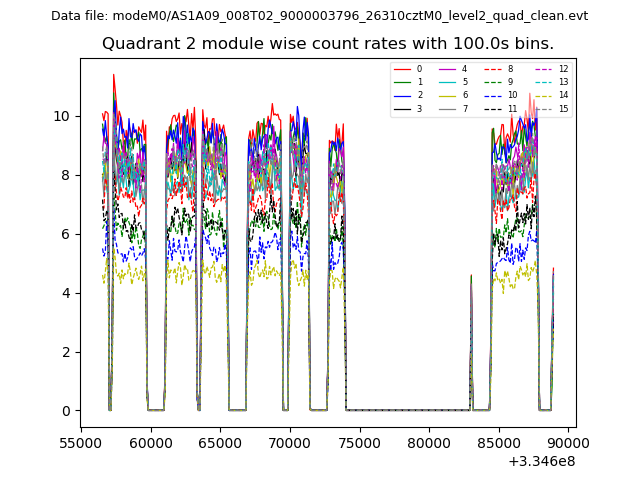
| Module-wise count rates for Quadrant B Data is divided into 100 sec bins |
 |
 |
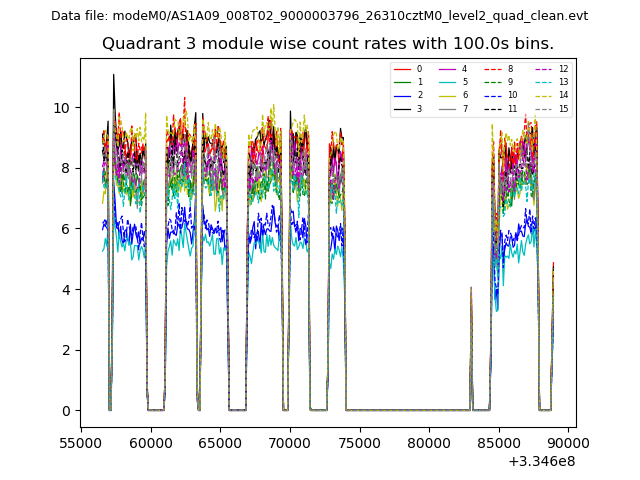
| Module-wise count rates for Quadrant C Data is divided into 100 sec bins |
 |
 |
| Module-wise count rates for Quadrant D Data is divided into 100 sec bins |
 |
 |
| Parameter | Plot |
|---|---|
| CZT HV Monitor | 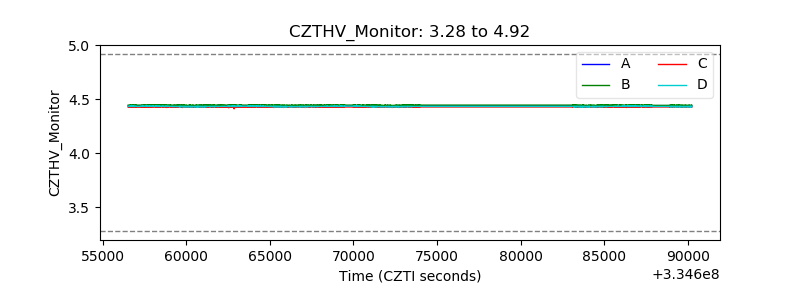 |
| D_VDD | 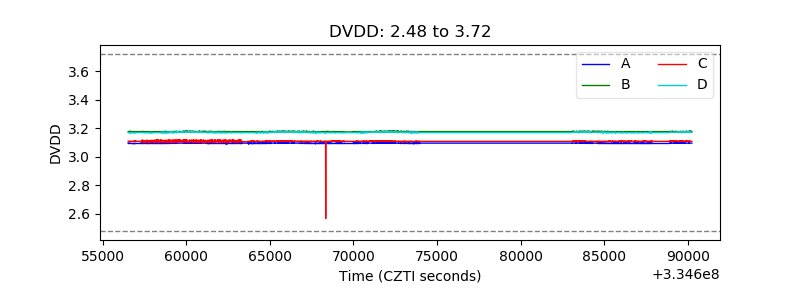 |
| Temperature 1 | 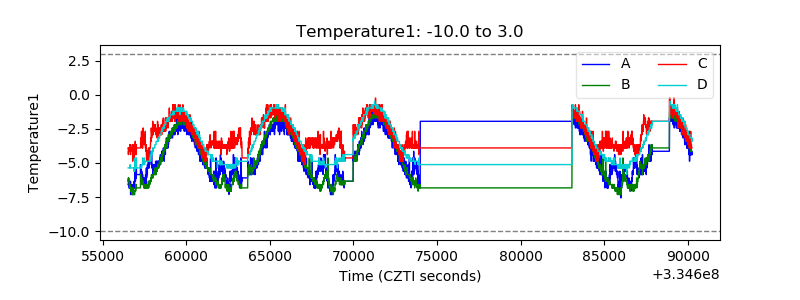 |
| Veto HV Monitor | 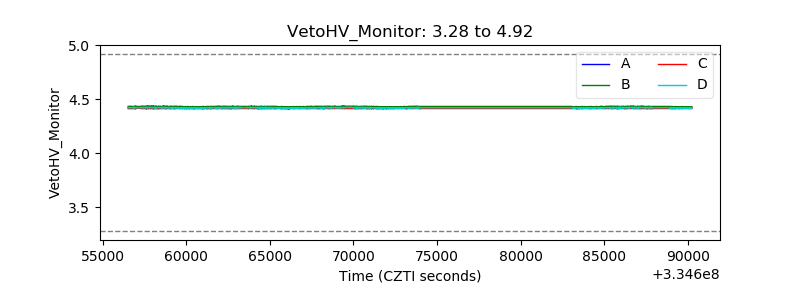 |
| Veto LLD | 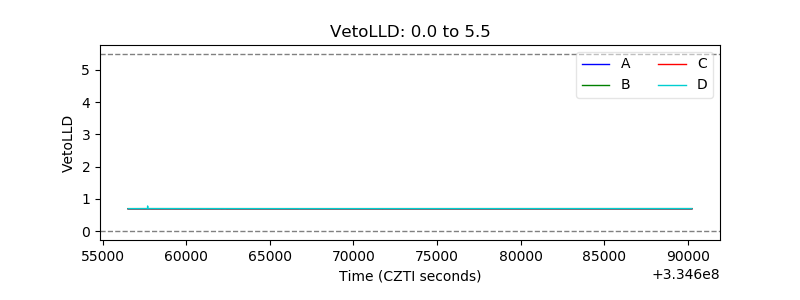 |
| Alpha Counter | 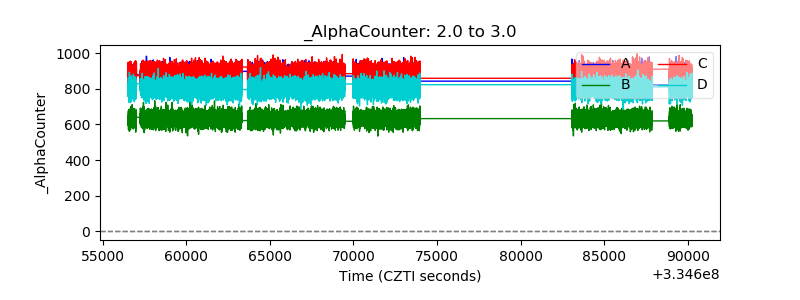 |
| _CPM_Rate | 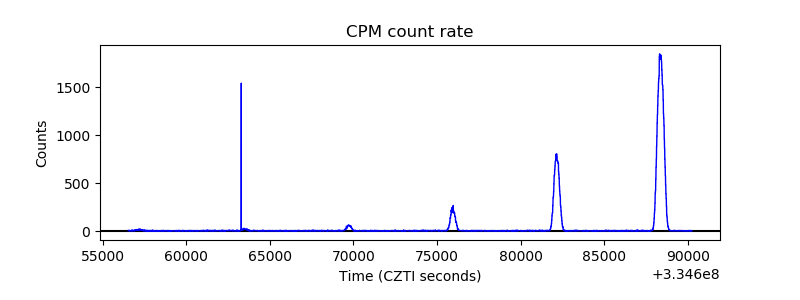 |
| CZT Counter | 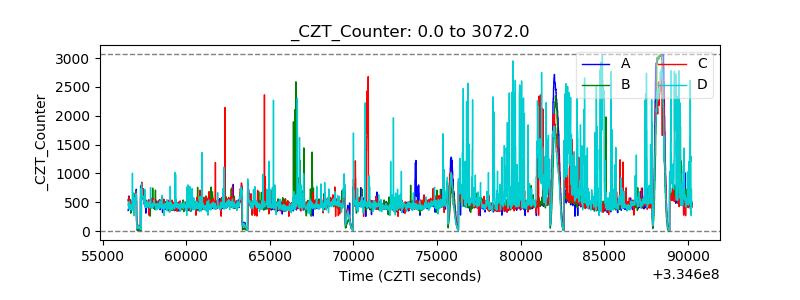 |
| +2.5 Volts monitor |  |
| +5 Volts monitor |  |
| _ROLL_ROT | 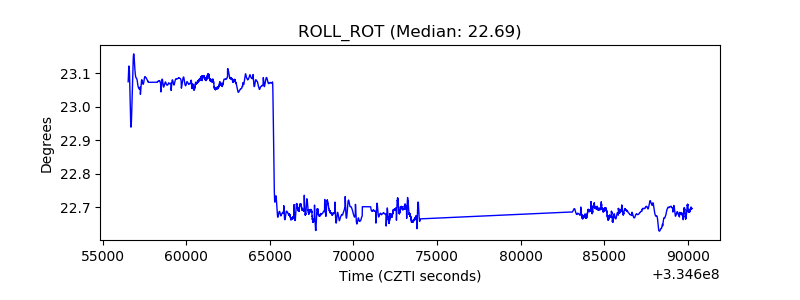 |
| _Roll_DEC | 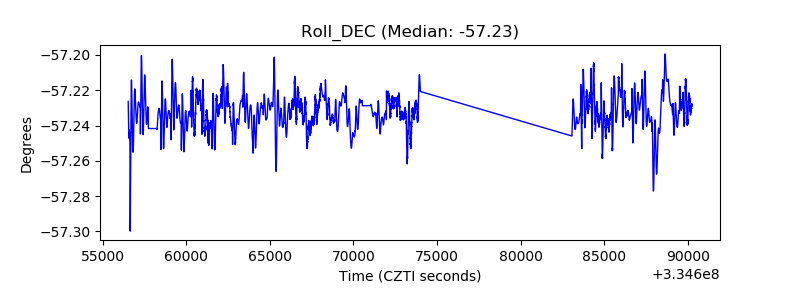 |
| _Roll_RA | 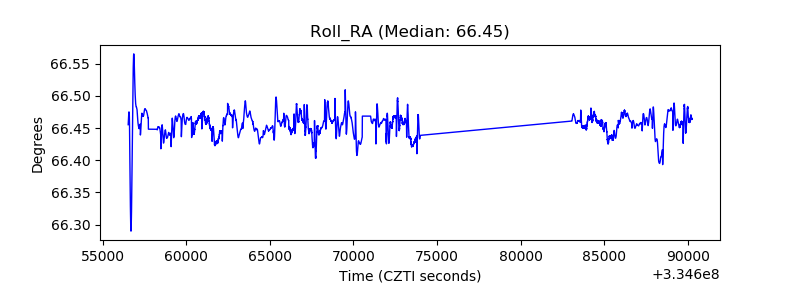 |
| Veto Counter | 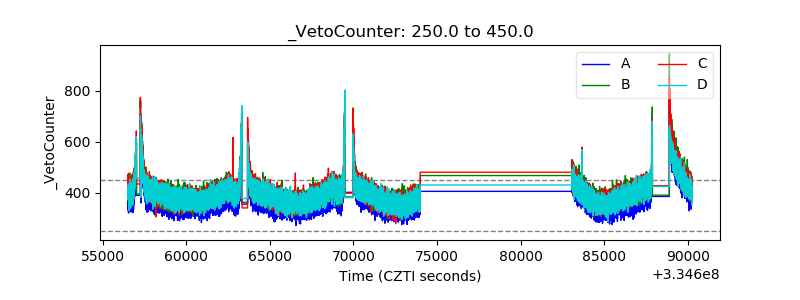 |