| Param | Original file | Final file |
|---|---|---|
| Filename | modeM0/AS1A09_008T02_9000003796_26312cztM0_level2.evt | modeM0/AS1A09_008T02_9000003796_26312cztM0_level2_quad_clean.evt |
| Size (bytes) | 503,017,920 | 80,873,280 |
| Size | 479.7 MB | 77.1 MB |
| Events in quadrant A | 3,004,663 | 514,185 |
| Events in quadrant B | 3,234,707 | 523,441 |
| Events in quadrant C | 3,079,850 | 497,857 |
| Events in quadrant D | 5,494,868 | 481,709 |
| Mode M0 | |||
|---|---|---|---|
| Quadrant | BADHDUFLAG | Total packets | Discarded packets |
| A | 0 | 12973 | 0 |
| B | 0 | 13681 | 0 |
| C | 0 | 13020 | 0 |
| D | 0 | 20542 | 0 |
| Mode M9 | |||
|---|---|---|---|
| Quadrant | BADHDUFLAG | Total packets | Discarded packets |
| A | 0 | 11 | 0 |
| B | 0 | 11 | 0 |
| C | 0 | 11 | 0 |
| D | 0 | 11 | 0 |
| Quadrant | Total seconds | Saturated seconds | Saturation percentage |
|---|---|---|---|
| A | 6184 | 33 | 0.533635% |
| B | 6185 | 65 | 1.050930% |
| C | 6185 | 62 | 1.002425% |
| D | 6184 | 812 | 13.130660% |
Noise dominated data is calculated using 1-second bins in cleaned event files. If a bin has >2000 counts, and if more than 50% of those come from <1% of pixels, then it is considered to be noise-dominated and hence unusable.
| Quadrant | # 1 sec bins | Bins with >0 counts | Bins with >2000 counts | High rate bins dominated by noise | Noise dominated (total time) | Noise dominated (detector-on time) | Marked lightcurve |
|---|---|---|---|---|---|---|---|
| A | 7319 | 6184 | 0 | 0 | 0.00% | 0.00% | 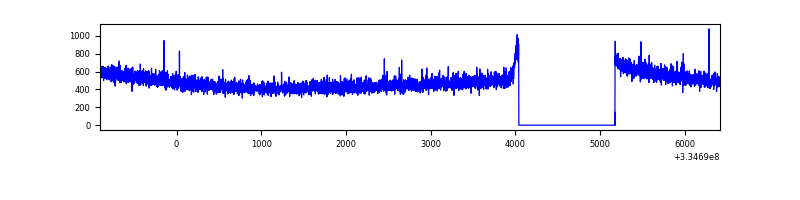 |
| B | 7320 | 6185 | 6 | 6 | 0.08% | 0.10% | 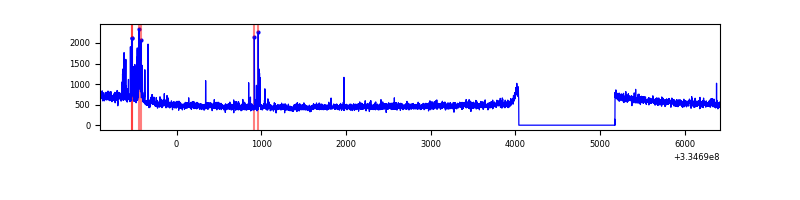 |
| C | 7320 | 6185 | 0 | 0 | 0.00% | 0.00% | 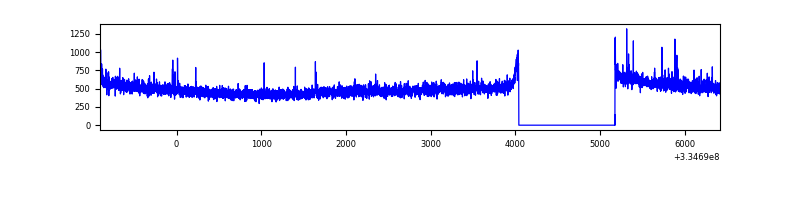 |
| D | 7319 | 6184 | 634 | 634 | 8.66% | 10.25% | 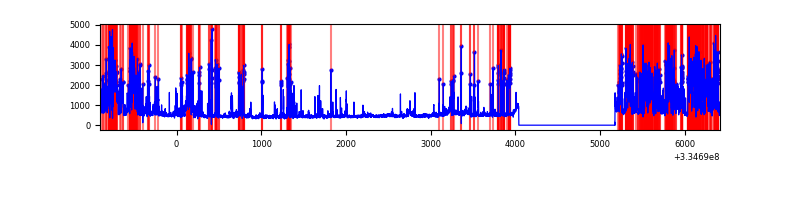 |
Top three noisy pixels from each quadrant. If the there are fewer than three noisy pixels in the level2.evt file, extra rows are filled as -1
| Pixel properties | Quadrant properties | ||||||
|---|---|---|---|---|---|---|---|
| Quadrant | DetID | PixID | Counts | Sigma | Mean | Median | Sigma |
| A | 13 | 254 | 9631 | 57.22 | 778 | 763 | 155.0 |
| A | 3 | 137 | 7047 | 40.55 | 778 | 763 | 155.0 |
| A | 0 | 226 | 6681 | 38.19 | 778 | 763 | 155.0 |
| B | 7 | 219 | 71311 | 480.49 | 777 | 759 | 146.8 |
| B | 0 | 230 | 63085 | 424.47 | 777 | 759 | 146.8 |
| B | 7 | 235 | 30287 | 201.1 | 777 | 759 | 146.8 |
| C | 14 | 238 | 121243 | 701.48 | 744 | 749 | 171.8 |
| C | 3 | 233 | 36826 | 210.03 | 744 | 749 | 171.8 |
| C | 2 | 16 | 19242 | 107.66 | 744 | 749 | 171.8 |
| D | 1 | 52 | 2033524 | 12149.92 | 707 | 691 | 167.3 |
| D | 13 | 168 | 682974 | 4077.9 | 707 | 691 | 167.3 |
| D | 12 | 233 | 41728 | 245.27 | 707 | 691 | 167.3 |
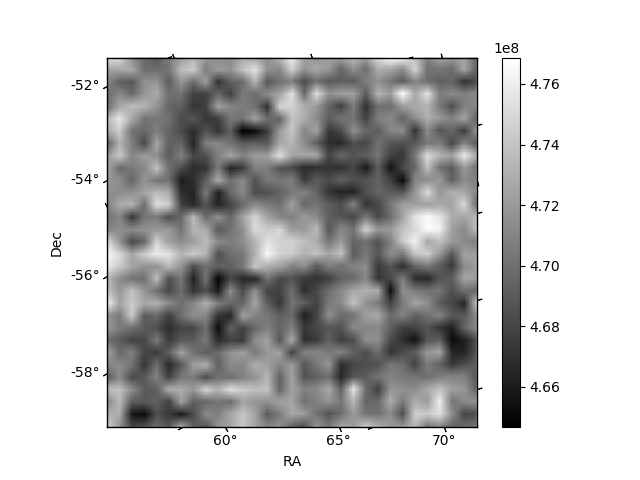
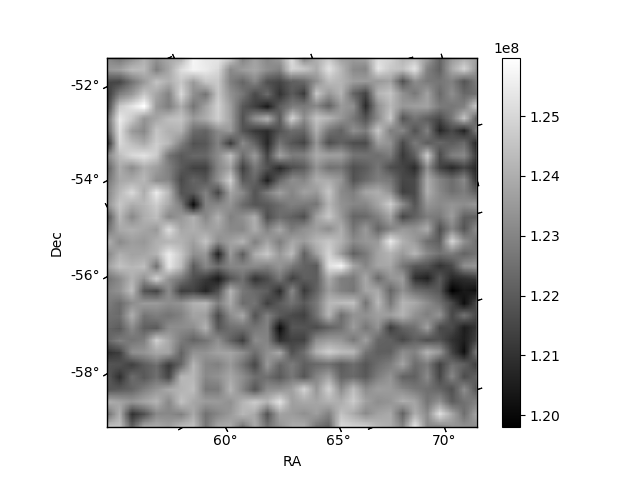
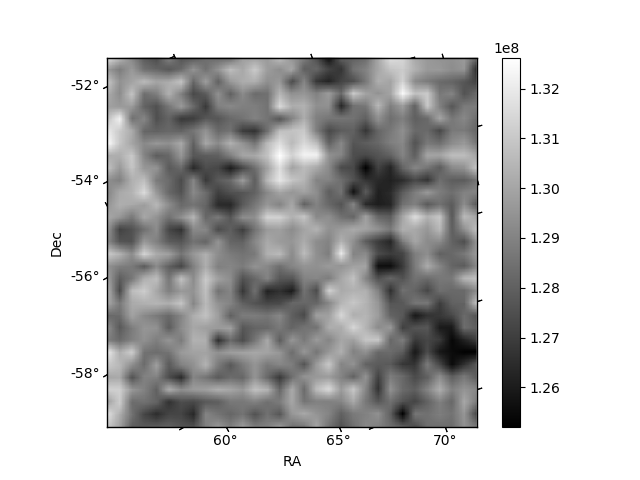
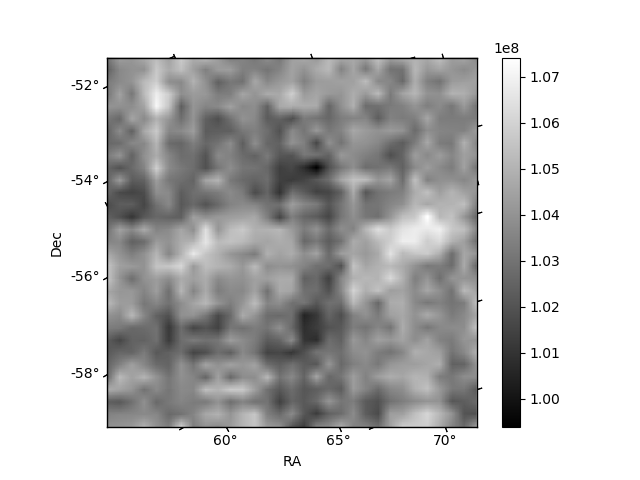
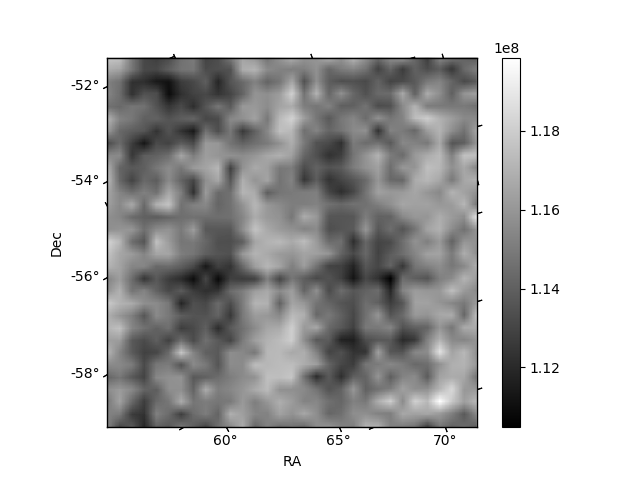
Histogram calculated using DETX and DETY for each event in the final _common_clean file
| Quadrant A | 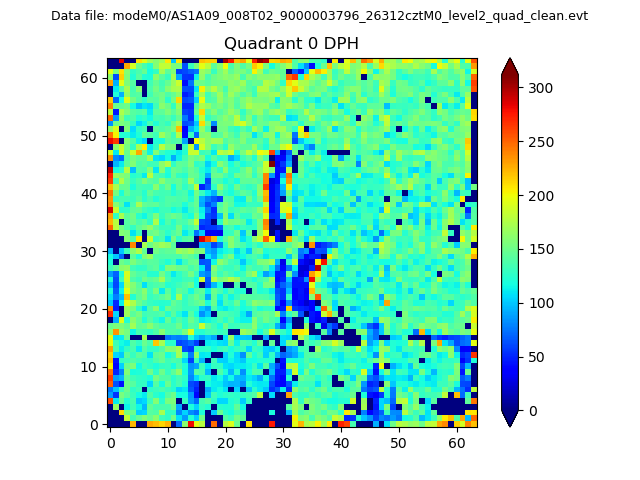 |
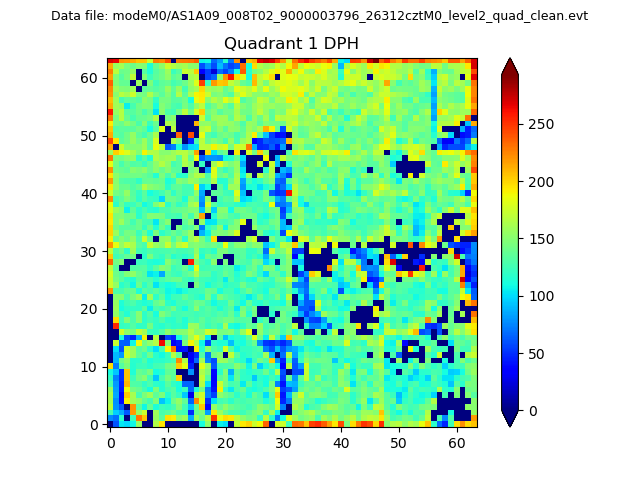 |
Quadrant B |
|---|---|---|---|
| Quadrant D |  |
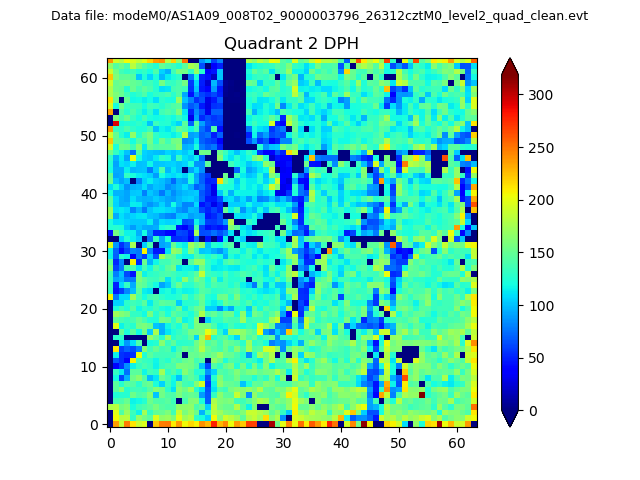 |
Quadrant C |
| Plot type | Count rate plots | Images |
|---|---|---|
| Comparison with Poisson distribution Blue bars denote a histogram of data divided into 1 sec bins. Red curve is a Poisson curve with rate = median count rate of data. |
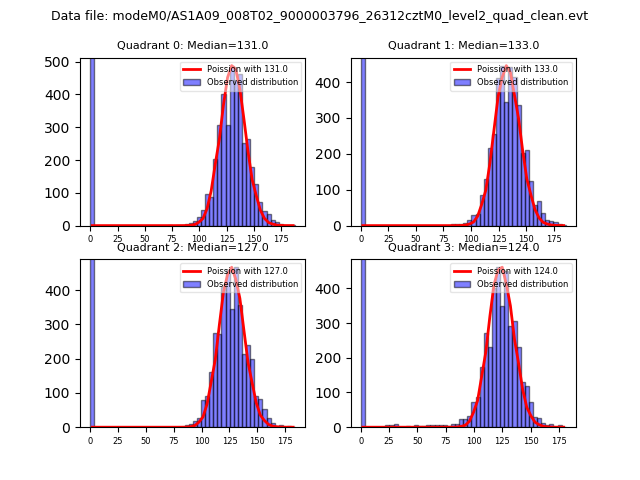 |
 |
| Quadrant-wise count rates Data is divided into 100 sec bins |
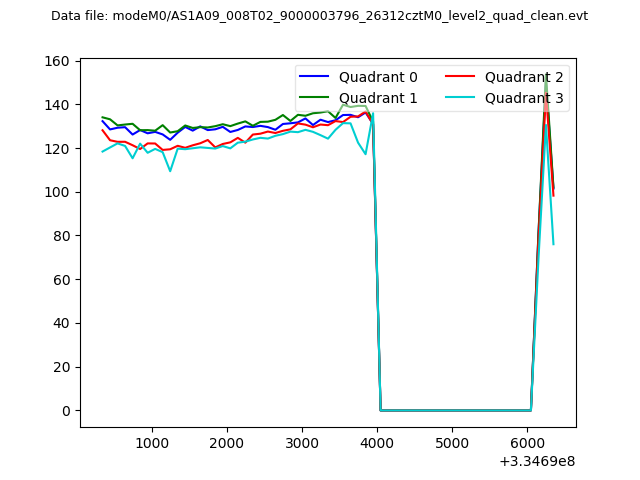 |
|
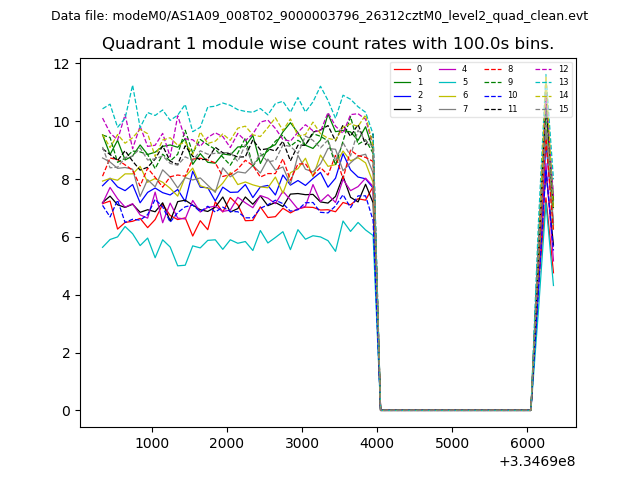
| Module-wise count rates for Quadrant A Data is divided into 100 sec bins |
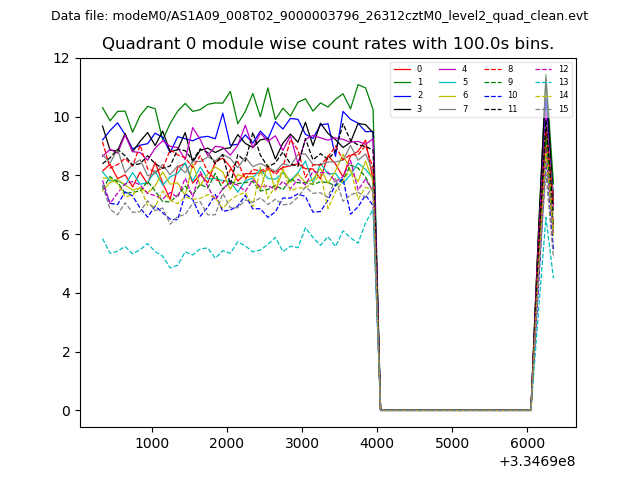 |
 |
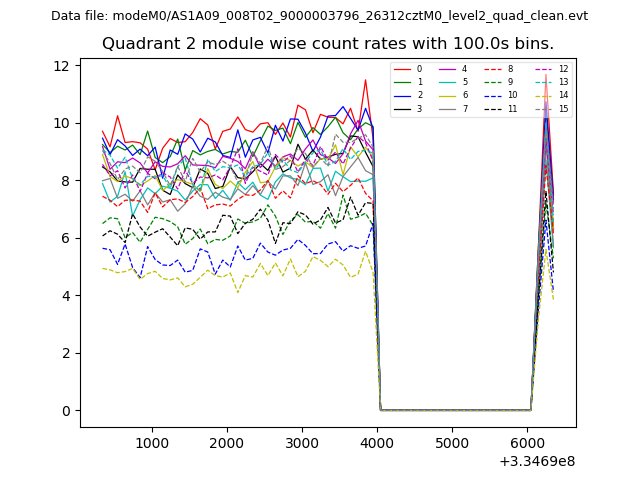
| Module-wise count rates for Quadrant B Data is divided into 100 sec bins |
 |
 |
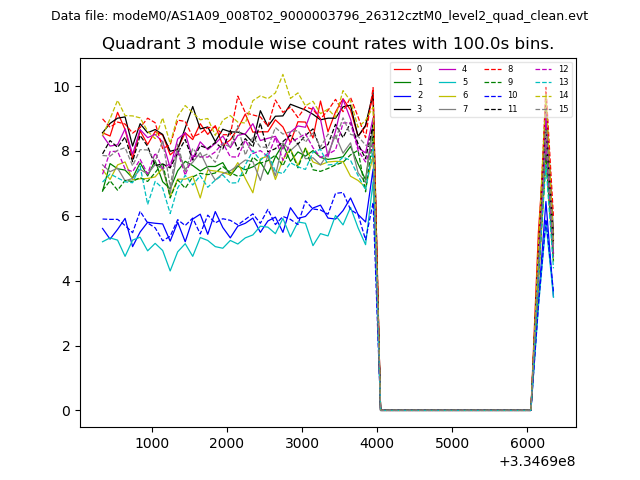
| Module-wise count rates for Quadrant C Data is divided into 100 sec bins |
 |
 |
| Module-wise count rates for Quadrant D Data is divided into 100 sec bins |
 |
 |
| Parameter | Plot |
|---|---|
| CZT HV Monitor | 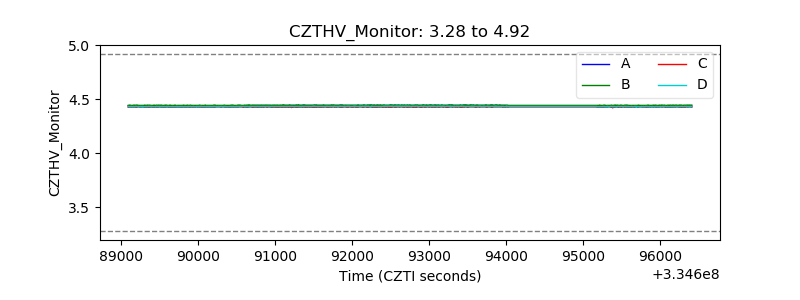 |
| D_VDD | 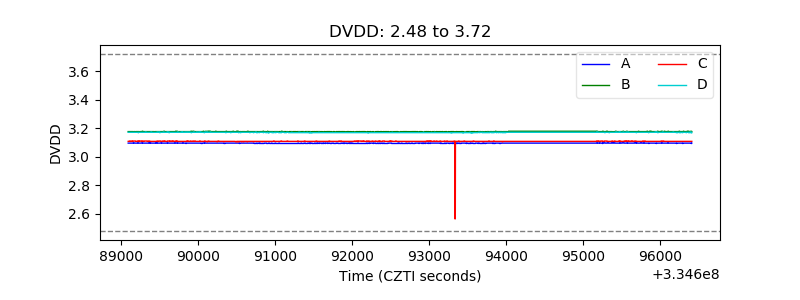 |
| Temperature 1 | 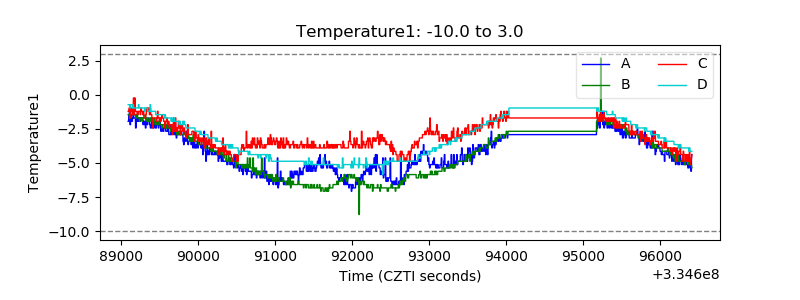 |
| Veto HV Monitor |  |
| Veto LLD | 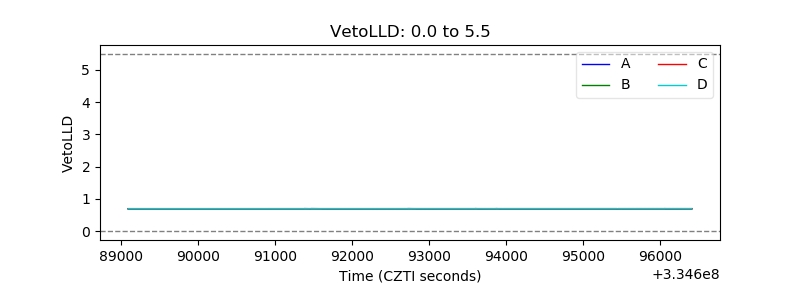 |
| Alpha Counter | 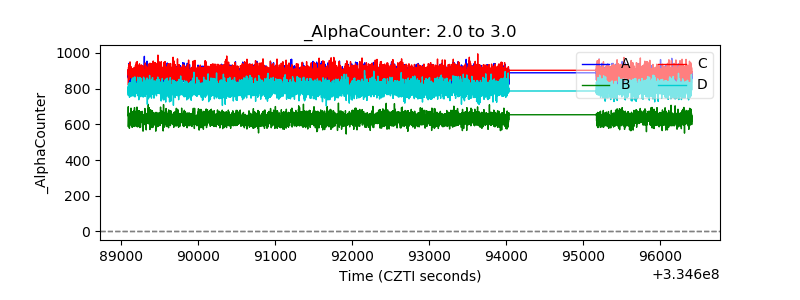 |
| _CPM_Rate |  |
| CZT Counter | 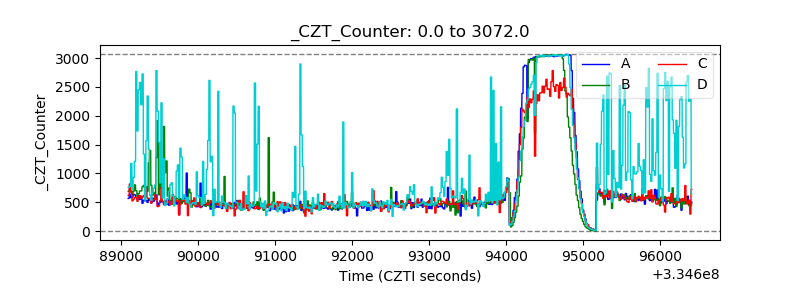 |
| +2.5 Volts monitor | 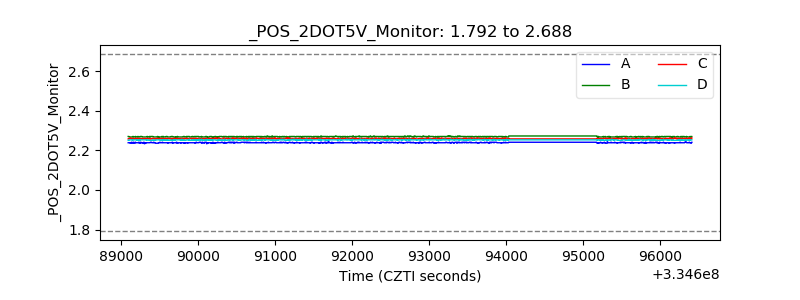 |
| +5 Volts monitor | 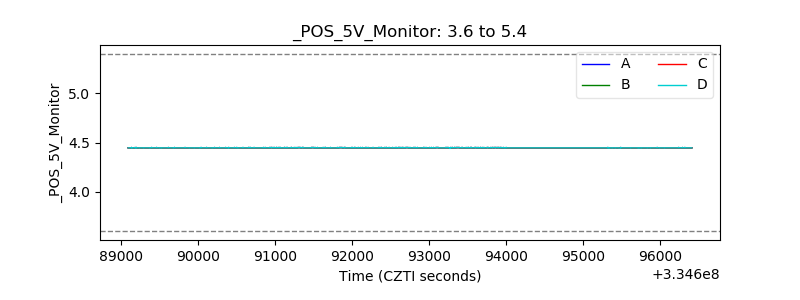 |
| _ROLL_ROT | 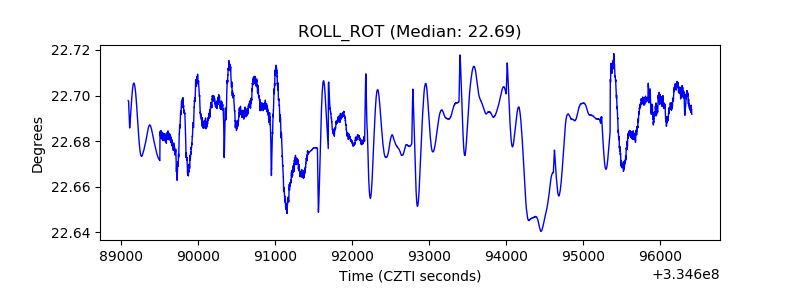 |
| _Roll_DEC | 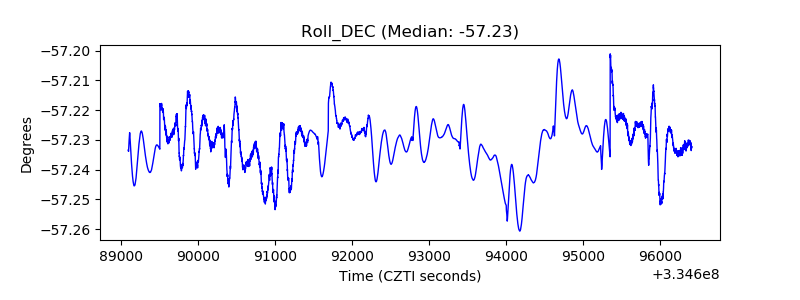 |
| _Roll_RA | 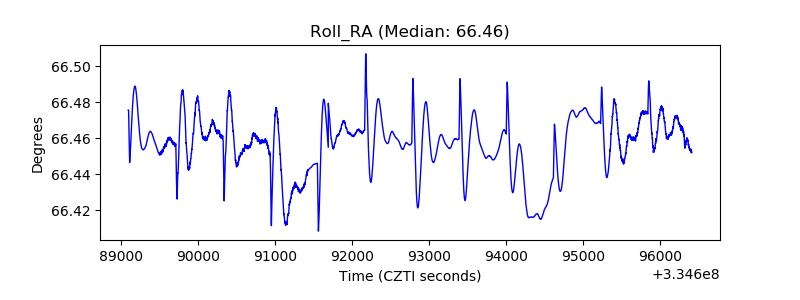 |
| Veto Counter | 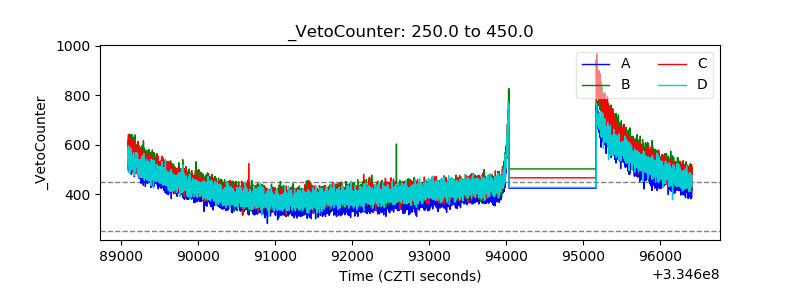 |