| Param | Original file | Final file |
|---|---|---|
| Filename | modeM0/AS1A09_008T02_9000003796_26313cztM0_level2.evt | modeM0/AS1A09_008T02_9000003796_26313cztM0_level2_quad_clean.evt |
| Size (bytes) | 531,123,840 | 100,298,880 |
| Size | 506.5 MB | 95.7 MB |
| Events in quadrant A | 3,221,630 | 662,164 |
| Events in quadrant B | 3,307,533 | 678,008 |
| Events in quadrant C | 3,322,859 | 641,625 |
| Events in quadrant D | 5,803,278 | 613,504 |
| Mode M0 | |||
|---|---|---|---|
| Quadrant | BADHDUFLAG | Total packets | Discarded packets |
| A | 0 | 13669 | 0 |
| B | 0 | 13852 | 0 |
| C | 0 | 13799 | 0 |
| D | 0 | 21501 | 0 |
| Mode M9 | |||
|---|---|---|---|
| Quadrant | BADHDUFLAG | Total packets | Discarded packets |
| A | 0 | 12 | 0 |
| B | 0 | 13 | 0 |
| C | 0 | 13 | 0 |
| D | 0 | 13 | 0 |
| Quadrant | Total seconds | Saturated seconds | Saturation percentage |
|---|---|---|---|
| A | 6334 | 57 | 0.899905% |
| B | 6334 | 60 | 0.947269% |
| C | 6334 | 79 | 1.247237% |
| D | 6334 | 775 | 12.235554% |
Noise dominated data is calculated using 1-second bins in cleaned event files. If a bin has >2000 counts, and if more than 50% of those come from <1% of pixels, then it is considered to be noise-dominated and hence unusable.
| Quadrant | # 1 sec bins | Bins with >0 counts | Bins with >2000 counts | High rate bins dominated by noise | Noise dominated (total time) | Noise dominated (detector-on time) | Marked lightcurve |
|---|---|---|---|---|---|---|---|
| A | 7549 | 6334 | 0 | 0 | 0.00% | 0.00% | 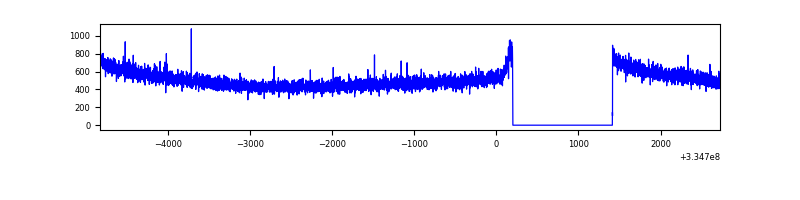 |
| B | 7549 | 6334 | 0 | 0 | 0.00% | 0.00% | 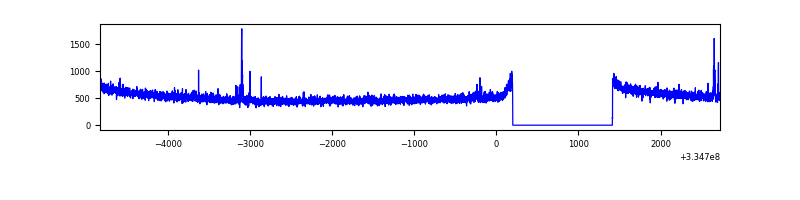 |
| C | 7549 | 6334 | 1 | 1 | 0.01% | 0.02% | 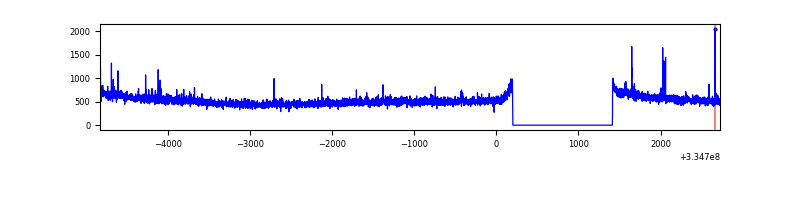 |
| D | 7549 | 6334 | 624 | 624 | 8.27% | 9.85% | 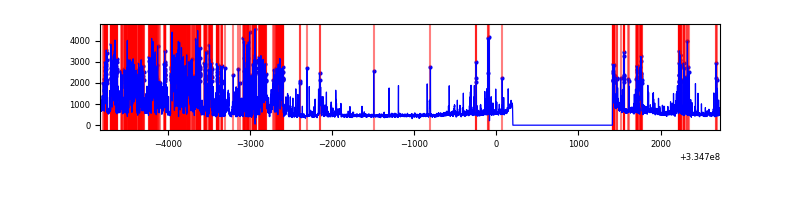 |
Top three noisy pixels from each quadrant. If the there are fewer than three noisy pixels in the level2.evt file, extra rows are filled as -1
| Pixel properties | Quadrant properties | ||||||
|---|---|---|---|---|---|---|---|
| Quadrant | DetID | PixID | Counts | Sigma | Mean | Median | Sigma |
| A | 13 | 254 | 10307 | 57.8 | 834 | 817 | 164.2 |
| A | 3 | 137 | 7357 | 39.83 | 834 | 817 | 164.2 |
| A | 0 | 226 | 7192 | 38.83 | 834 | 817 | 164.2 |
| B | 15 | 185 | 27718 | 174.42 | 833 | 815 | 154.2 |
| B | 0 | 230 | 19696 | 122.41 | 833 | 815 | 154.2 |
| B | 12 | 111 | 17821 | 110.25 | 833 | 815 | 154.2 |
| C | 14 | 238 | 130374 | 708.99 | 798 | 806 | 182.8 |
| C | 3 | 233 | 47714 | 256.68 | 798 | 806 | 182.8 |
| C | 2 | 16 | 34769 | 185.84 | 798 | 806 | 182.8 |
| D | 1 | 52 | 1982370 | 11004.1 | 764 | 744 | 180.1 |
| D | 13 | 168 | 727263 | 4034.41 | 764 | 744 | 180.1 |
| D | 11 | 176 | 113783 | 627.71 | 764 | 744 | 180.1 |
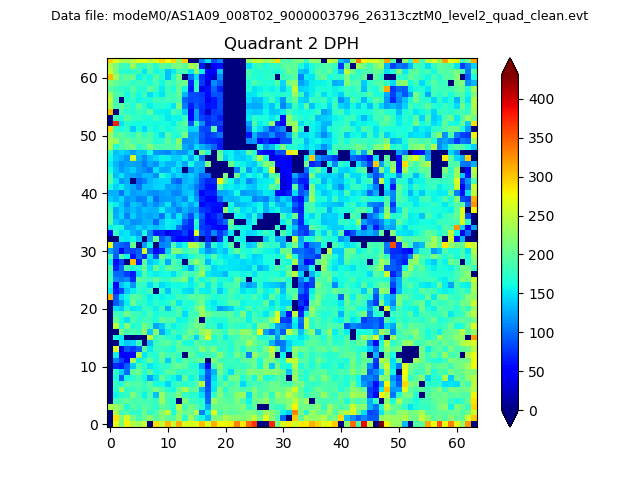
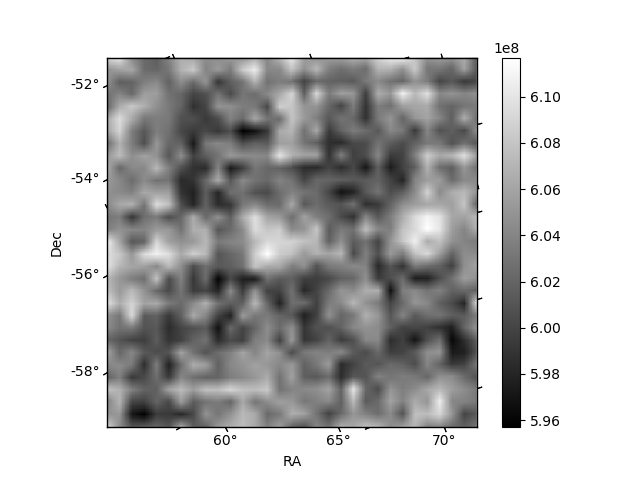
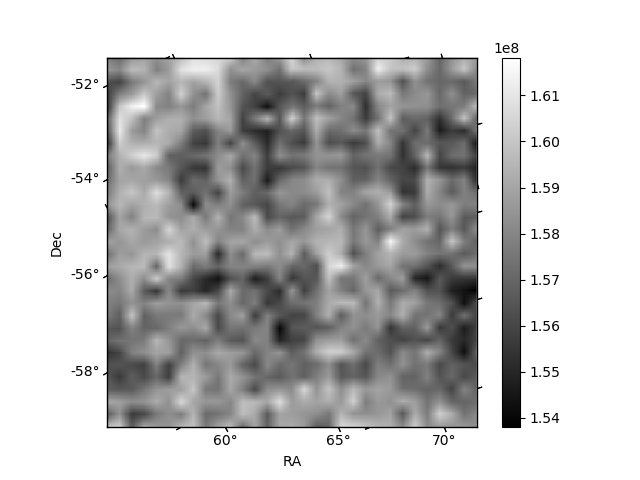
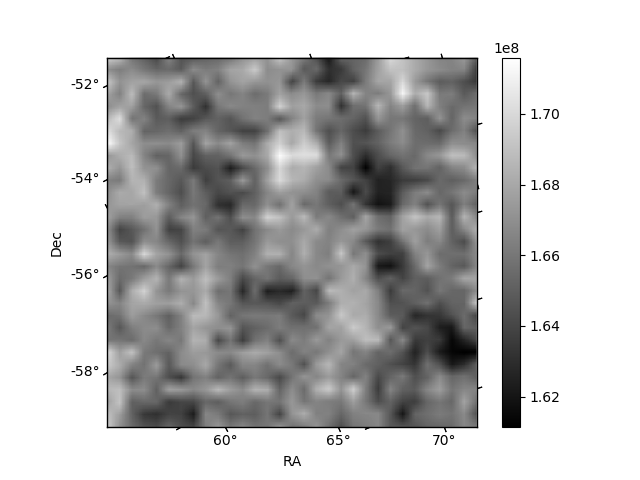
Histogram calculated using DETX and DETY for each event in the final _common_clean file
| Quadrant A | 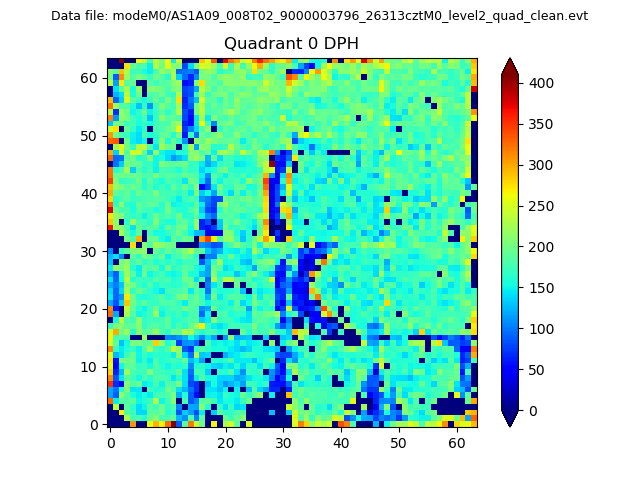 |
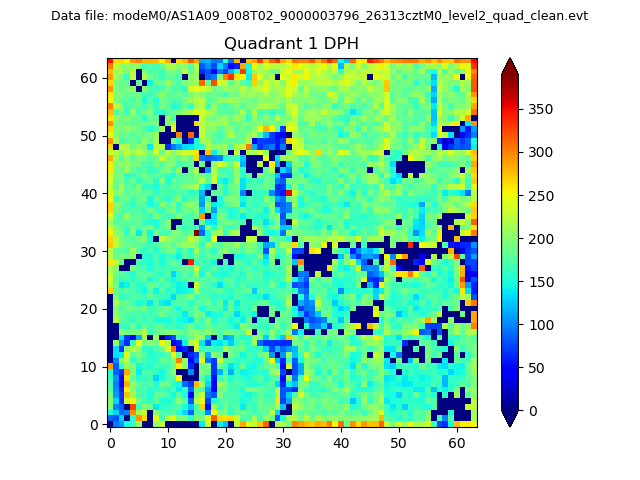 |
Quadrant B |
|---|---|---|---|
| Quadrant D | 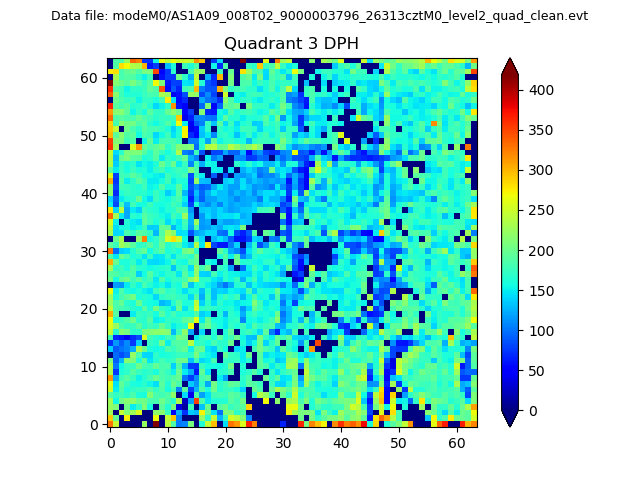 |
 |
Quadrant C |
| Plot type | Count rate plots | Images |
|---|---|---|
| Comparison with Poisson distribution Blue bars denote a histogram of data divided into 1 sec bins. Red curve is a Poisson curve with rate = median count rate of data. |
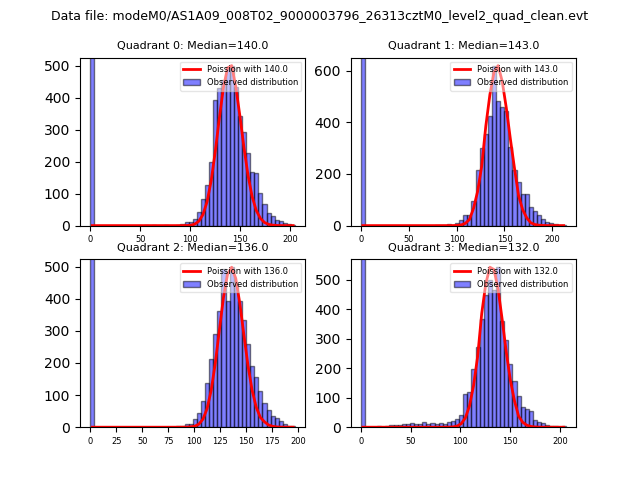 |
 |
| Quadrant-wise count rates Data is divided into 100 sec bins |
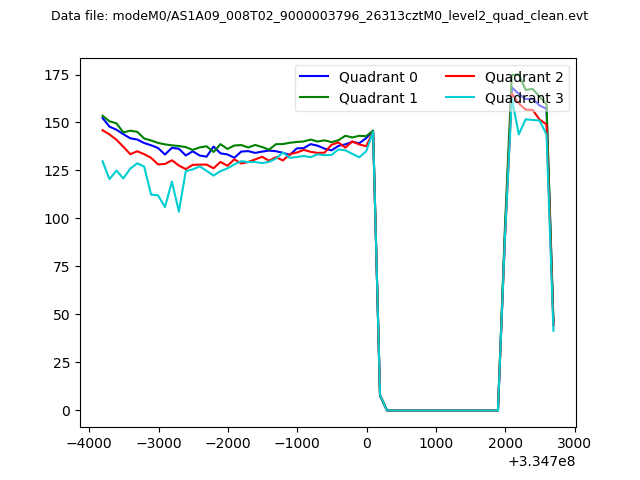 |
|
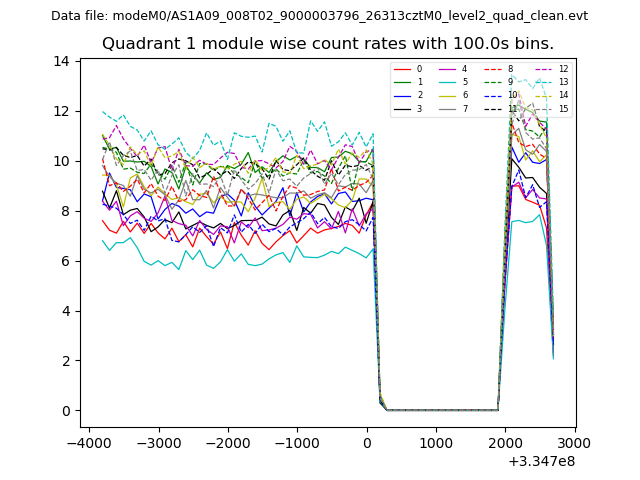
| Module-wise count rates for Quadrant A Data is divided into 100 sec bins |
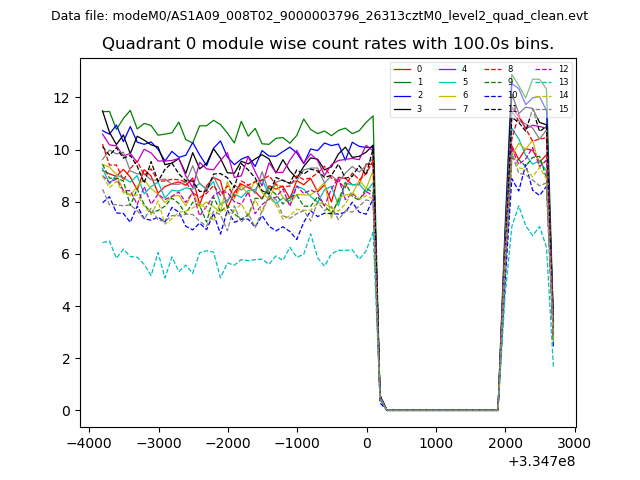 |
 |
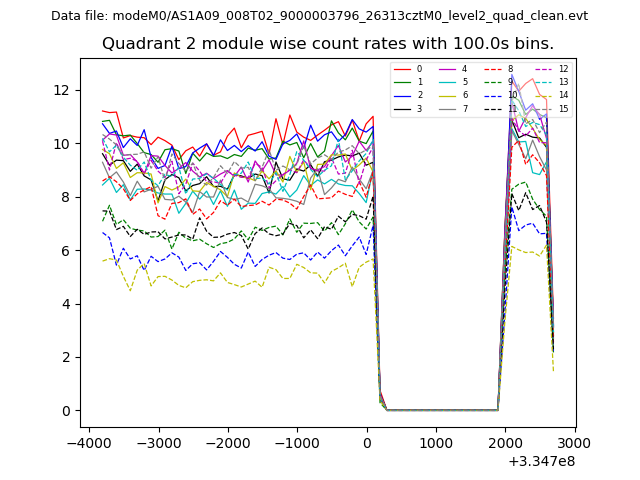
| Module-wise count rates for Quadrant B Data is divided into 100 sec bins |
 |
 |
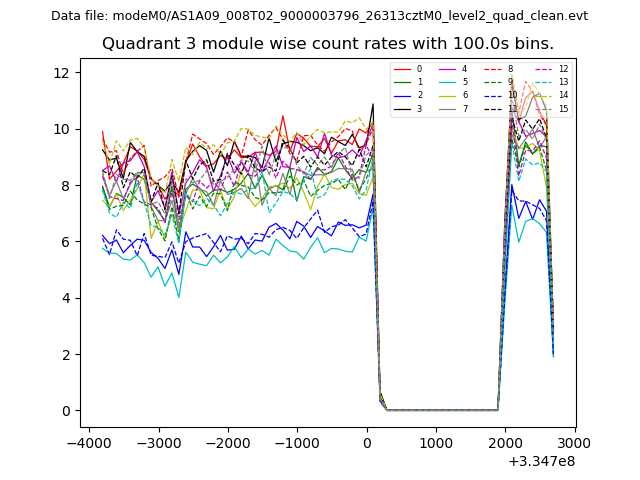
| Module-wise count rates for Quadrant C Data is divided into 100 sec bins |
 |
 |
| Module-wise count rates for Quadrant D Data is divided into 100 sec bins |
 |
 |
| Parameter | Plot |
|---|---|
| CZT HV Monitor | 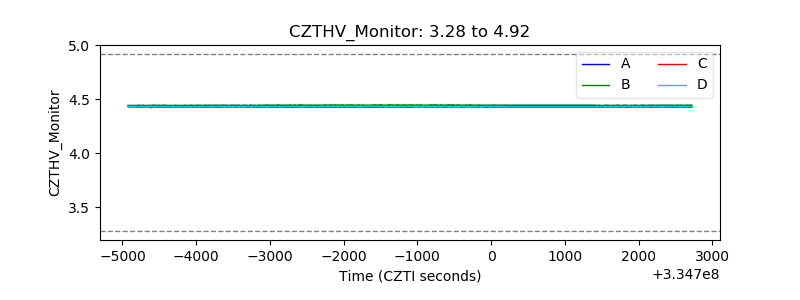 |
| D_VDD | 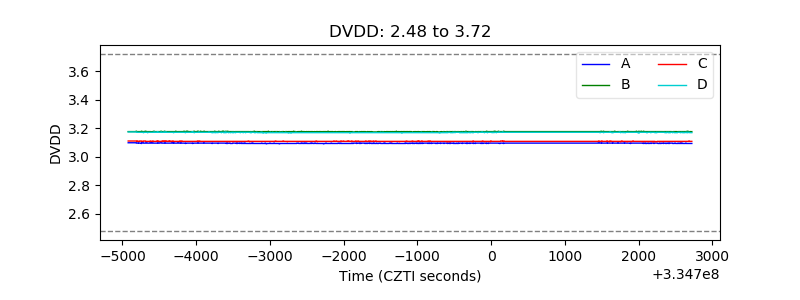 |
| Temperature 1 | 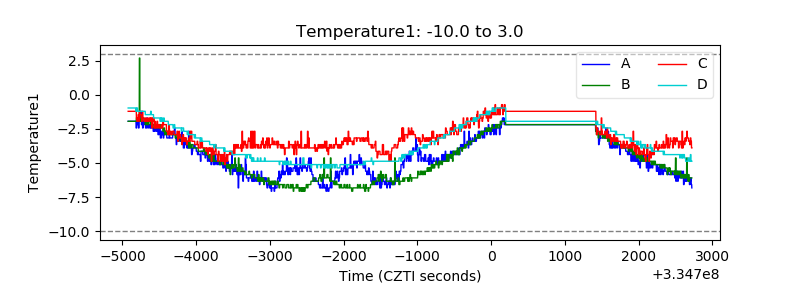 |
| Veto HV Monitor |  |
| Veto LLD | 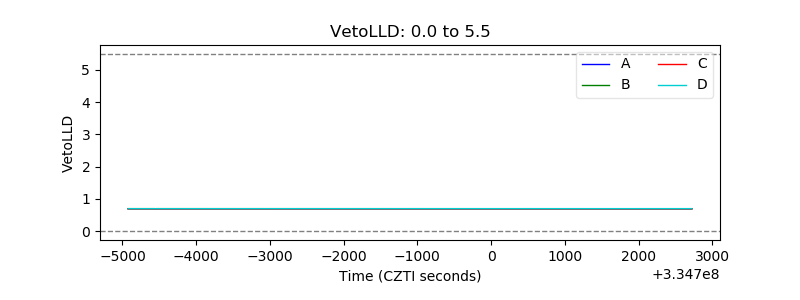 |
| Alpha Counter | 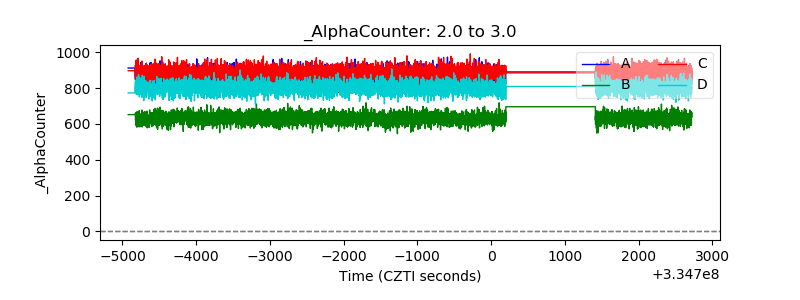 |
| _CPM_Rate | 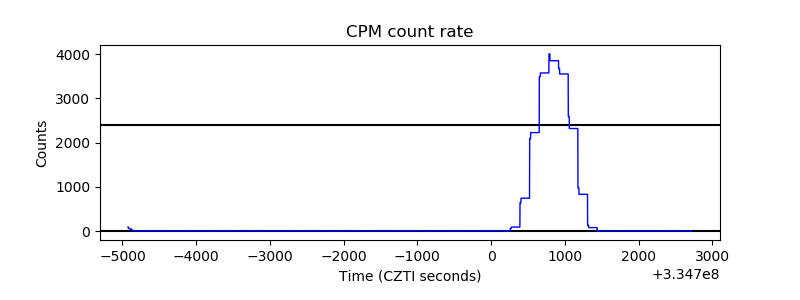 |
| CZT Counter | 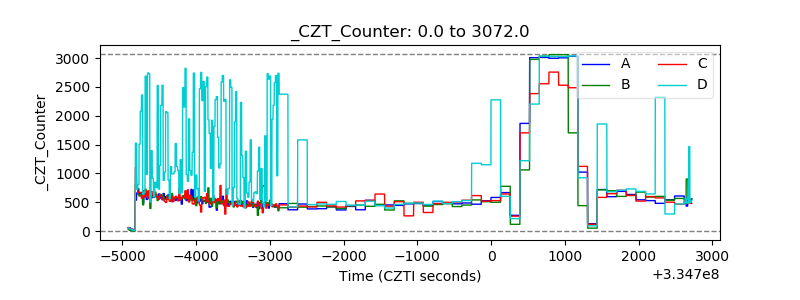 |
| +2.5 Volts monitor |  |
| +5 Volts monitor |  |
| _ROLL_ROT | 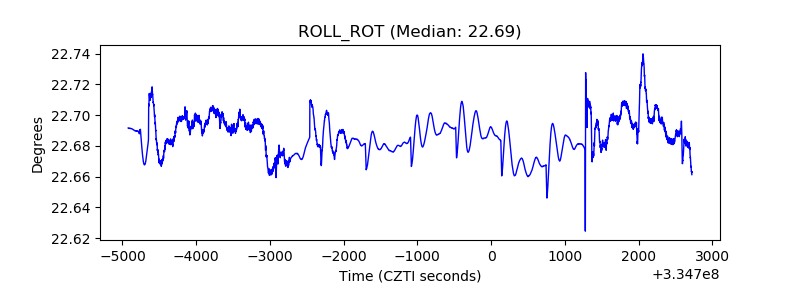 |
| _Roll_DEC | 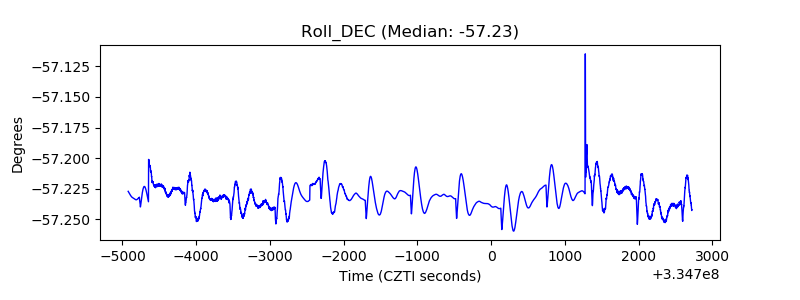 |
| _Roll_RA | 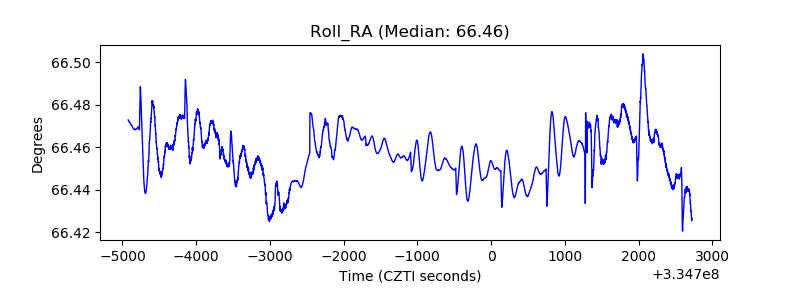 |
| Veto Counter | 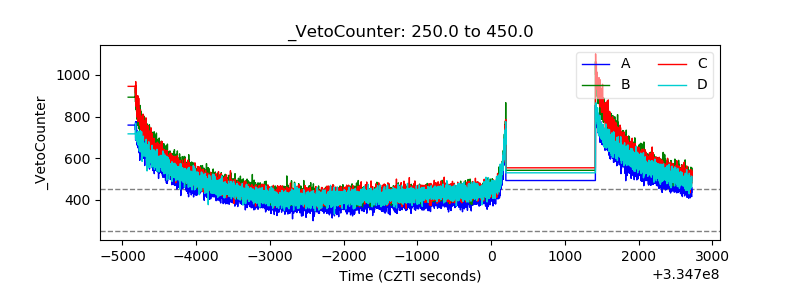 |