| Param | Original file | Final file |
|---|---|---|
| Filename | modeM0/AS1A09_008T02_9000003796_26314cztM0_level2.evt | modeM0/AS1A09_008T02_9000003796_26314cztM0_level2_quad_clean.evt |
| Size (bytes) | 474,304,320 | 119,180,160 |
| Size | 452.3 MB | 113.7 MB |
| Events in quadrant A | 3,205,310 | 802,943 |
| Events in quadrant B | 3,273,577 | 827,684 |
| Events in quadrant C | 3,301,027 | 785,543 |
| Events in quadrant D | 4,164,830 | 761,892 |
| Mode M0 | |||
|---|---|---|---|
| Quadrant | BADHDUFLAG | Total packets | Discarded packets |
| A | 0 | 13389 | 0 |
| B | 0 | 13577 | 0 |
| C | 0 | 13529 | 0 |
| D | 0 | 16347 | 0 |
| Mode M9 | |||
|---|---|---|---|
| Quadrant | BADHDUFLAG | Total packets | Discarded packets |
| A | 0 | 18 | 0 |
| B | 0 | 19 | 0 |
| C | 0 | 19 | 0 |
| D | 0 | 19 | 0 |
| Quadrant | Total seconds | Saturated seconds | Saturation percentage |
|---|---|---|---|
| A | 6181 | 34 | 0.550073% |
| B | 6181 | 48 | 0.776573% |
| C | 6181 | 49 | 0.792752% |
| D | 6181 | 233 | 3.769617% |
Noise dominated data is calculated using 1-second bins in cleaned event files. If a bin has >2000 counts, and if more than 50% of those come from <1% of pixels, then it is considered to be noise-dominated and hence unusable.
| Quadrant | # 1 sec bins | Bins with >0 counts | Bins with >2000 counts | High rate bins dominated by noise | Noise dominated (total time) | Noise dominated (detector-on time) | Marked lightcurve |
|---|---|---|---|---|---|---|---|
| A | 7501 | 6182 | 0 | 0 | 0.00% | 0.00% | 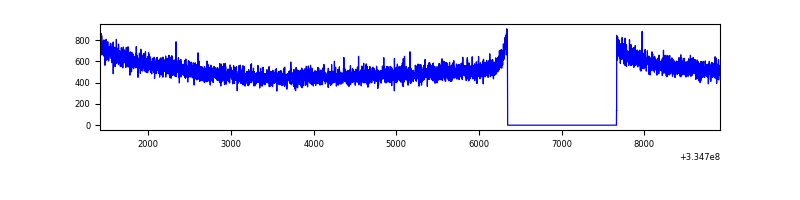 |
| B | 7501 | 6182 | 0 | 0 | 0.00% | 0.00% | 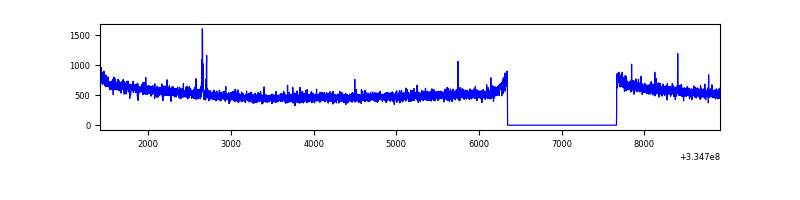 |
| C | 7501 | 6182 | 1 | 1 | 0.01% | 0.02% | 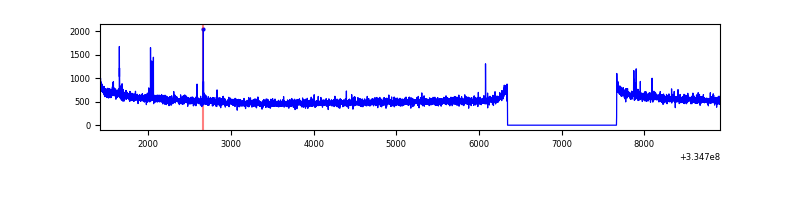 |
| D | 7501 | 6182 | 157 | 157 | 2.09% | 2.54% | 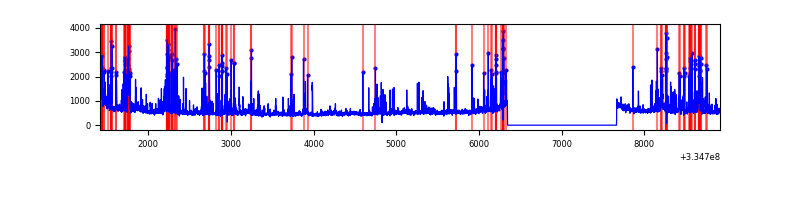 |
Top three noisy pixels from each quadrant. If the there are fewer than three noisy pixels in the level2.evt file, extra rows are filled as -1
| Pixel properties | Quadrant properties | ||||||
|---|---|---|---|---|---|---|---|
| Quadrant | DetID | PixID | Counts | Sigma | Mean | Median | Sigma |
| A | 13 | 254 | 10194 | 56.99 | 831 | 817 | 164.5 |
| A | 0 | 226 | 7262 | 39.17 | 831 | 817 | 164.5 |
| A | 3 | 137 | 7181 | 38.68 | 831 | 817 | 164.5 |
| B | 12 | 111 | 17743 | 111.02 | 832 | 814 | 152.5 |
| B | 15 | 185 | 16618 | 103.64 | 832 | 814 | 152.5 |
| B | 11 | 111 | 15880 | 98.8 | 832 | 814 | 152.5 |
| C | 14 | 238 | 131322 | 707.79 | 803 | 809 | 184.4 |
| C | 2 | 16 | 27427 | 144.35 | 803 | 809 | 184.4 |
| C | 3 | 233 | 12645 | 64.19 | 803 | 809 | 184.4 |
| D | 1 | 52 | 973993 | 5212.41 | 794 | 777 | 186.7 |
| D | 11 | 176 | 108828 | 578.71 | 794 | 777 | 186.7 |
| D | 12 | 233 | 61240 | 323.83 | 794 | 777 | 186.7 |
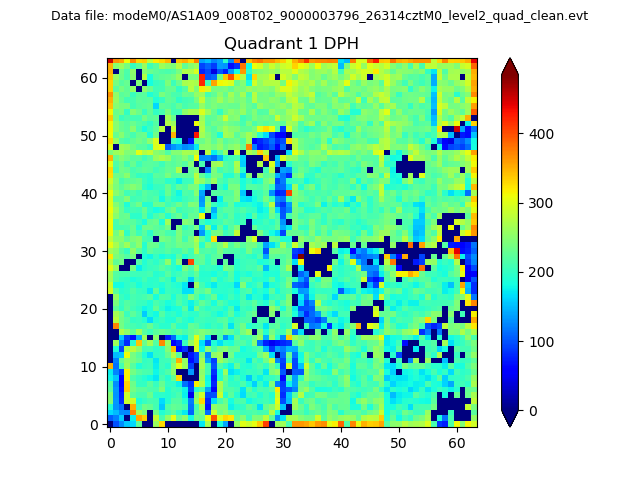
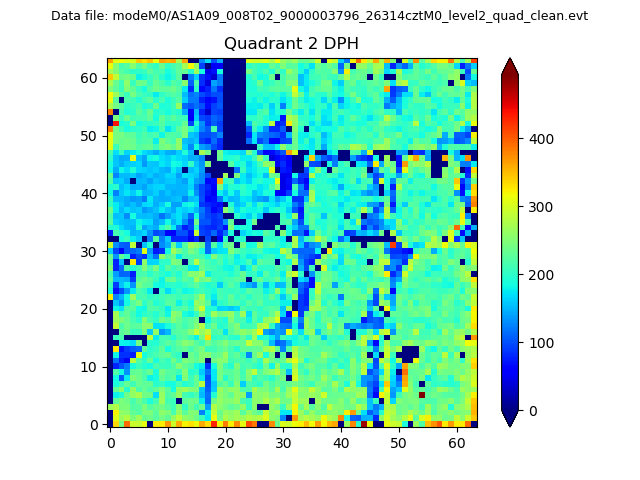
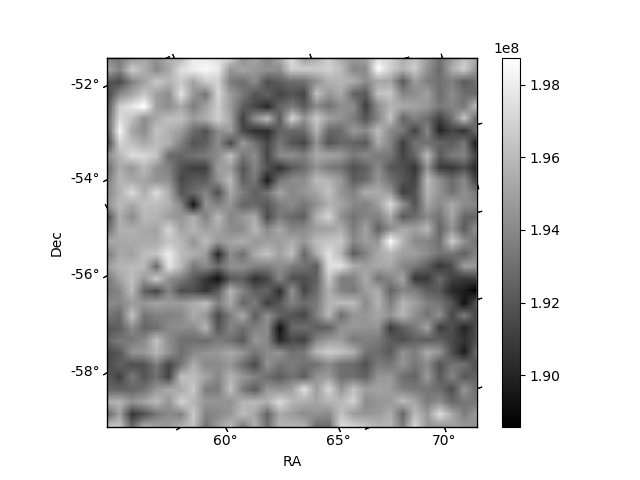
Histogram calculated using DETX and DETY for each event in the final _common_clean file
| Quadrant A |  |
 |
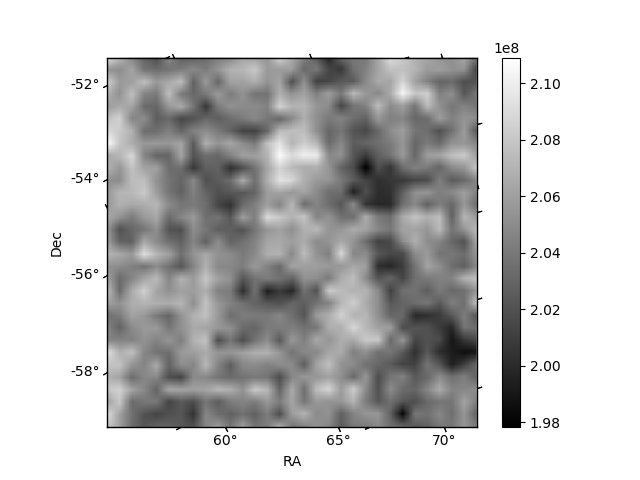
Quadrant B |
|---|---|---|---|
| Quadrant D |  |
 |
Quadrant C |
| Plot type | Count rate plots | Images |
|---|---|---|
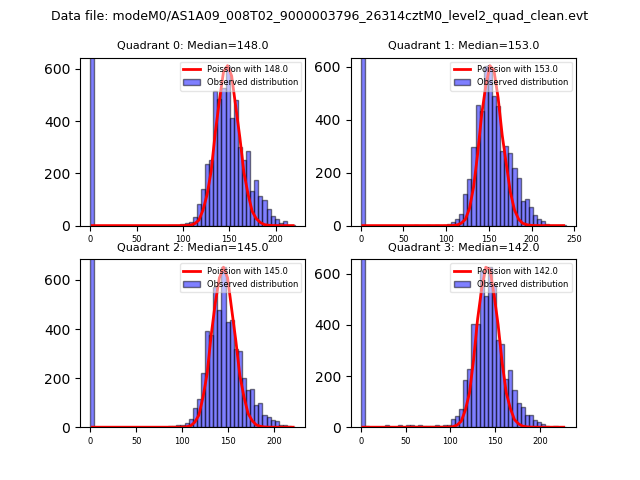
| Comparison with Poisson distribution Blue bars denote a histogram of data divided into 1 sec bins. Red curve is a Poisson curve with rate = median count rate of data. |
 |
 |
| Quadrant-wise count rates Data is divided into 100 sec bins |
 |
|
| Module-wise count rates for Quadrant A Data is divided into 100 sec bins |
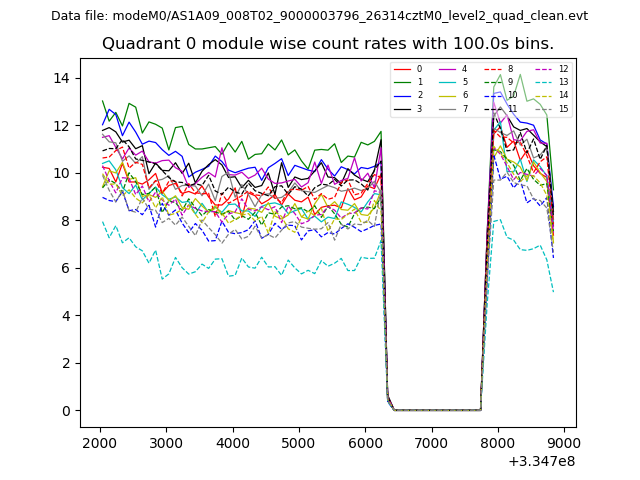 |
 |
| Module-wise count rates for Quadrant B Data is divided into 100 sec bins |
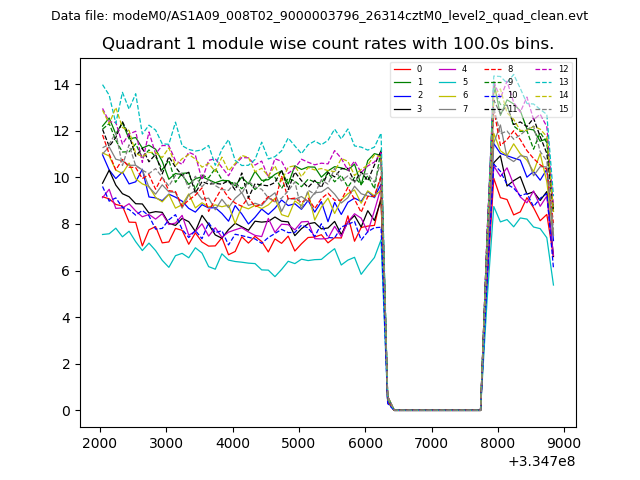 |
 |
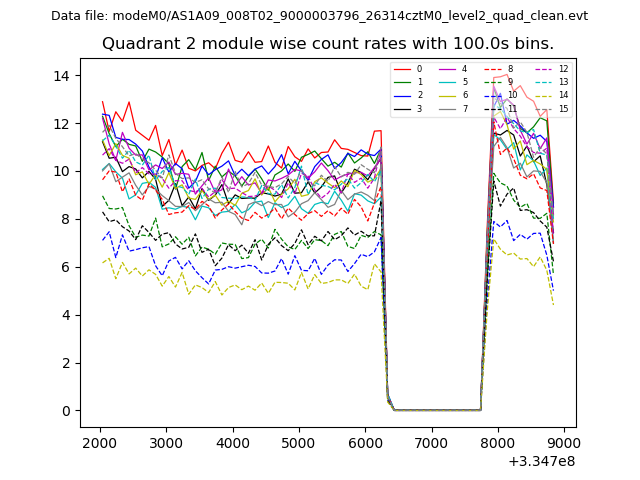
| Module-wise count rates for Quadrant C Data is divided into 100 sec bins |
 |
 |
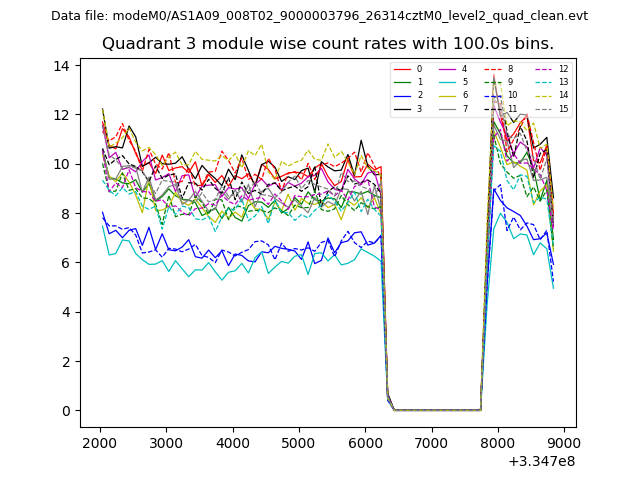
| Module-wise count rates for Quadrant D Data is divided into 100 sec bins |
 |
 |
| Parameter | Plot |
|---|---|
| CZT HV Monitor | 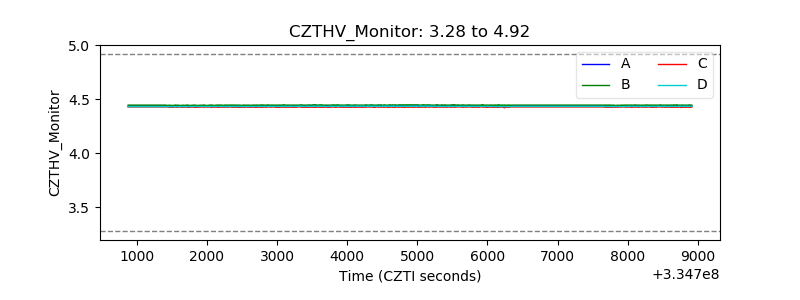 |
| D_VDD | 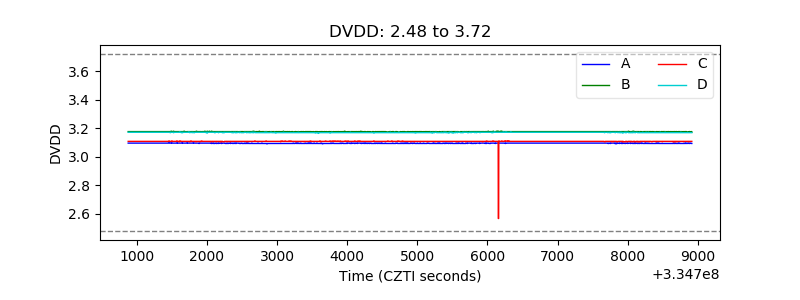 |
| Temperature 1 | 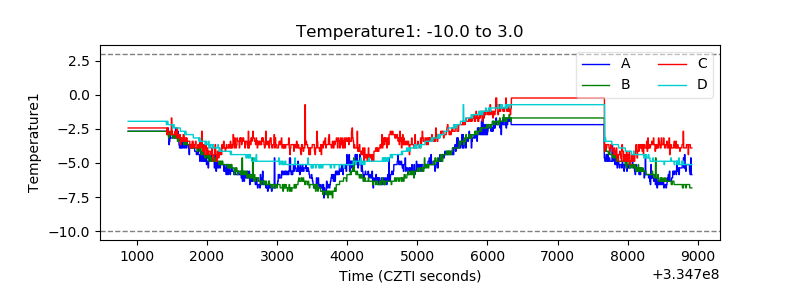 |
| Veto HV Monitor | 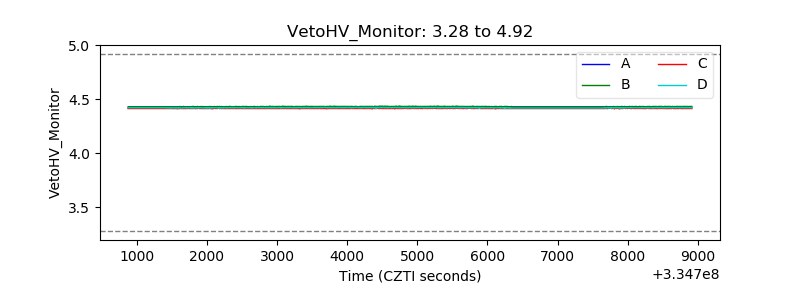 |
| Veto LLD | 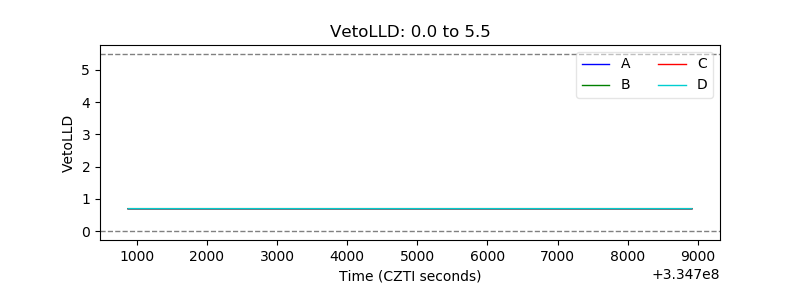 |
| Alpha Counter | 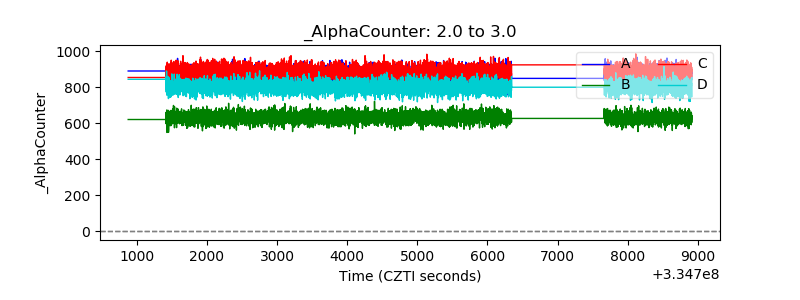 |
| _CPM_Rate | 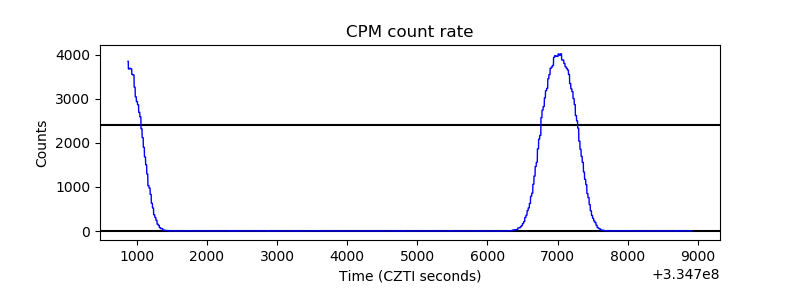 |
| CZT Counter |  |
| +2.5 Volts monitor |  |
| +5 Volts monitor |  |
| _ROLL_ROT | 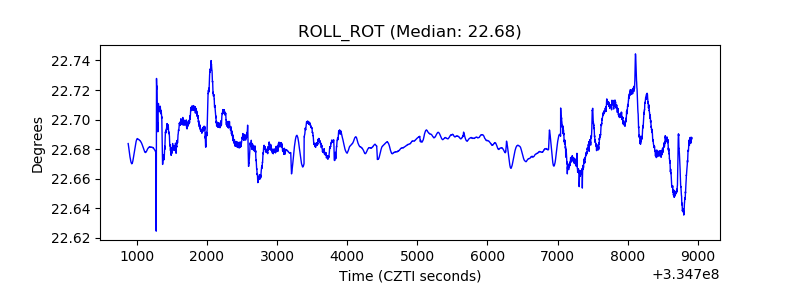 |
| _Roll_DEC | 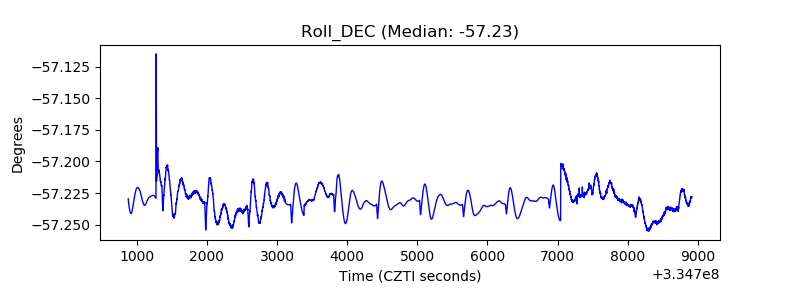 |
| _Roll_RA | 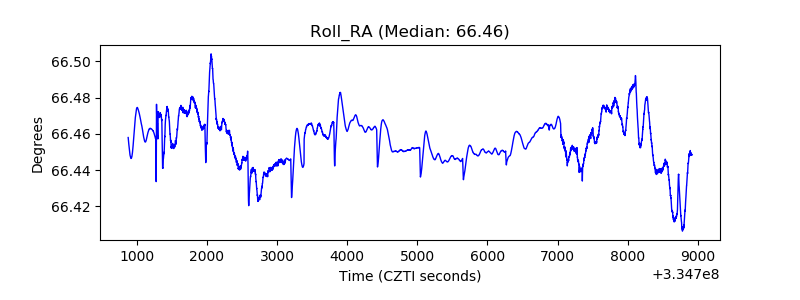 |
| Veto Counter | 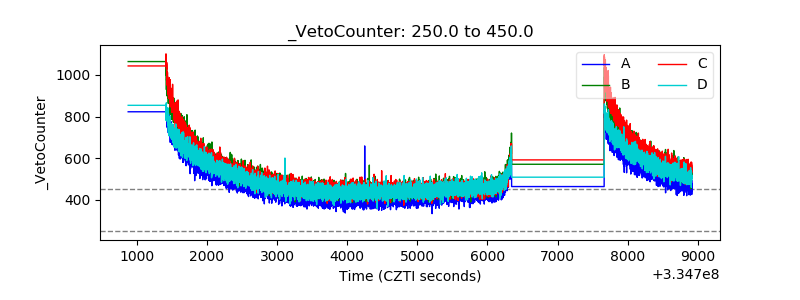 |