| Param | Original file | Final file |
|---|---|---|
| Filename | modeM0/AS1A09_008T02_9000003796_26315cztM0_level2.evt | modeM0/AS1A09_008T02_9000003796_26315cztM0_level2_quad_clean.evt |
| Size (bytes) | 477,201,600 | 128,658,240 |
| Size | 455.1 MB | 122.7 MB |
| Events in quadrant A | 3,142,008 | 875,397 |
| Events in quadrant B | 3,203,942 | 903,337 |
| Events in quadrant C | 3,307,146 | 865,355 |
| Events in quadrant D | 4,383,974 | 825,977 |
| Mode M0 | |||
|---|---|---|---|
| Quadrant | BADHDUFLAG | Total packets | Discarded packets |
| A | 0 | 13053 | 0 |
| B | 0 | 13235 | 0 |
| C | 0 | 13429 | 0 |
| D | 0 | 16859 | 0 |
| Mode M9 | |||
|---|---|---|---|
| Quadrant | BADHDUFLAG | Total packets | Discarded packets |
| A | 0 | 23 | 0 |
| B | 0 | 24 | 0 |
| C | 0 | 24 | 0 |
| D | 0 | 24 | 0 |
| Quadrant | Total seconds | Saturated seconds | Saturation percentage |
|---|---|---|---|
| A | 6115 | 33 | 0.539657% |
| B | 6115 | 51 | 0.834015% |
| C | 6115 | 89 | 1.455437% |
| D | 6115 | 378 | 6.181521% |
Noise dominated data is calculated using 1-second bins in cleaned event files. If a bin has >2000 counts, and if more than 50% of those come from <1% of pixels, then it is considered to be noise-dominated and hence unusable.
| Quadrant | # 1 sec bins | Bins with >0 counts | Bins with >2000 counts | High rate bins dominated by noise | Noise dominated (total time) | Noise dominated (detector-on time) | Marked lightcurve |
|---|---|---|---|---|---|---|---|
| A | 7470 | 6116 | 0 | 0 | 0.00% | 0.00% | 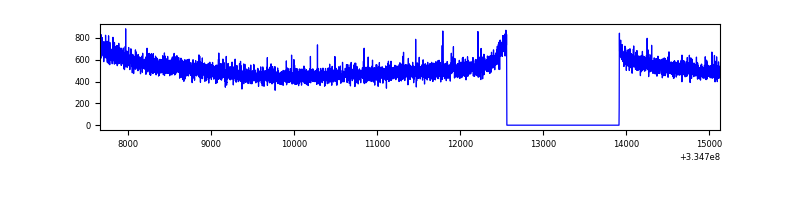 |
| B | 7470 | 6116 | 0 | 0 | 0.00% | 0.00% | 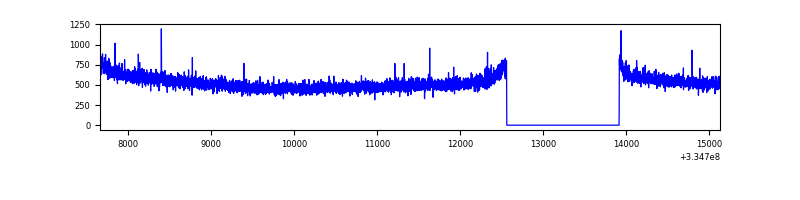 |
| C | 7470 | 6116 | 0 | 0 | 0.00% | 0.00% | 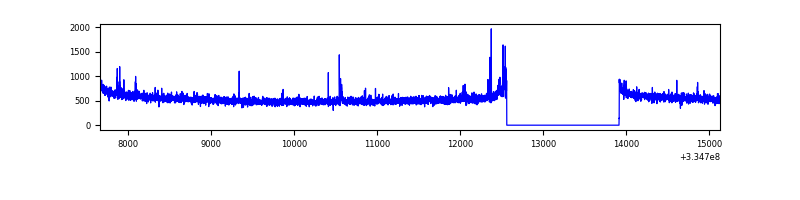 |
| D | 7470 | 6116 | 265 | 265 | 3.55% | 4.33% | 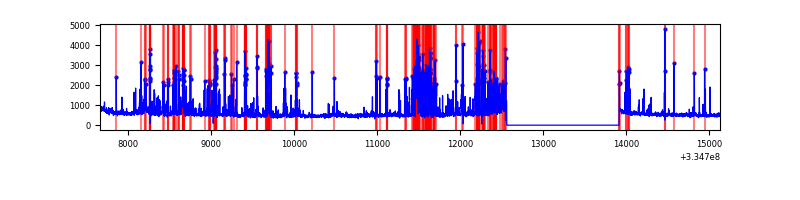 |
Top three noisy pixels from each quadrant. If the there are fewer than three noisy pixels in the level2.evt file, extra rows are filled as -1
| Pixel properties | Quadrant properties | ||||||
|---|---|---|---|---|---|---|---|
| Quadrant | DetID | PixID | Counts | Sigma | Mean | Median | Sigma |
| A | 13 | 254 | 10005 | 57.57 | 815 | 800 | 159.9 |
| A | 3 | 137 | 6919 | 38.27 | 815 | 800 | 159.9 |
| A | 0 | 226 | 6897 | 38.13 | 815 | 800 | 159.9 |
| B | 12 | 111 | 17481 | 111.42 | 818 | 799 | 149.7 |
| B | 11 | 111 | 15802 | 100.2 | 818 | 799 | 149.7 |
| B | 14 | 111 | 14174 | 89.33 | 818 | 799 | 149.7 |
| C | 14 | 238 | 131538 | 712.42 | 800 | 807 | 183.5 |
| C | 3 | 233 | 42366 | 226.48 | 800 | 807 | 183.5 |
| C | 2 | 16 | 16768 | 86.98 | 800 | 807 | 183.5 |
| D | 1 | 52 | 1136076 | 6135.2 | 782 | 763 | 185.0 |
| D | 11 | 176 | 247985 | 1335.98 | 782 | 763 | 185.0 |
| D | 2 | 234 | 25985 | 136.3 | 782 | 763 | 185.0 |
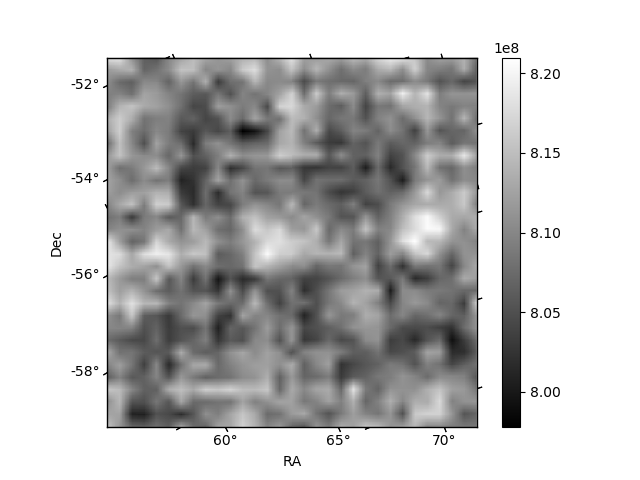
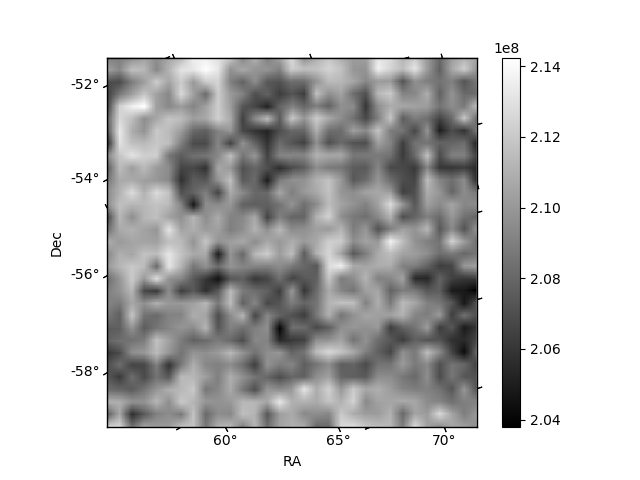
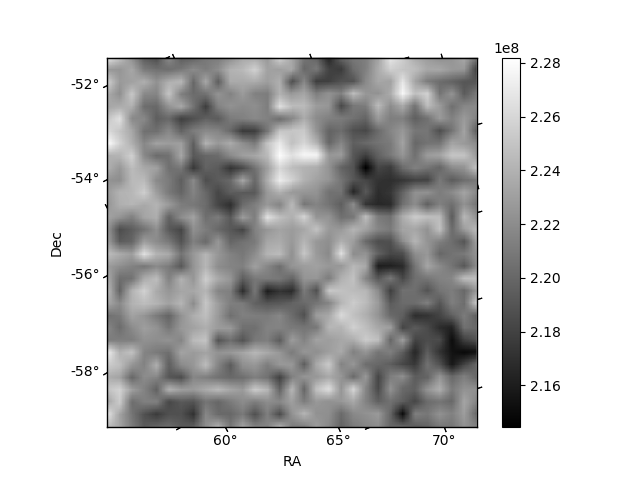
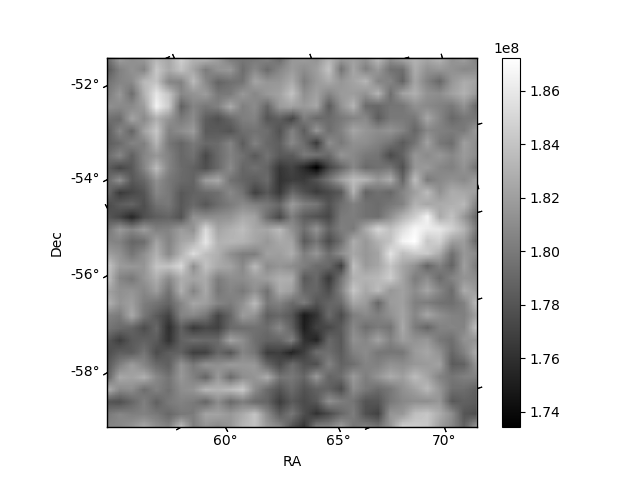
Histogram calculated using DETX and DETY for each event in the final _common_clean file
| Quadrant A | 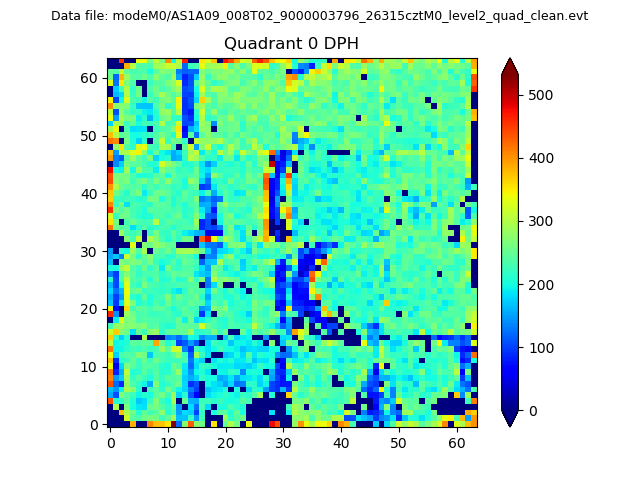 |
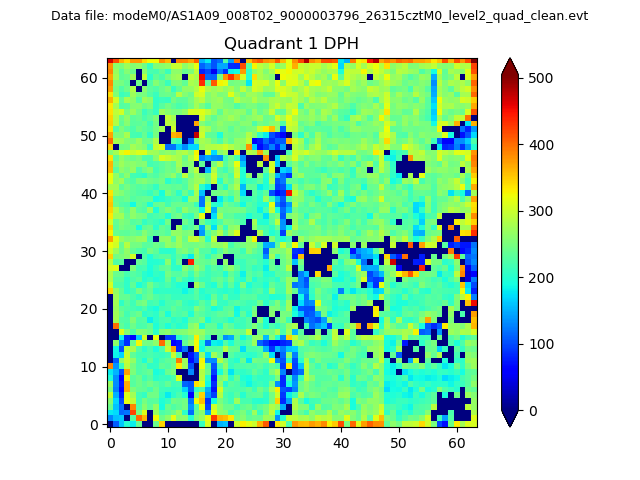 |
Quadrant B |
|---|---|---|---|
| Quadrant D |  |
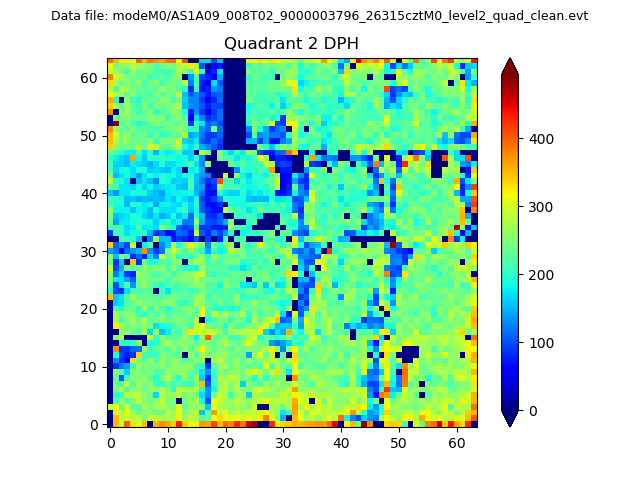 |
Quadrant C |
| Plot type | Count rate plots | Images |
|---|---|---|
| Comparison with Poisson distribution Blue bars denote a histogram of data divided into 1 sec bins. Red curve is a Poisson curve with rate = median count rate of data. |
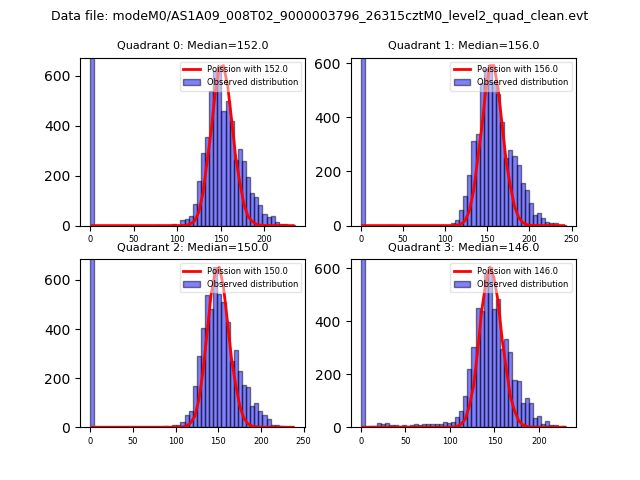 |
 |
| Quadrant-wise count rates Data is divided into 100 sec bins |
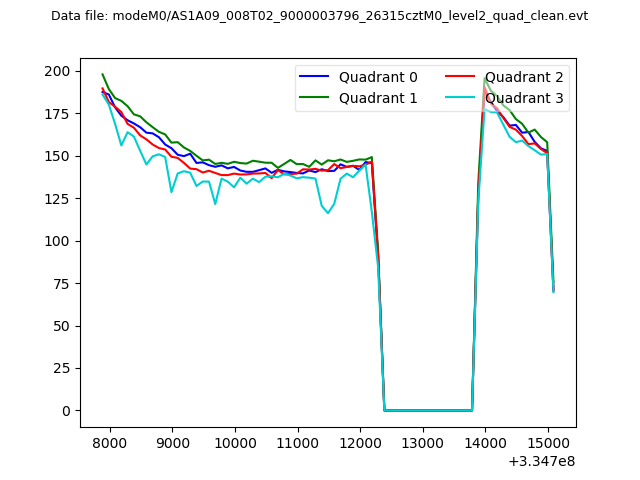 |
|
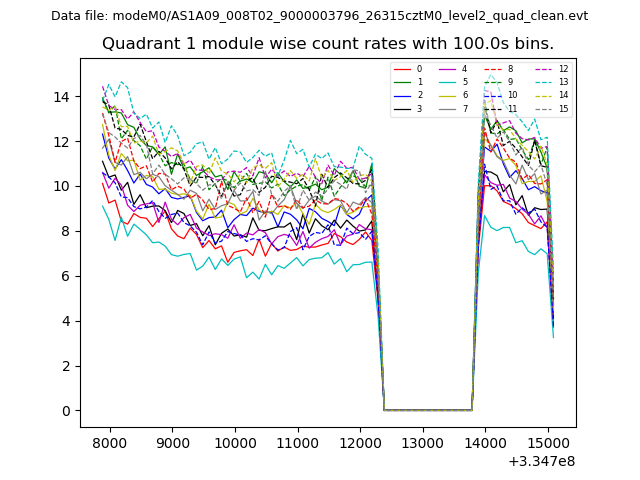
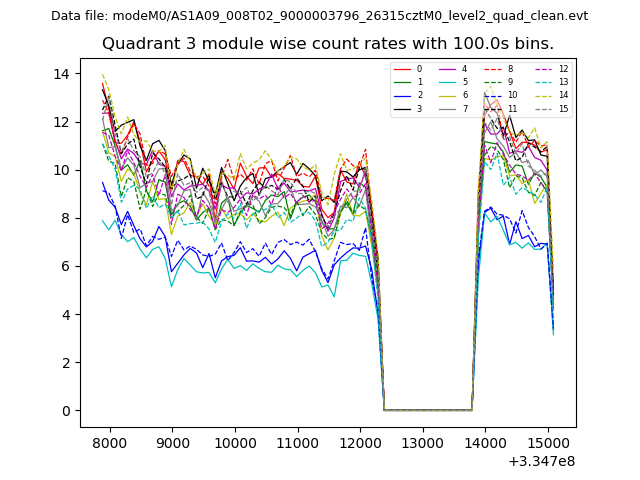
| Module-wise count rates for Quadrant A Data is divided into 100 sec bins |
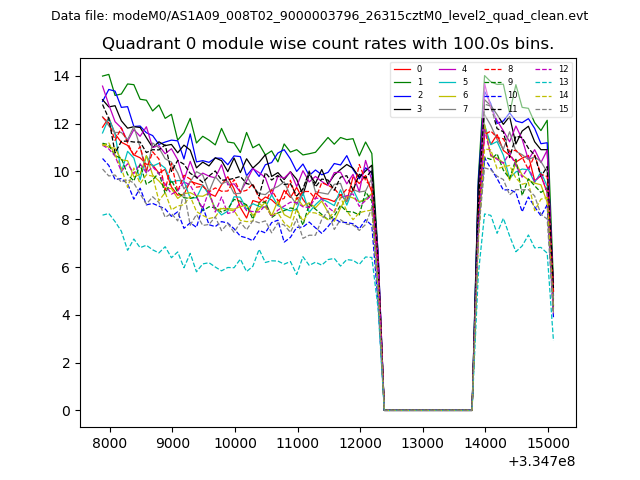 |
 |
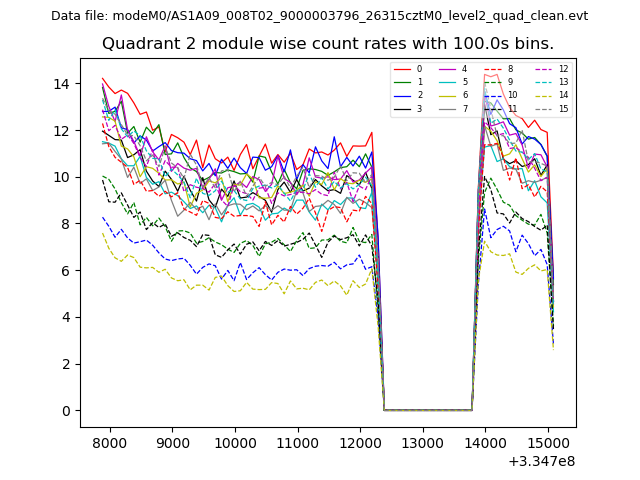
| Module-wise count rates for Quadrant B Data is divided into 100 sec bins |
 |
 |
| Module-wise count rates for Quadrant C Data is divided into 100 sec bins |
 |
 |
| Module-wise count rates for Quadrant D Data is divided into 100 sec bins |
 |
 |
| Parameter | Plot |
|---|---|
| CZT HV Monitor | 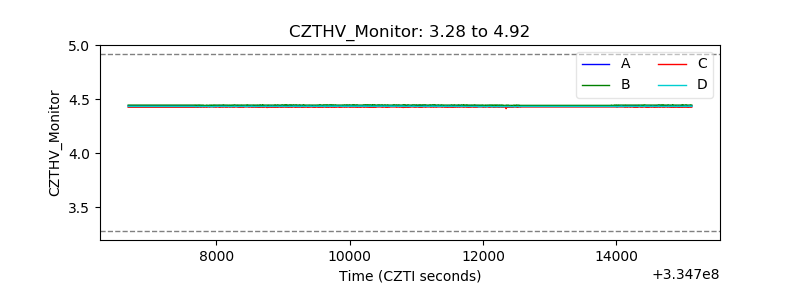 |
| D_VDD | 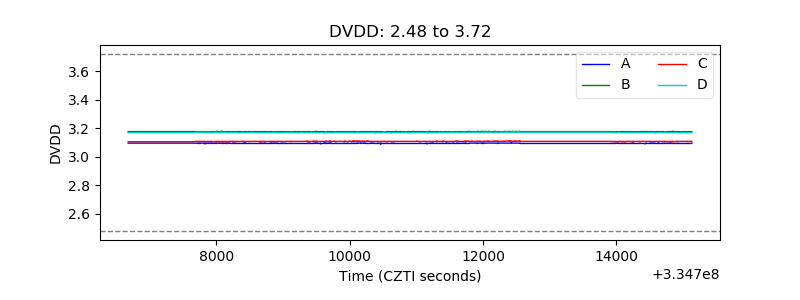 |
| Temperature 1 | 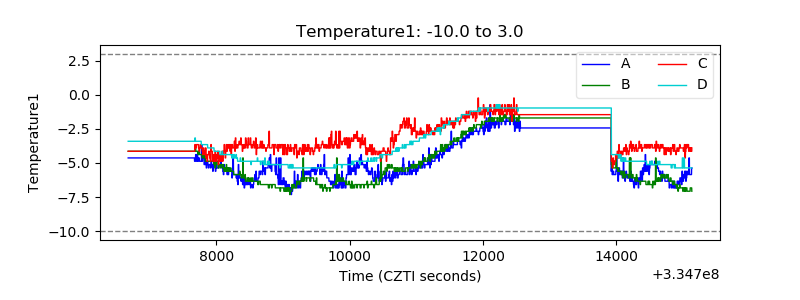 |
| Veto HV Monitor |  |
| Veto LLD | 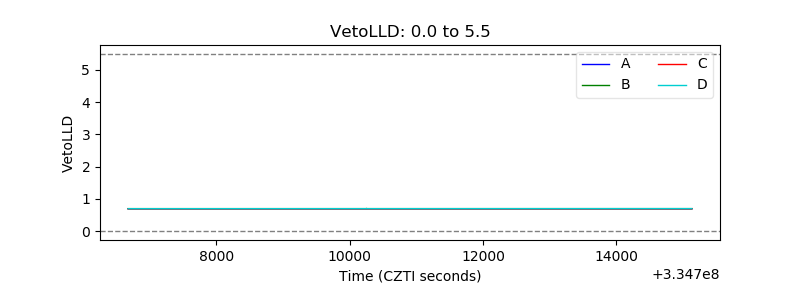 |
| Alpha Counter | 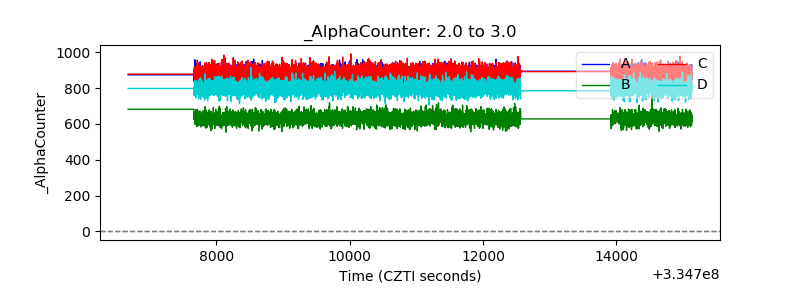 |
| _CPM_Rate | 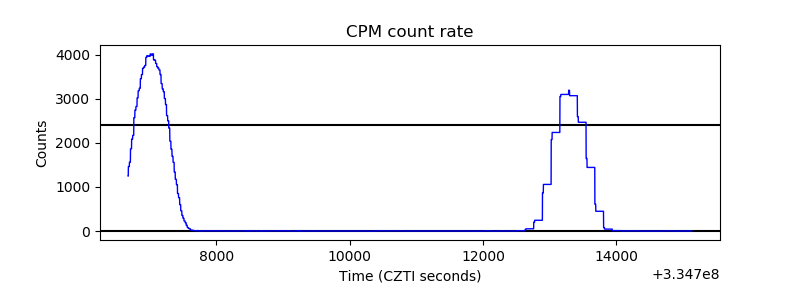 |
| CZT Counter | 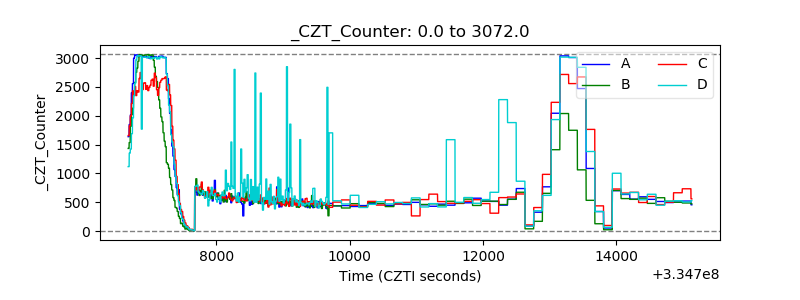 |
| +2.5 Volts monitor | 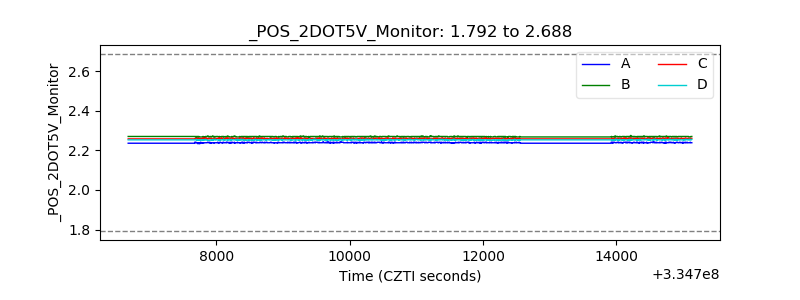 |
| +5 Volts monitor |  |
| _ROLL_ROT | 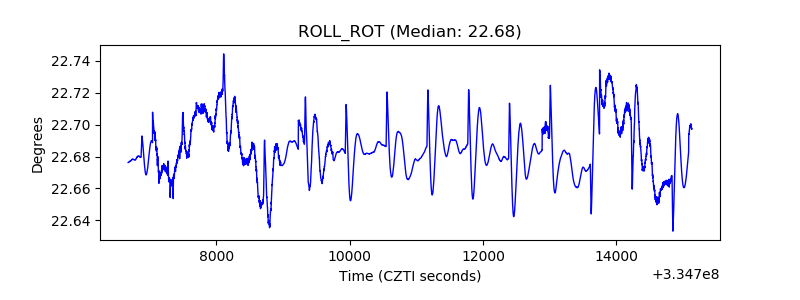 |
| _Roll_DEC | 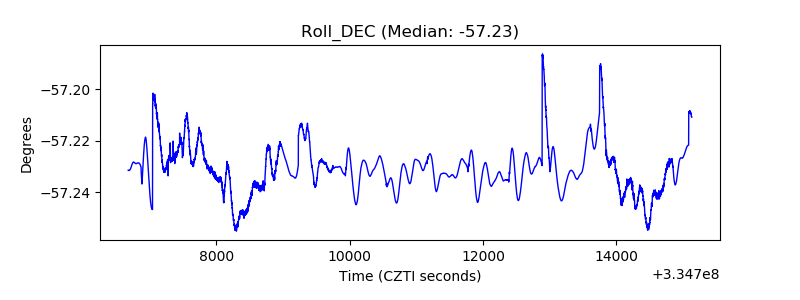 |
| _Roll_RA | 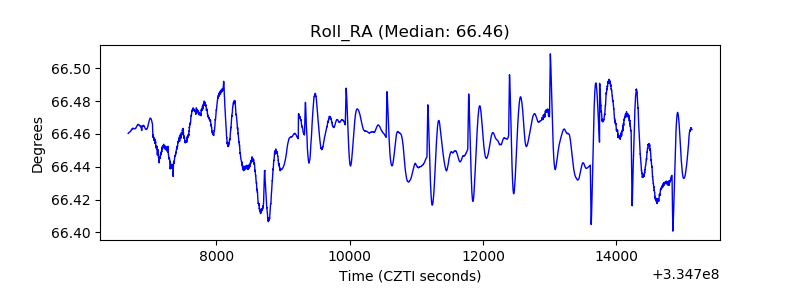 |
| Veto Counter | 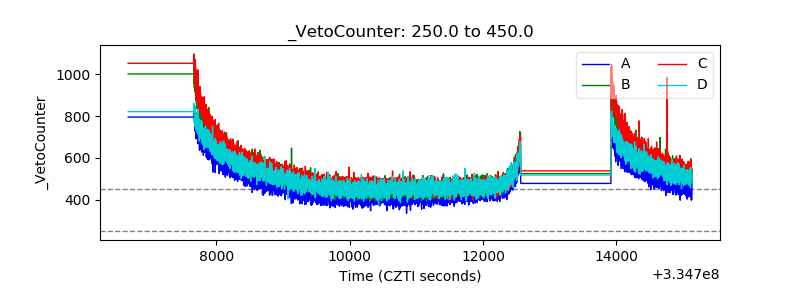 |