| Param | Original file | Final file |
|---|---|---|
| Filename | modeM0/AS1A09_008T02_9000003796_26316cztM0_level2.evt | modeM0/AS1A09_008T02_9000003796_26316cztM0_level2_quad_clean.evt |
| Size (bytes) | 452,073,600 | 125,363,520 |
| Size | 431.1 MB | 119.6 MB |
| Events in quadrant A | 3,115,413 | 840,766 |
| Events in quadrant B | 3,193,983 | 865,568 |
| Events in quadrant C | 3,311,362 | 838,581 |
| Events in quadrant D | 3,644,465 | 814,786 |
| Mode M0 | |||
|---|---|---|---|
| Quadrant | BADHDUFLAG | Total packets | Discarded packets |
| A | 0 | 13028 | 0 |
| B | 0 | 13258 | 0 |
| C | 0 | 13461 | 0 |
| D | 0 | 14739 | 0 |
| Mode M9 | |||
|---|---|---|---|
| Quadrant | BADHDUFLAG | Total packets | Discarded packets |
| A | 0 | 17 | 0 |
| B | 0 | 18 | 0 |
| C | 0 | 18 | 0 |
| D | 0 | 18 | 0 |
| Quadrant | Total seconds | Saturated seconds | Saturation percentage |
|---|---|---|---|
| A | 6266 | 29 | 0.462815% |
| B | 6266 | 48 | 0.766039% |
| C | 6266 | 89 | 1.420364% |
| D | 6266 | 149 | 2.377913% |
Noise dominated data is calculated using 1-second bins in cleaned event files. If a bin has >2000 counts, and if more than 50% of those come from <1% of pixels, then it is considered to be noise-dominated and hence unusable.
| Quadrant | # 1 sec bins | Bins with >0 counts | Bins with >2000 counts | High rate bins dominated by noise | Noise dominated (total time) | Noise dominated (detector-on time) | Marked lightcurve |
|---|---|---|---|---|---|---|---|
| A | 7606 | 6267 | 0 | 0 | 0.00% | 0.00% | 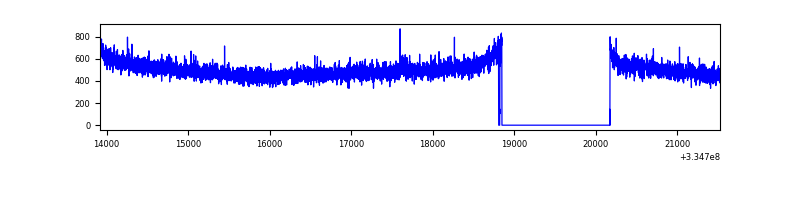 |
| B | 7606 | 6268 | 0 | 0 | 0.00% | 0.00% | 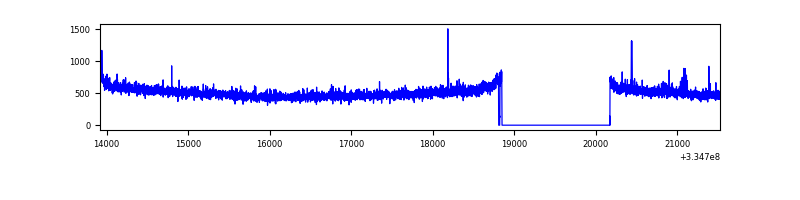 |
| C | 7606 | 6267 | 0 | 0 | 0.00% | 0.00% | 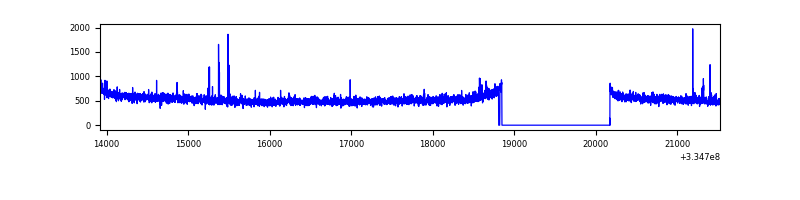 |
| D | 7606 | 6268 | 92 | 92 | 1.21% | 1.47% | 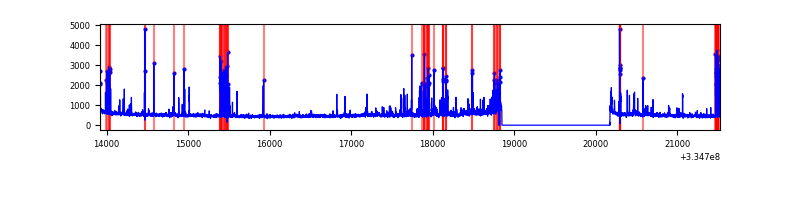 |
Top three noisy pixels from each quadrant. If the there are fewer than three noisy pixels in the level2.evt file, extra rows are filled as -1
| Pixel properties | Quadrant properties | ||||||
|---|---|---|---|---|---|---|---|
| Quadrant | DetID | PixID | Counts | Sigma | Mean | Median | Sigma |
| A | 13 | 254 | 9911 | 57.77 | 804 | 789 | 157.9 |
| A | 3 | 137 | 7022 | 39.47 | 804 | 789 | 157.9 |
| A | 0 | 226 | 6762 | 37.83 | 804 | 789 | 157.9 |
| B | 12 | 111 | 17387 | 111.02 | 811 | 791 | 149.5 |
| B | 11 | 111 | 15744 | 100.03 | 811 | 791 | 149.5 |
| B | 14 | 111 | 14360 | 90.77 | 811 | 791 | 149.5 |
| C | 14 | 238 | 129920 | 704.06 | 798 | 805 | 183.4 |
| C | 3 | 233 | 44492 | 238.22 | 798 | 805 | 183.4 |
| C | 2 | 16 | 26464 | 139.92 | 798 | 805 | 183.4 |
| D | 1 | 52 | 466243 | 2499.96 | 792 | 775 | 186.2 |
| D | 11 | 176 | 91750 | 488.61 | 792 | 775 | 186.2 |
| D | 12 | 233 | 38344 | 201.78 | 792 | 775 | 186.2 |
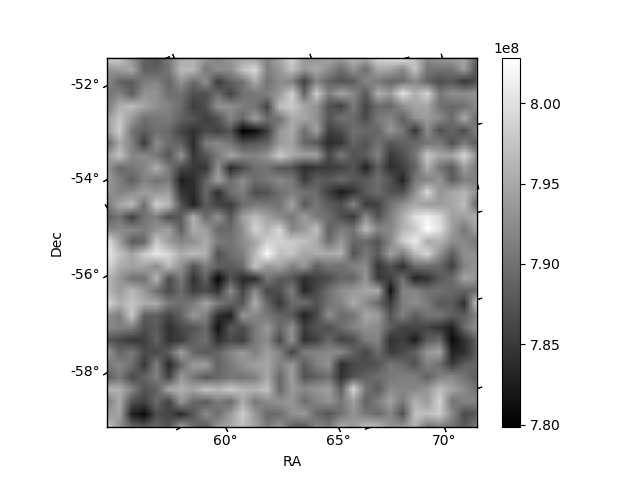
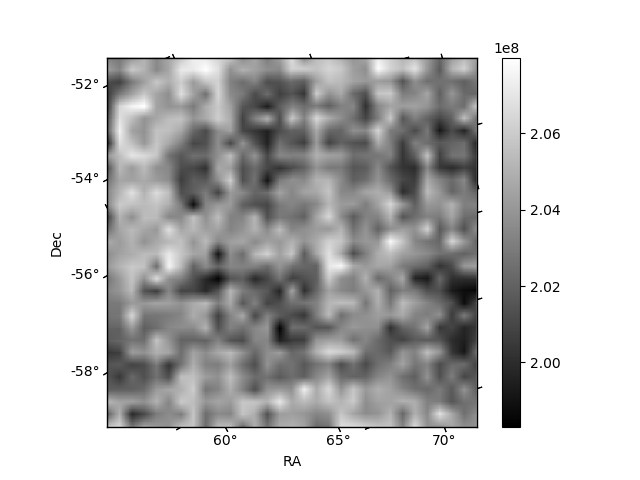
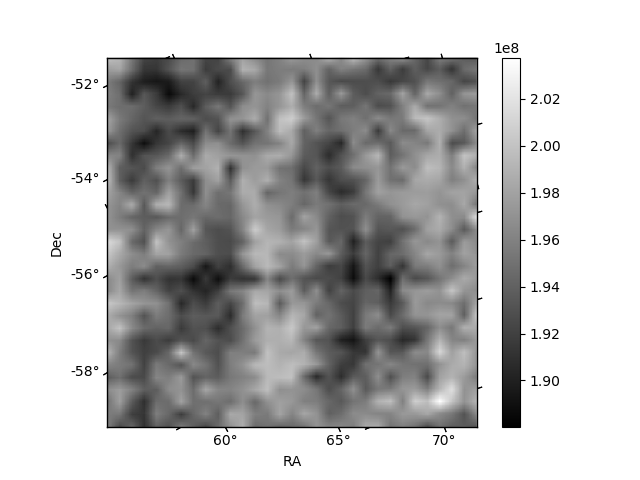
Histogram calculated using DETX and DETY for each event in the final _common_clean file
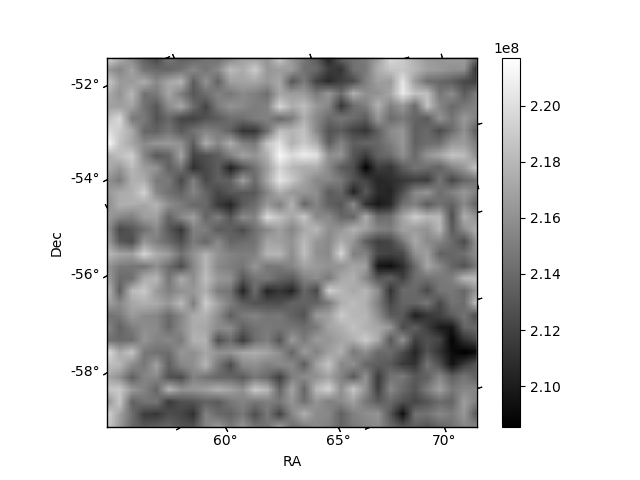
| Quadrant A | 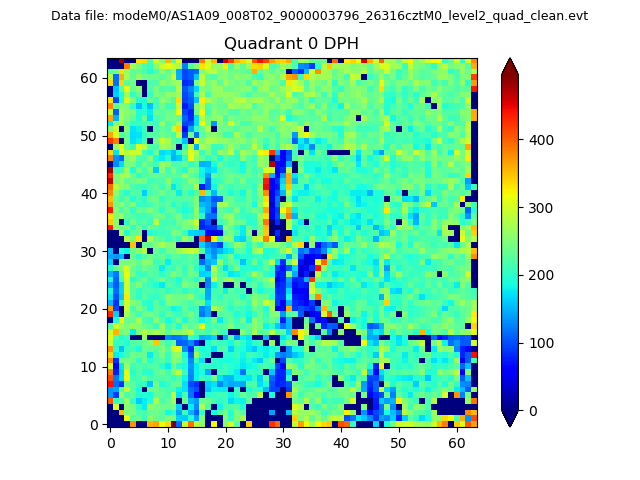 |
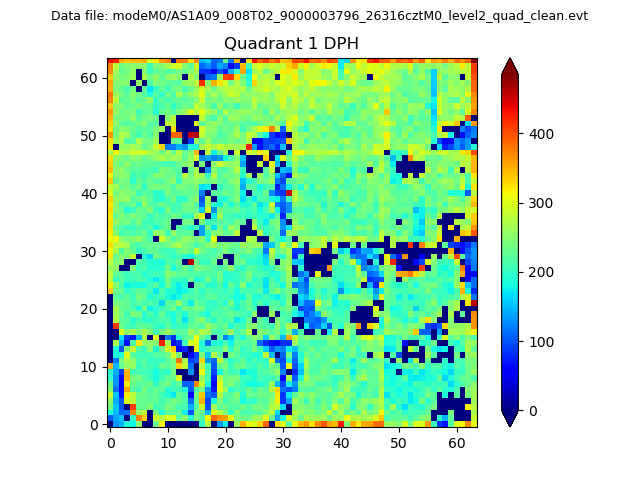 |
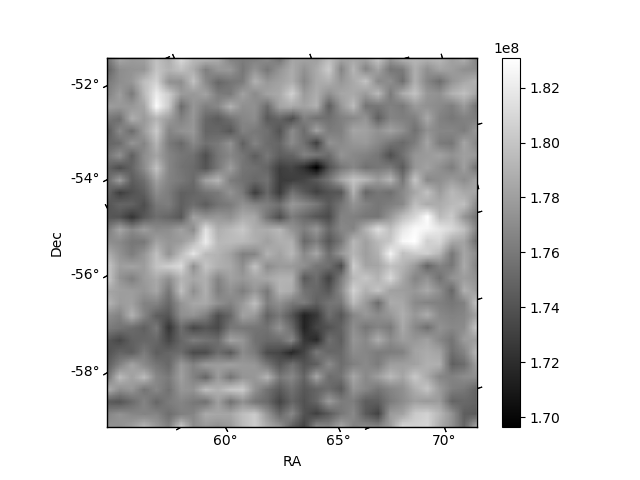
Quadrant B |
|---|---|---|---|
| Quadrant D | 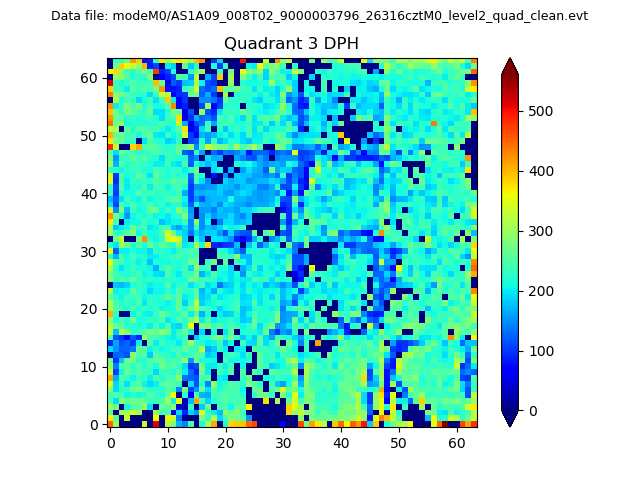 |
 |
Quadrant C |
| Plot type | Count rate plots | Images |
|---|---|---|
| Comparison with Poisson distribution Blue bars denote a histogram of data divided into 1 sec bins. Red curve is a Poisson curve with rate = median count rate of data. |
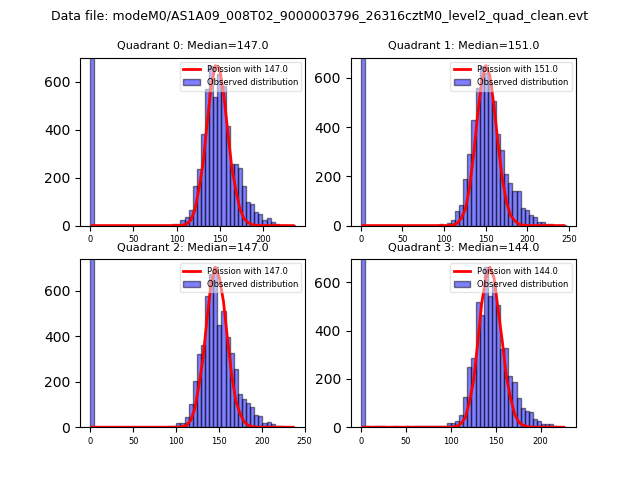 |
 |
| Quadrant-wise count rates Data is divided into 100 sec bins |
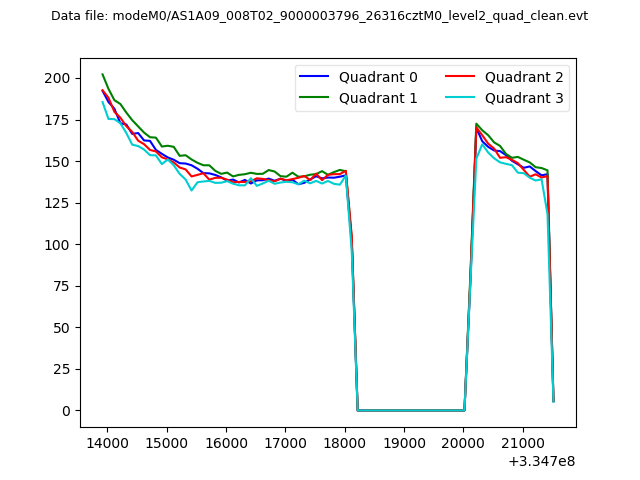 |
|
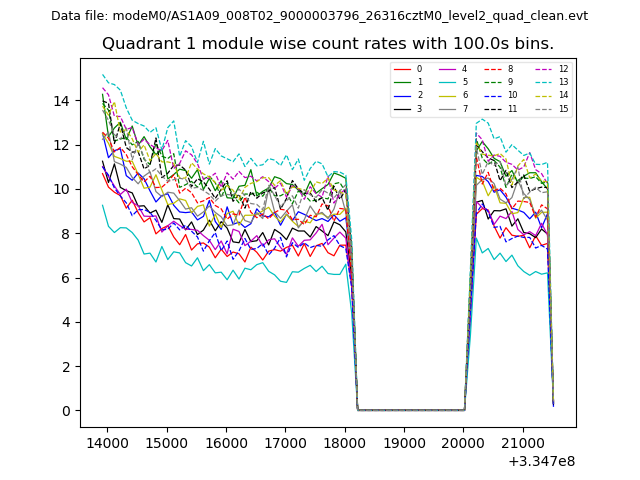
| Module-wise count rates for Quadrant A Data is divided into 100 sec bins |
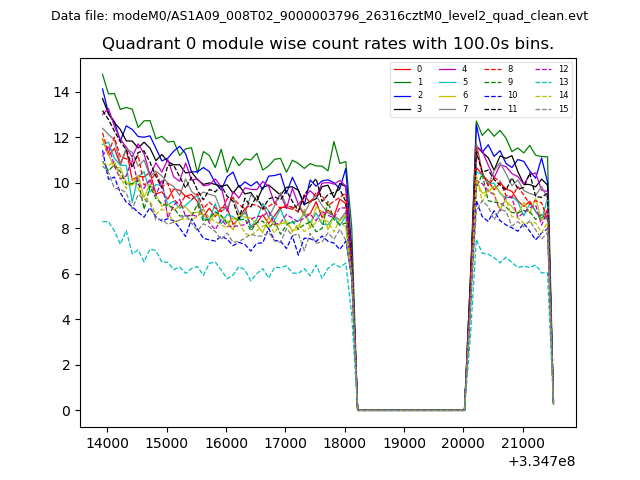 |
 |
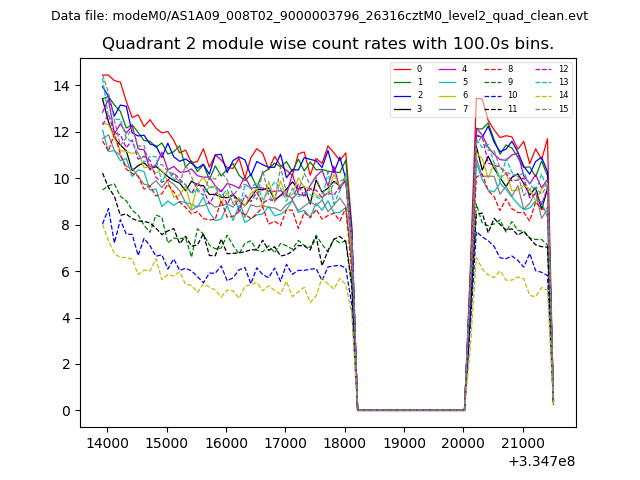
| Module-wise count rates for Quadrant B Data is divided into 100 sec bins |
 |
 |
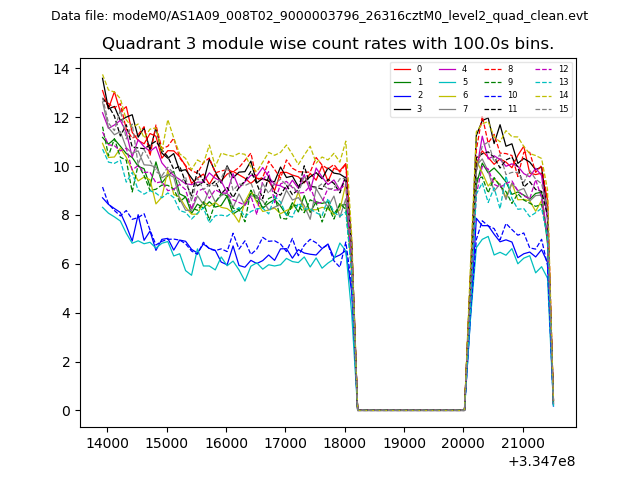
| Module-wise count rates for Quadrant C Data is divided into 100 sec bins |
 |
 |
| Module-wise count rates for Quadrant D Data is divided into 100 sec bins |
 |
 |
| Parameter | Plot |
|---|---|
| CZT HV Monitor | 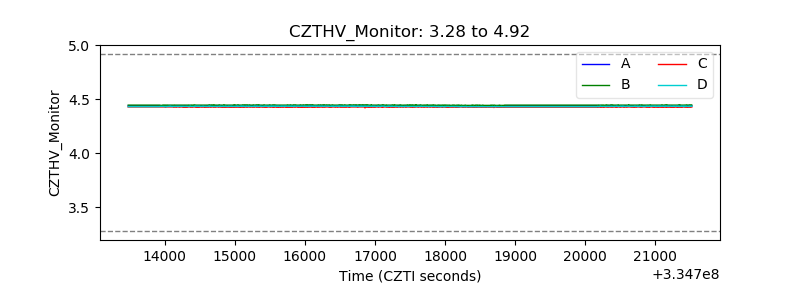 |
| D_VDD | 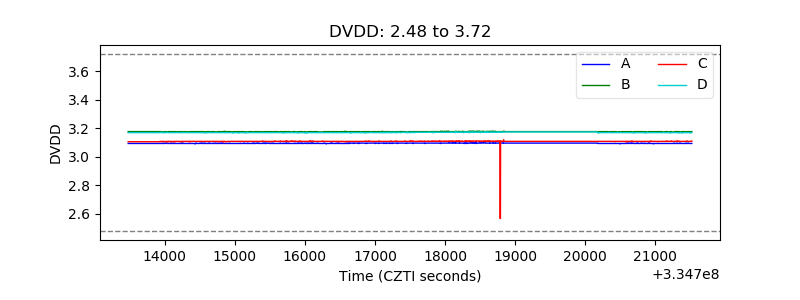 |
| Temperature 1 | 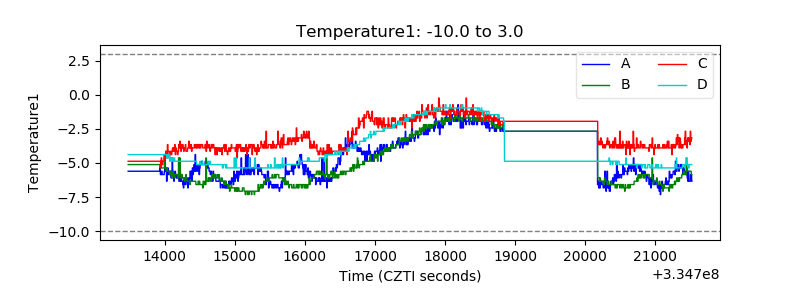 |
| Veto HV Monitor | 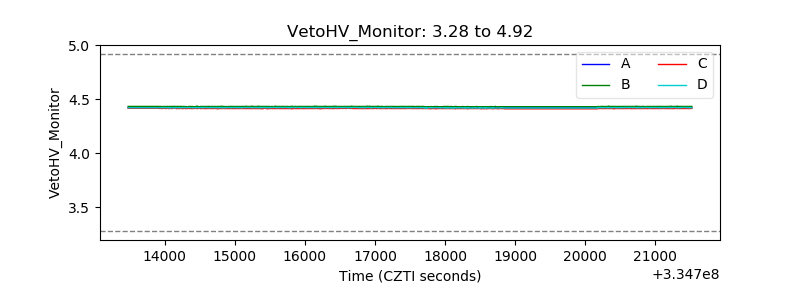 |
| Veto LLD | 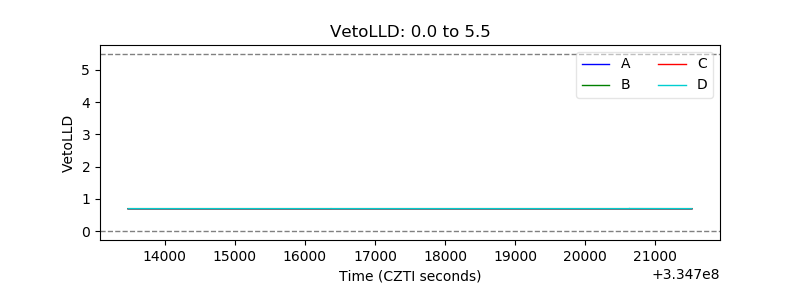 |
| Alpha Counter | 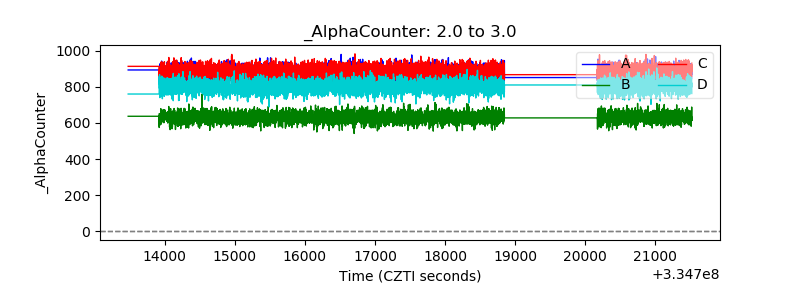 |
| _CPM_Rate | 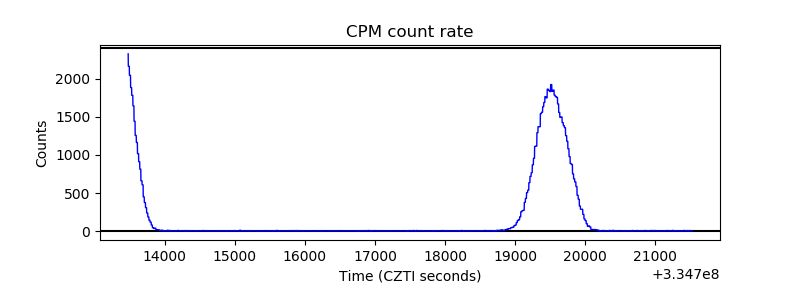 |
| CZT Counter | 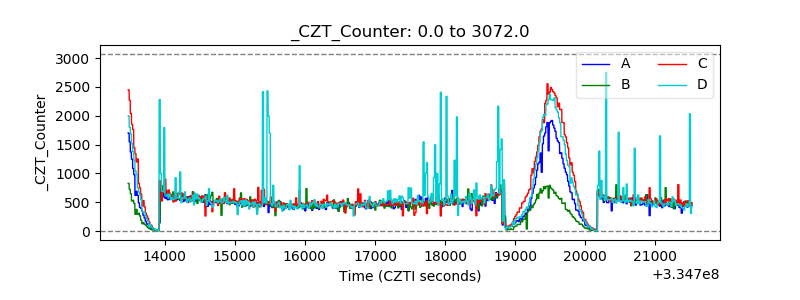 |
| +2.5 Volts monitor |  |
| +5 Volts monitor | 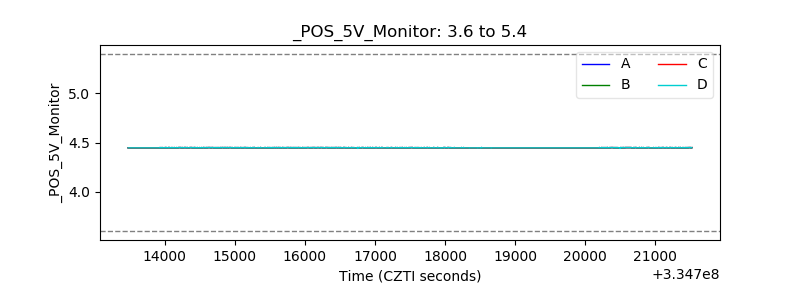 |
| _ROLL_ROT | 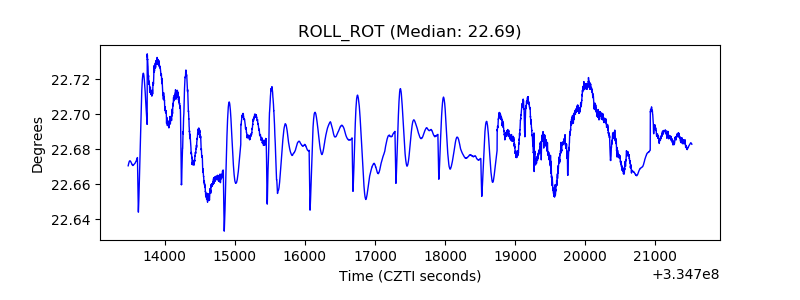 |
| _Roll_DEC | 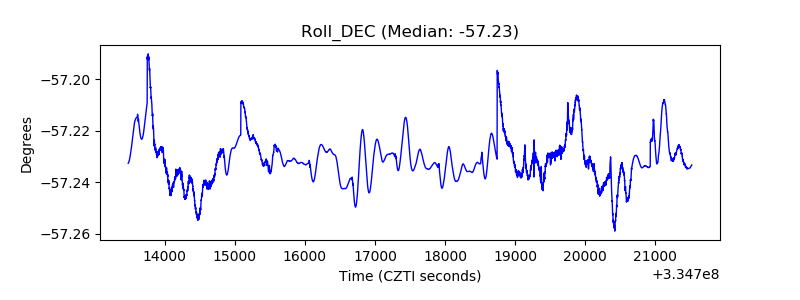 |
| _Roll_RA | 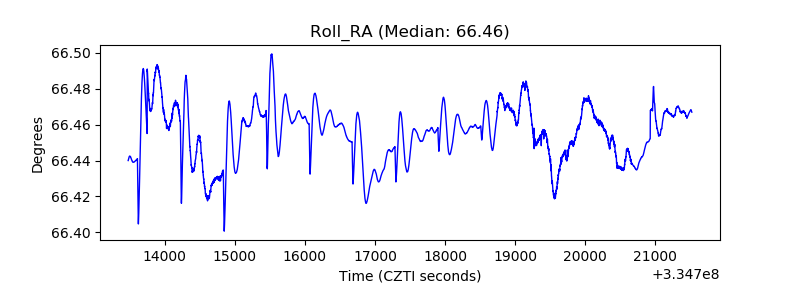 |
| Veto Counter | 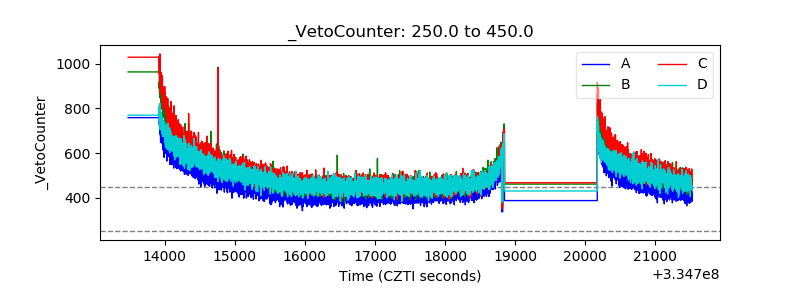 |