| Param | Original file | Final file |
|---|---|---|
| Filename | modeM0/AS1A09_008T02_9000003796_26317cztM0_level2.evt | modeM0/AS1A09_008T02_9000003796_26317cztM0_level2_quad_clean.evt |
| Size (bytes) | 466,850,880 | 111,859,200 |
| Size | 445.2 MB | 106.7 MB |
| Events in quadrant A | 3,096,139 | 732,523 |
| Events in quadrant B | 3,200,581 | 755,675 |
| Events in quadrant C | 3,801,305 | 733,516 |
| Events in quadrant D | 3,602,000 | 715,949 |
| Mode M0 | |||
|---|---|---|---|
| Quadrant | BADHDUFLAG | Total packets | Discarded packets |
| A | 0 | 13234 | 0 |
| B | 0 | 13450 | 0 |
| C | 0 | 15166 | 0 |
| D | 0 | 14881 | 0 |
| Mode M9 | |||
|---|---|---|---|
| Quadrant | BADHDUFLAG | Total packets | Discarded packets |
| A | 0 | 23 | 0 |
| B | 0 | 24 | 0 |
| C | 0 | 24 | 0 |
| D | 0 | 24 | 0 |
| Quadrant | Total seconds | Saturated seconds | Saturation percentage |
|---|---|---|---|
| A | 6452 | 23 | 0.356479% |
| B | 6452 | 40 | 0.619963% |
| C | 6452 | 162 | 2.510849% |
| D | 6452 | 128 | 1.983881% |
Noise dominated data is calculated using 1-second bins in cleaned event files. If a bin has >2000 counts, and if more than 50% of those come from <1% of pixels, then it is considered to be noise-dominated and hence unusable.
| Quadrant | # 1 sec bins | Bins with >0 counts | Bins with >2000 counts | High rate bins dominated by noise | Noise dominated (total time) | Noise dominated (detector-on time) | Marked lightcurve |
|---|---|---|---|---|---|---|---|
| A | 7582 | 6451 | 0 | 0 | 0.00% | 0.00% | 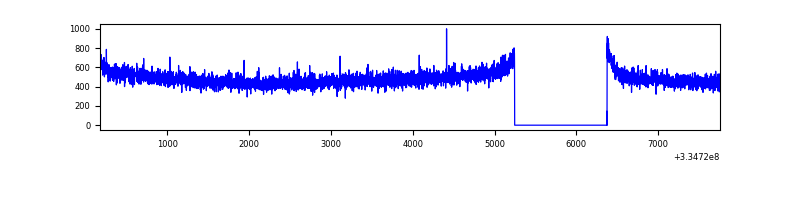 |
| B | 7582 | 6453 | 0 | 0 | 0.00% | 0.00% | 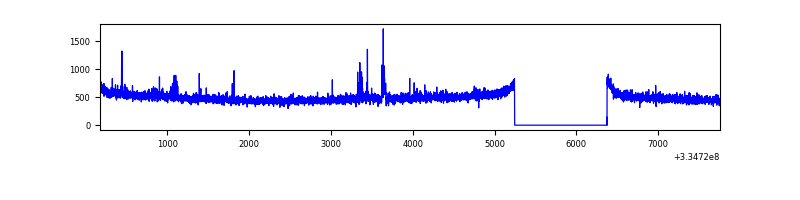 |
| C | 7582 | 6451 | 35 | 35 | 0.46% | 0.54% | 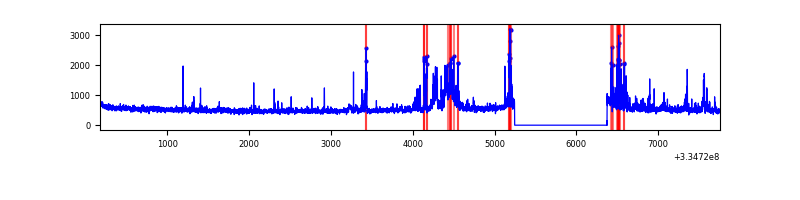 |
| D | 7582 | 6453 | 83 | 83 | 1.09% | 1.29% | 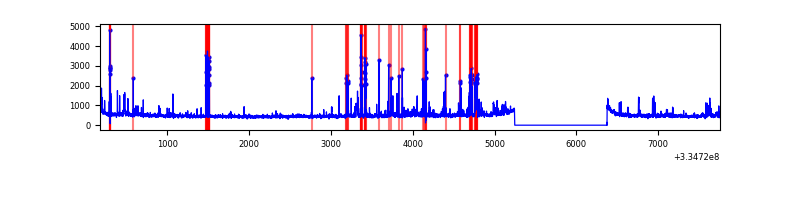 |
Top three noisy pixels from each quadrant. If the there are fewer than three noisy pixels in the level2.evt file, extra rows are filled as -1
| Pixel properties | Quadrant properties | ||||||
|---|---|---|---|---|---|---|---|
| Quadrant | DetID | PixID | Counts | Sigma | Mean | Median | Sigma |
| A | 13 | 254 | 10998 | 63.53 | 802 | 785 | 160.8 |
| A | 3 | 137 | 7352 | 40.85 | 802 | 785 | 160.8 |
| A | 0 | 226 | 6723 | 36.94 | 802 | 785 | 160.8 |
| B | 12 | 16 | 33349 | 218.16 | 804 | 785 | 149.3 |
| B | 12 | 111 | 17876 | 114.5 | 804 | 785 | 149.3 |
| B | 11 | 111 | 16396 | 104.58 | 804 | 785 | 149.3 |
| C | 3 | 233 | 359900 | 1961.78 | 792 | 798 | 183.0 |
| C | 4 | 254 | 171428 | 932.15 | 792 | 798 | 183.0 |
| C | 14 | 238 | 127710 | 693.32 | 792 | 798 | 183.0 |
| D | 1 | 52 | 346724 | 1845.5 | 792 | 772 | 187.5 |
| D | 11 | 176 | 132366 | 701.99 | 792 | 772 | 187.5 |
| D | 12 | 233 | 84827 | 448.4 | 792 | 772 | 187.5 |
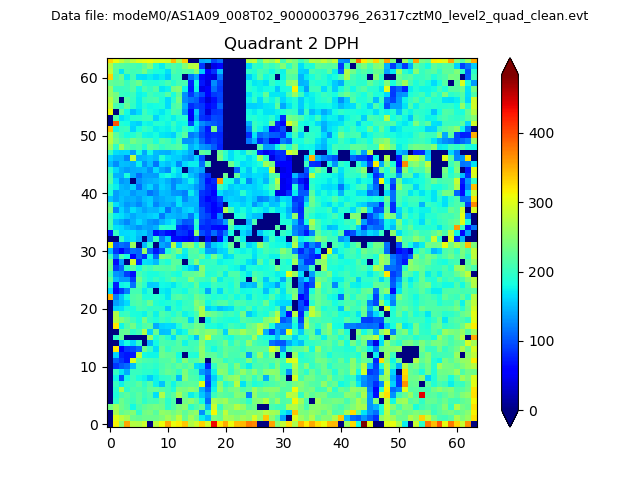
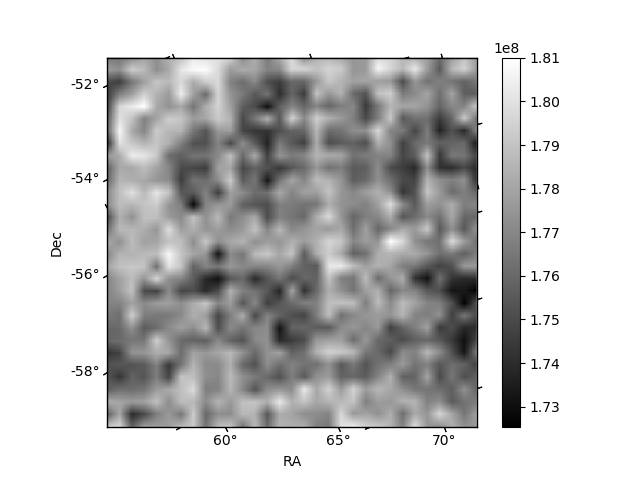
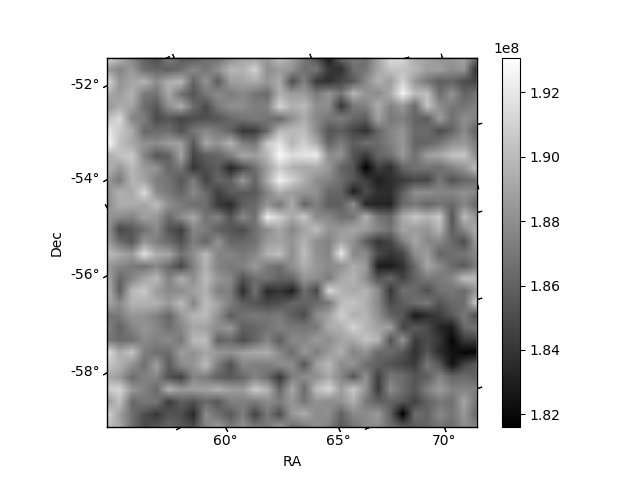
Histogram calculated using DETX and DETY for each event in the final _common_clean file
| Quadrant A |  |
 |
Quadrant B |
|---|---|---|---|
| Quadrant D | 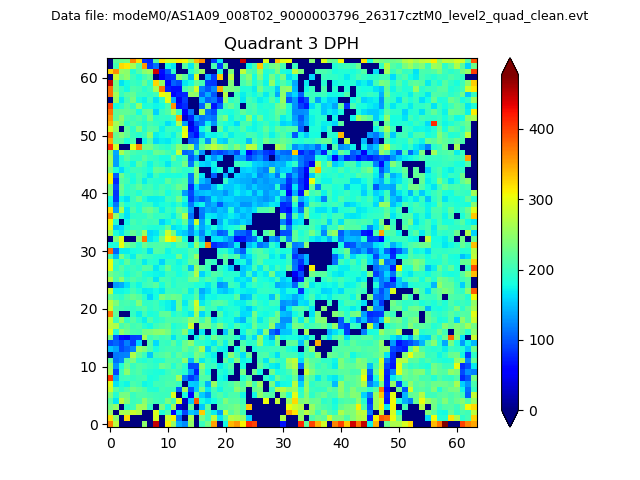 |
 |
Quadrant C |
| Plot type | Count rate plots | Images |
|---|---|---|
| Comparison with Poisson distribution Blue bars denote a histogram of data divided into 1 sec bins. Red curve is a Poisson curve with rate = median count rate of data. |
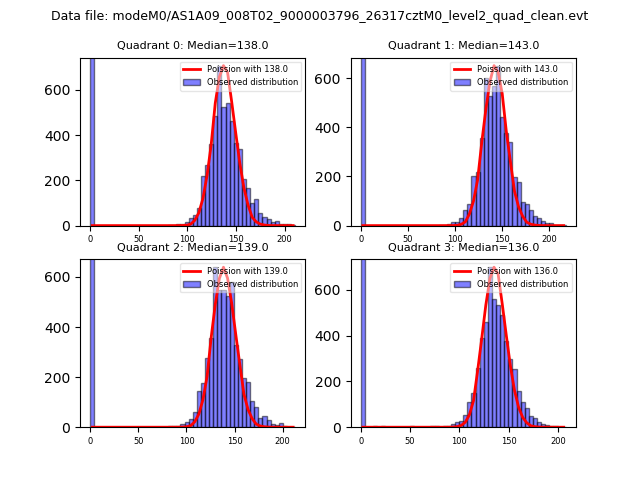 |
 |
| Quadrant-wise count rates Data is divided into 100 sec bins |
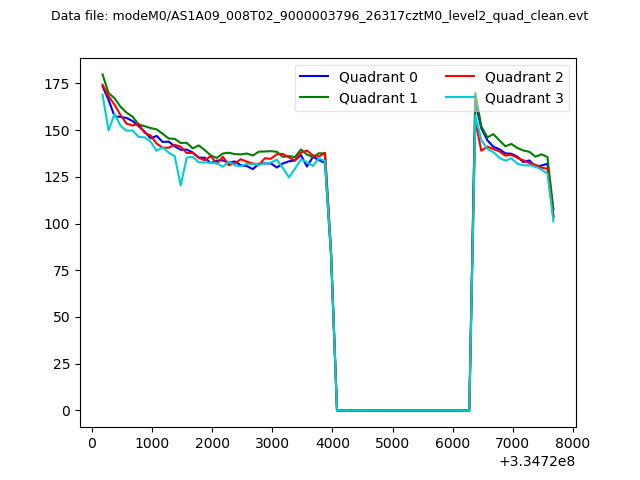 |
|
| Module-wise count rates for Quadrant A Data is divided into 100 sec bins |
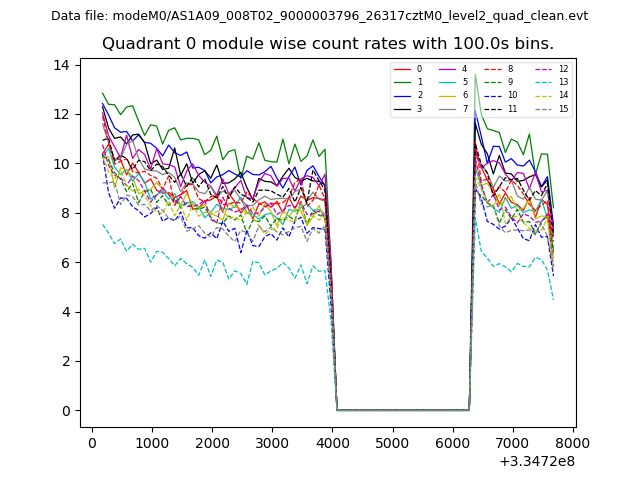 |
 |
| Module-wise count rates for Quadrant B Data is divided into 100 sec bins |
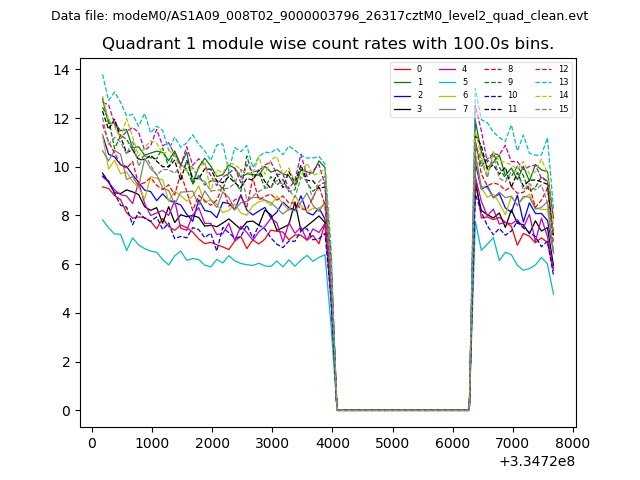 |
 |
| Module-wise count rates for Quadrant C Data is divided into 100 sec bins |
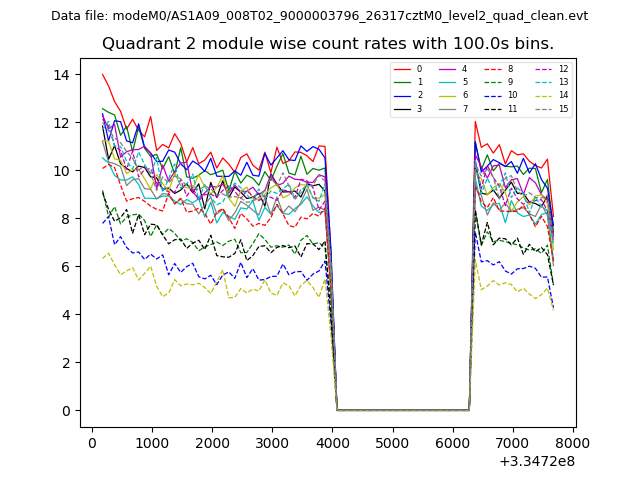 |
 |
| Module-wise count rates for Quadrant D Data is divided into 100 sec bins |
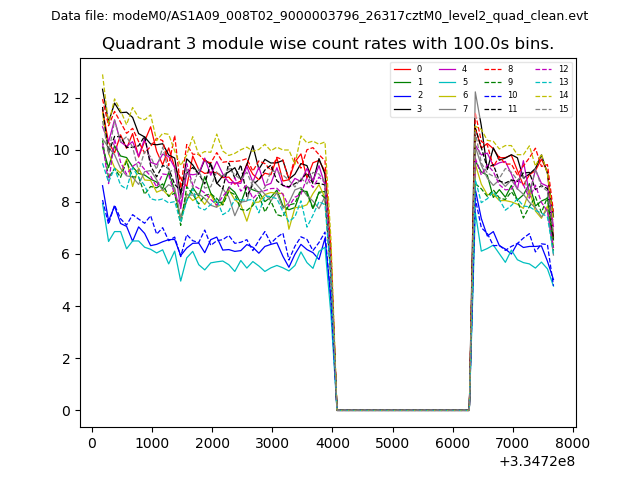 |
 |
| Parameter | Plot |
|---|---|
| CZT HV Monitor | 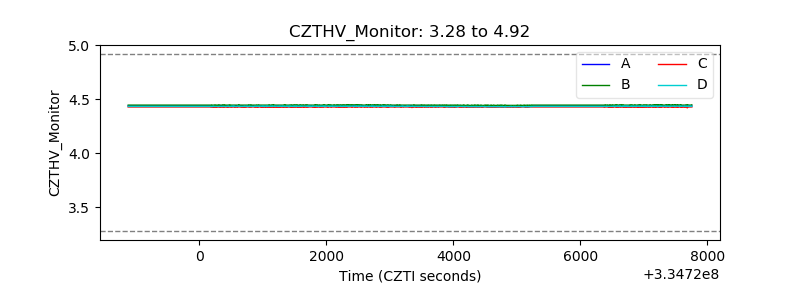 |
| D_VDD | 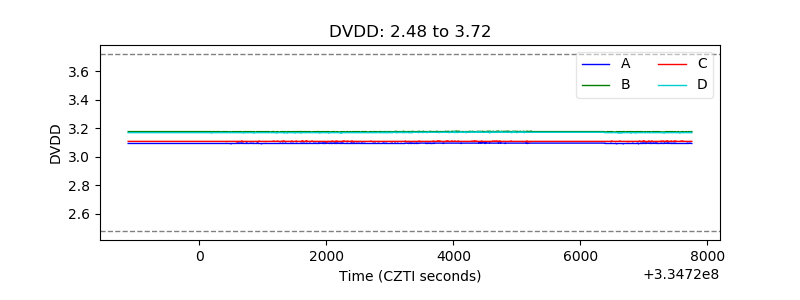 |
| Temperature 1 | 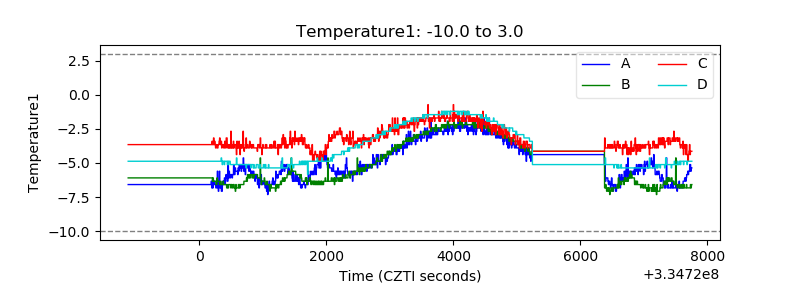 |
| Veto HV Monitor |  |
| Veto LLD | 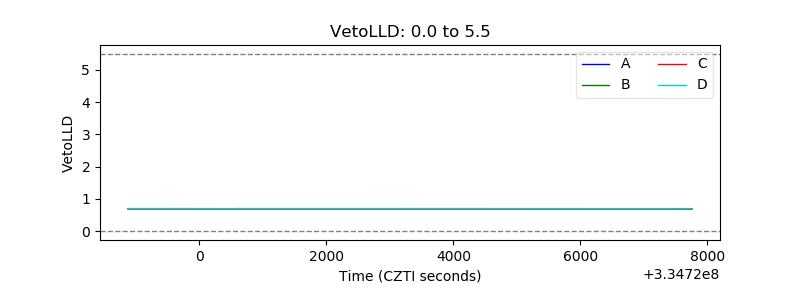 |
| Alpha Counter | 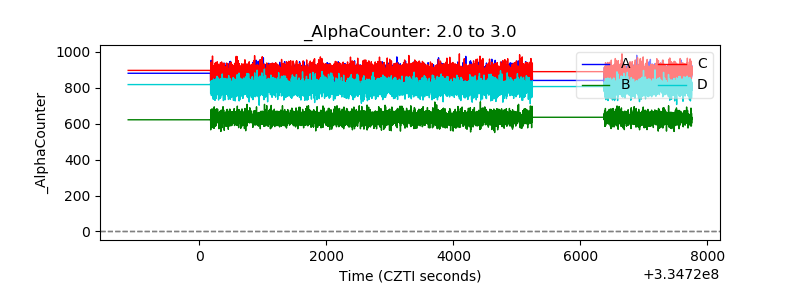 |
| _CPM_Rate | 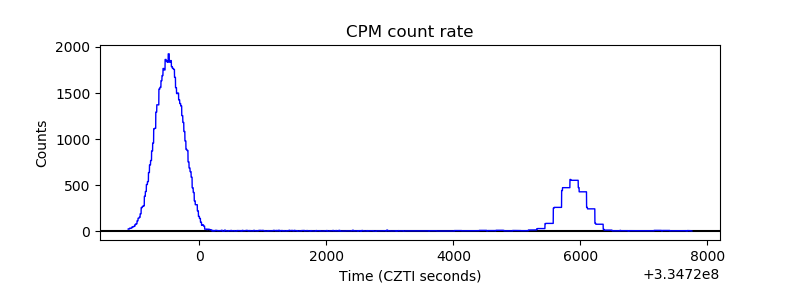 |
| CZT Counter | 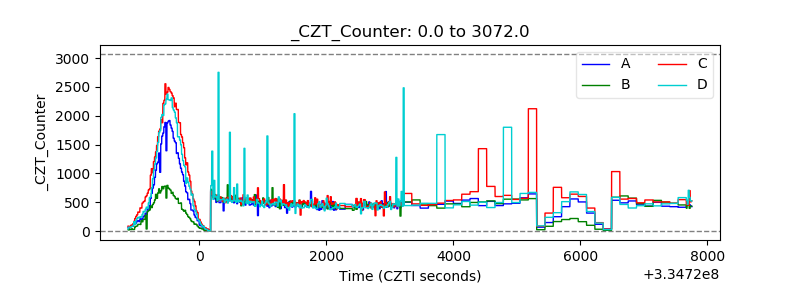 |
| +2.5 Volts monitor |  |
| +5 Volts monitor |  |
| _ROLL_ROT | 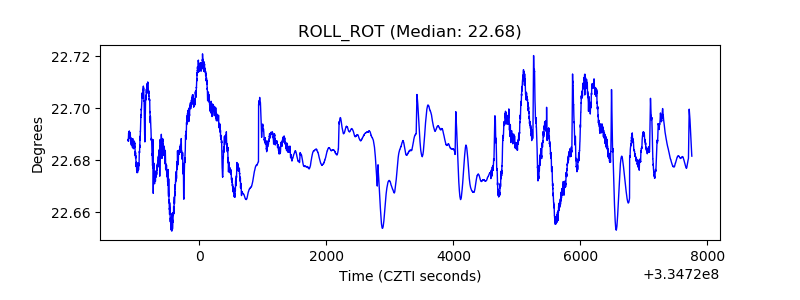 |
| _Roll_DEC | 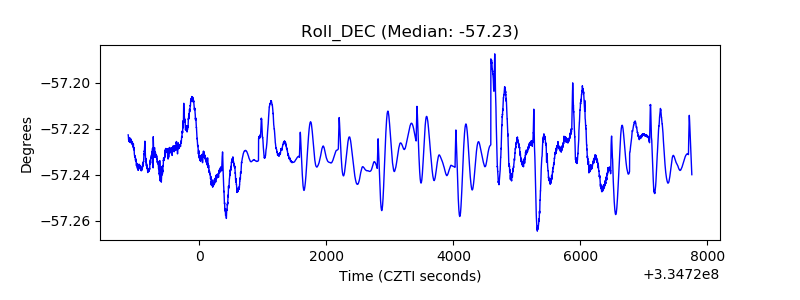 |
| _Roll_RA | 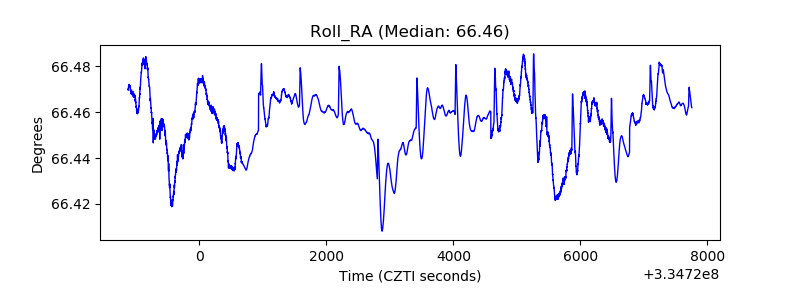 |
| Veto Counter | 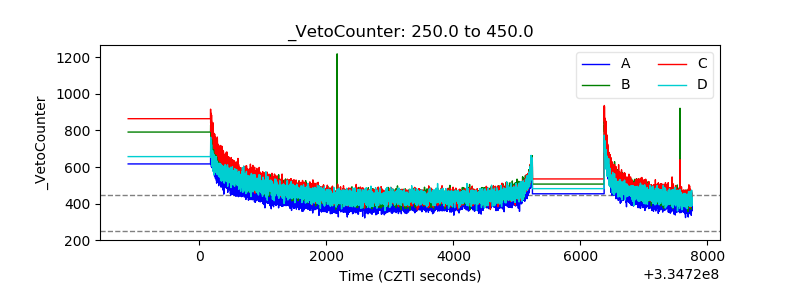 |