| Param | Original file | Final file |
|---|---|---|
| Filename | modeM0/AS1A09_008T02_9000003796_26319cztM0_level2.evt | modeM0/AS1A09_008T02_9000003796_26319cztM0_level2_quad_clean.evt |
| Size (bytes) | 505,117,440 | 105,739,200 |
| Size | 481.7 MB | 100.8 MB |
| Events in quadrant A | 3,123,241 | 690,961 |
| Events in quadrant B | 3,352,664 | 707,312 |
| Events in quadrant C | 3,948,869 | 679,298 |
| Events in quadrant D | 4,409,205 | 649,045 |
| Mode M0 | |||
|---|---|---|---|
| Quadrant | BADHDUFLAG | Total packets | Discarded packets |
| A | 0 | 13833 | 0 |
| B | 0 | 14431 | 0 |
| C | 0 | 15968 | 0 |
| D | 0 | 17592 | 0 |
| Mode M9 | |||
|---|---|---|---|
| Quadrant | BADHDUFLAG | Total packets | Discarded packets |
| A | 0 | 3 | 0 |
| B | 0 | 3 | 0 |
| C | 0 | 3 | 0 |
| D | 0 | 3 | 0 |
| Quadrant | Total seconds | Saturated seconds | Saturation percentage |
|---|---|---|---|
| A | 6819 | 53 | 0.777240% |
| B | 6819 | 104 | 1.525150% |
| C | 6819 | 255 | 3.739551% |
| D | 6819 | 412 | 6.041942% |
Noise dominated data is calculated using 1-second bins in cleaned event files. If a bin has >2000 counts, and if more than 50% of those come from <1% of pixels, then it is considered to be noise-dominated and hence unusable.
| Quadrant | # 1 sec bins | Bins with >0 counts | Bins with >2000 counts | High rate bins dominated by noise | Noise dominated (total time) | Noise dominated (detector-on time) | Marked lightcurve |
|---|---|---|---|---|---|---|---|
| A | 7204 | 6821 | 0 | 0 | 0.00% | 0.00% | 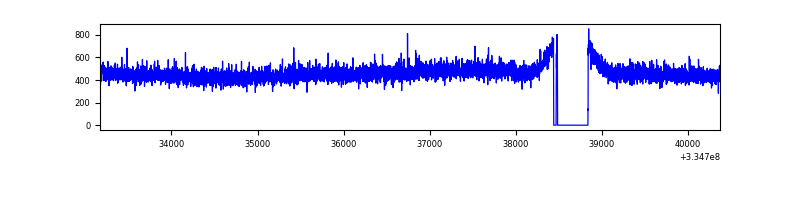 |
| B | 7204 | 6821 | 19 | 19 | 0.26% | 0.28% | 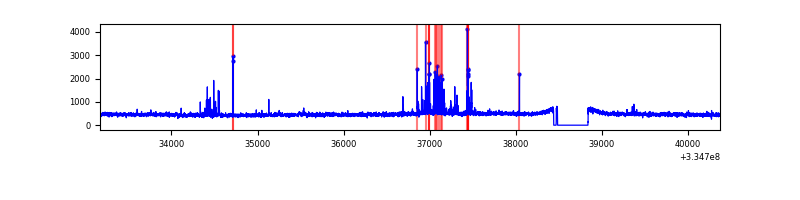 |
| C | 7204 | 6821 | 63 | 63 | 0.87% | 0.92% | 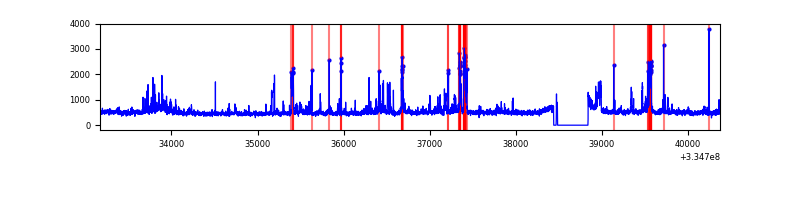 |
| D | 7204 | 6820 | 323 | 323 | 4.48% | 4.74% | 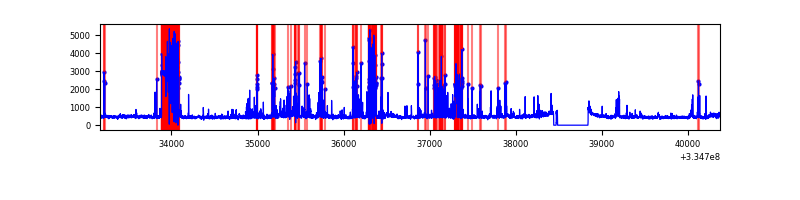 |
Top three noisy pixels from each quadrant. If the there are fewer than three noisy pixels in the level2.evt file, extra rows are filled as -1
| Pixel properties | Quadrant properties | ||||||
|---|---|---|---|---|---|---|---|
| Quadrant | DetID | PixID | Counts | Sigma | Mean | Median | Sigma |
| A | 13 | 254 | 10313 | 58.53 | 809 | 792 | 162.7 |
| A | 3 | 137 | 7524 | 41.38 | 809 | 792 | 162.7 |
| A | 0 | 226 | 6728 | 36.49 | 809 | 792 | 162.7 |
| B | 12 | 16 | 187446 | 1216.12 | 805 | 782 | 153.5 |
| B | 12 | 111 | 18872 | 117.86 | 805 | 782 | 153.5 |
| B | 11 | 111 | 16729 | 103.9 | 805 | 782 | 153.5 |
| C | 3 | 233 | 726166 | 3973.3 | 785 | 788 | 182.6 |
| C | 14 | 238 | 127071 | 691.72 | 785 | 788 | 182.6 |
| C | 2 | 16 | 33259 | 177.86 | 785 | 788 | 182.6 |
| D | 11 | 176 | 828145 | 4543.3 | 770 | 752 | 182.1 |
| D | 1 | 52 | 538442 | 2952.51 | 770 | 752 | 182.1 |
| D | 12 | 233 | 104606 | 570.27 | 770 | 752 | 182.1 |
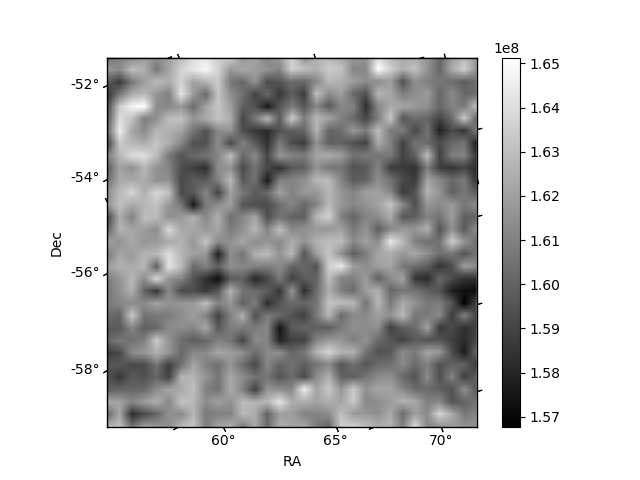
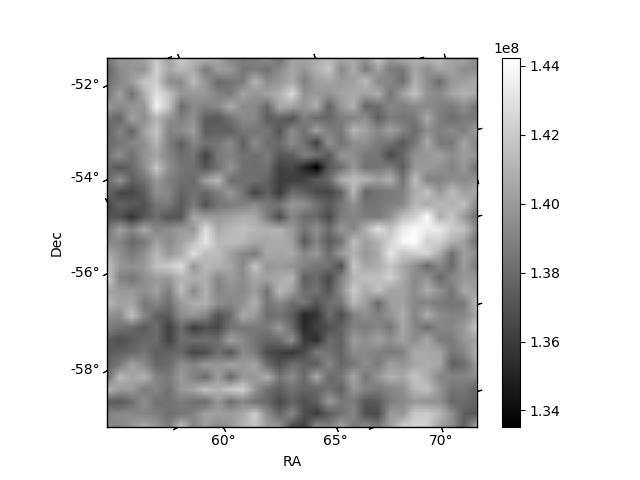
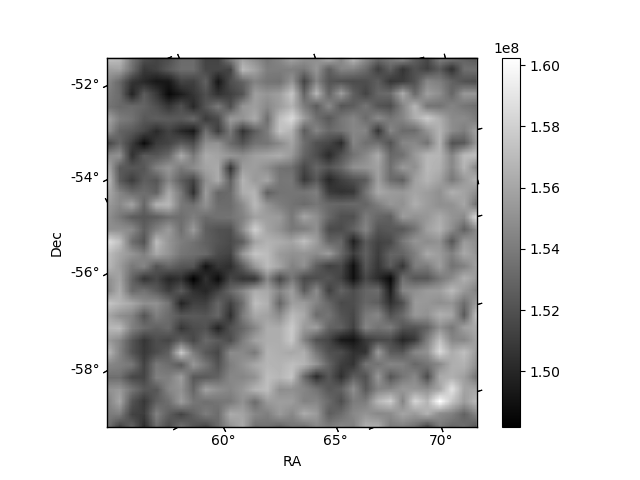
Histogram calculated using DETX and DETY for each event in the final _common_clean file
| Quadrant A | 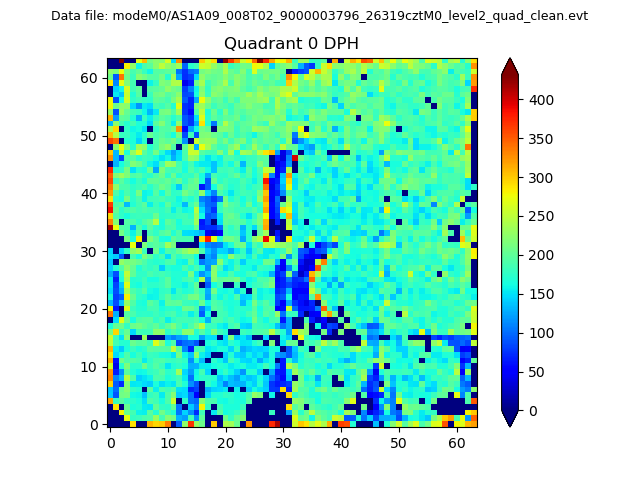 |
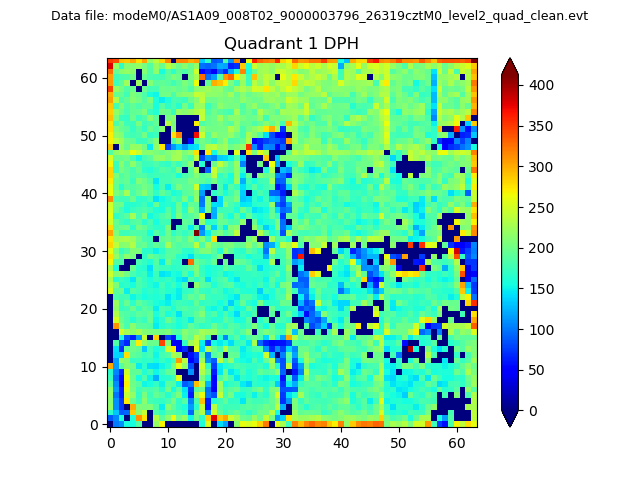 |
Quadrant B |
|---|---|---|---|
| Quadrant D | 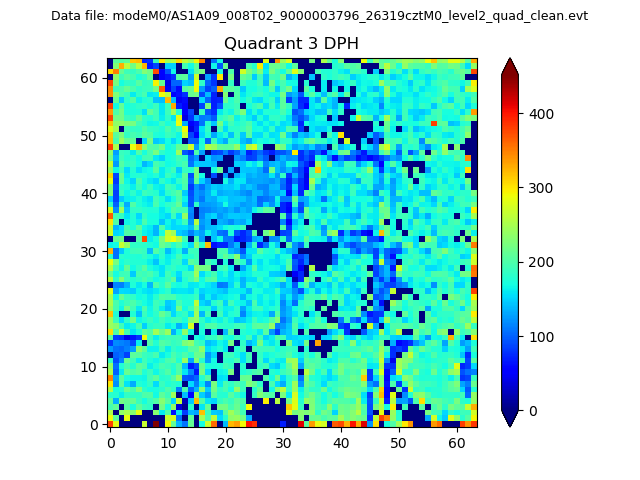 |
 |
Quadrant C |
| Plot type | Count rate plots | Images |
|---|---|---|
| Comparison with Poisson distribution Blue bars denote a histogram of data divided into 1 sec bins. Red curve is a Poisson curve with rate = median count rate of data. |
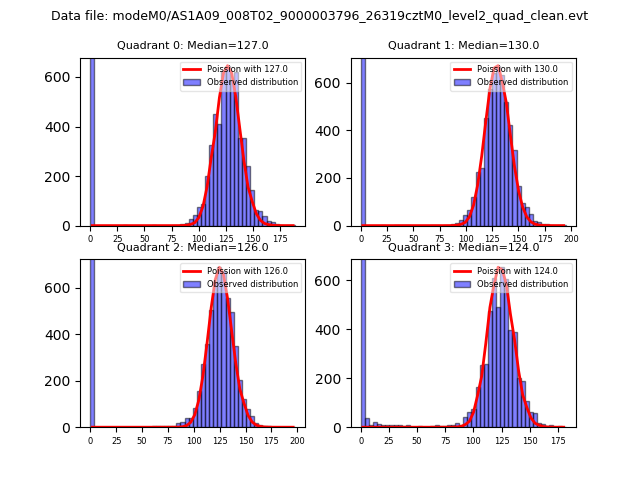 |
 |
| Quadrant-wise count rates Data is divided into 100 sec bins |
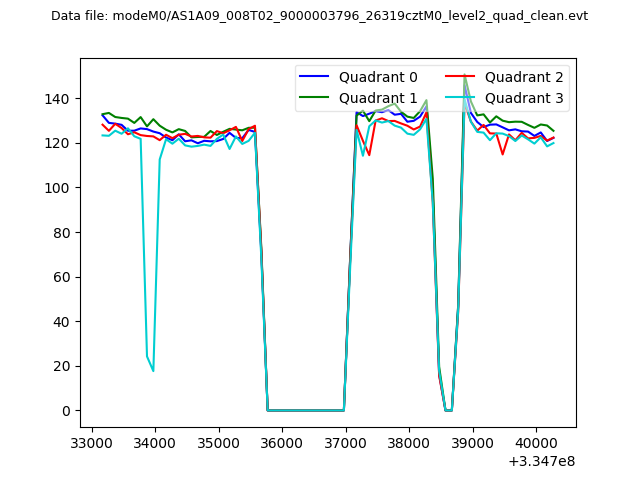 |
|
| Module-wise count rates for Quadrant A Data is divided into 100 sec bins |
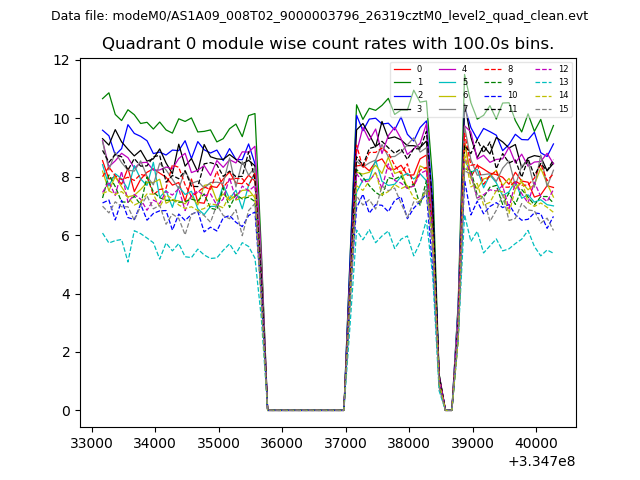 |
 |
| Module-wise count rates for Quadrant B Data is divided into 100 sec bins |
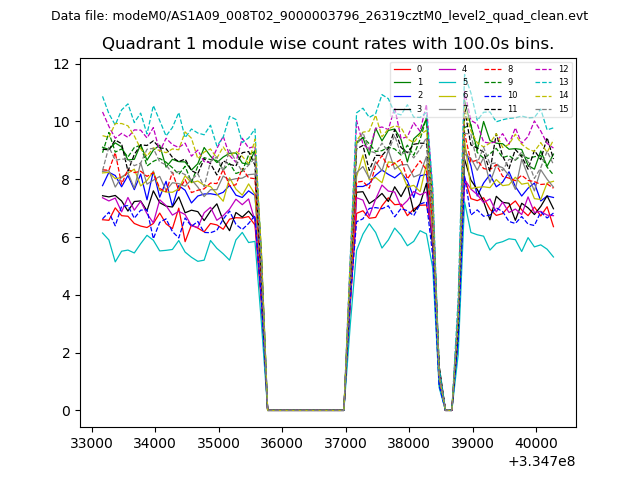 |
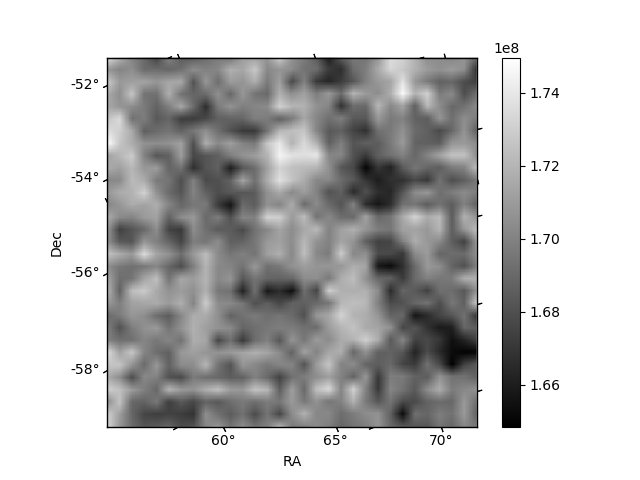 |
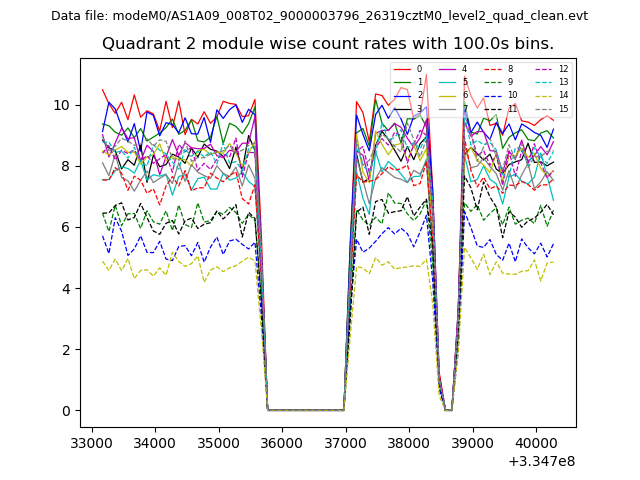
| Module-wise count rates for Quadrant C Data is divided into 100 sec bins |
 |
 |
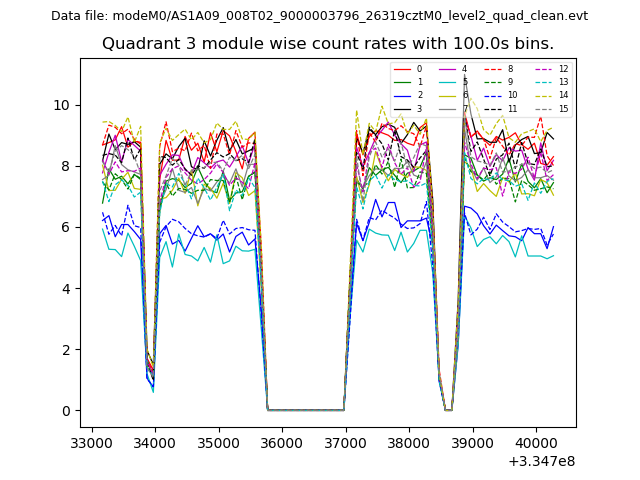
| Module-wise count rates for Quadrant D Data is divided into 100 sec bins |
 |
 |
| Parameter | Plot |
|---|---|
| CZT HV Monitor | 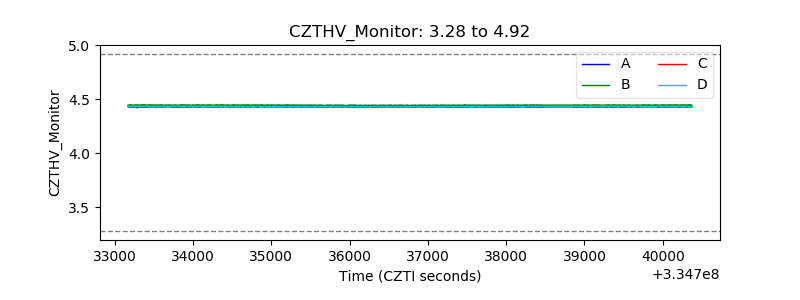 |
| D_VDD | 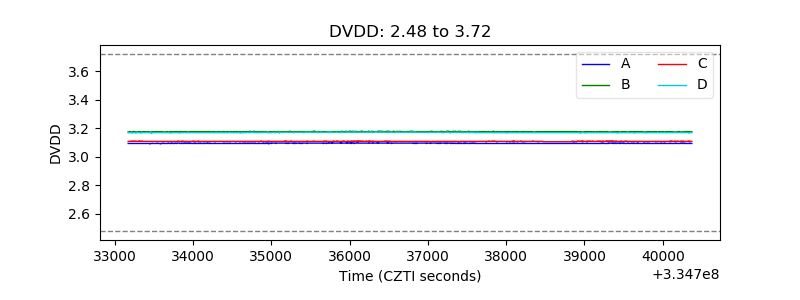 |
| Temperature 1 | 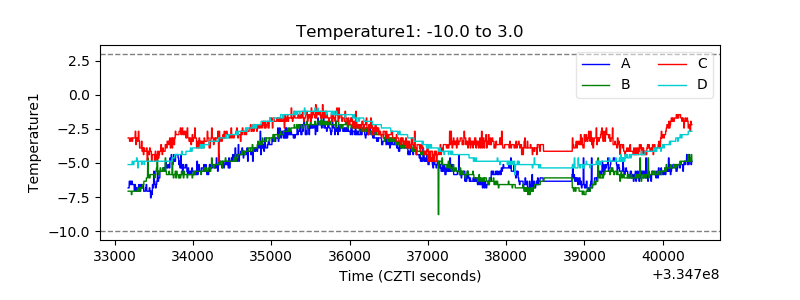 |
| Veto HV Monitor | 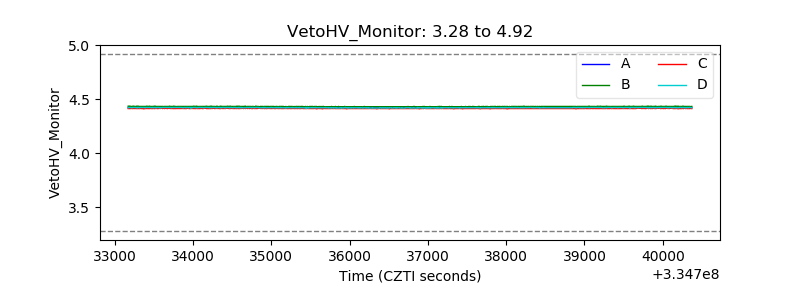 |
| Veto LLD | 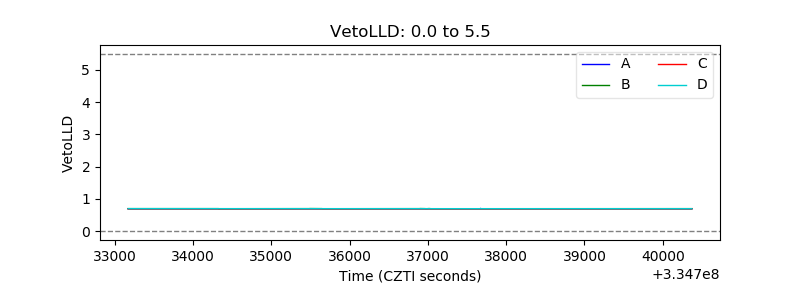 |
| Alpha Counter | 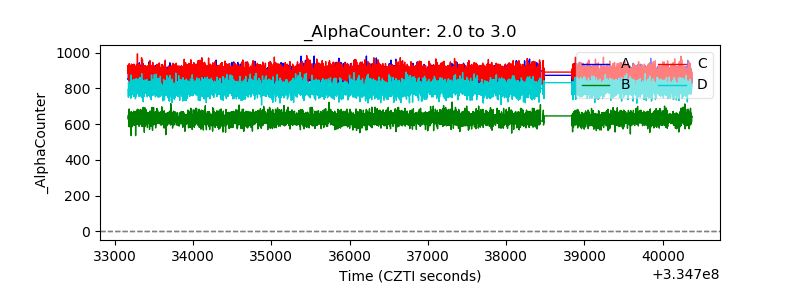 |
| _CPM_Rate | 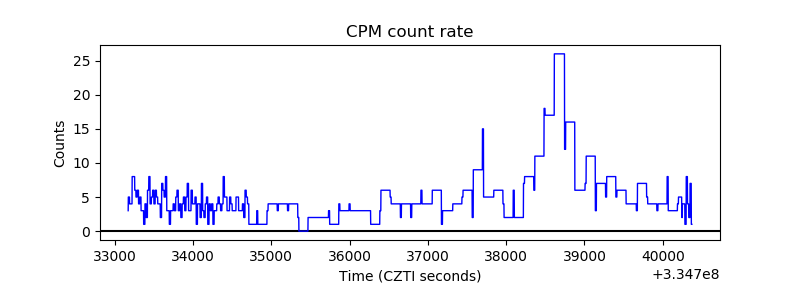 |
| CZT Counter |  |
| +2.5 Volts monitor |  |
| +5 Volts monitor |  |
| _ROLL_ROT | 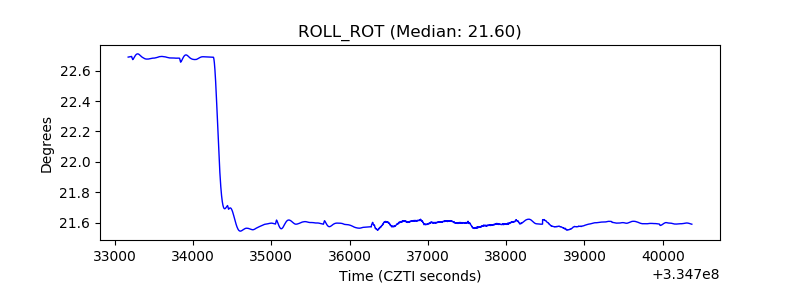 |
| _Roll_DEC | 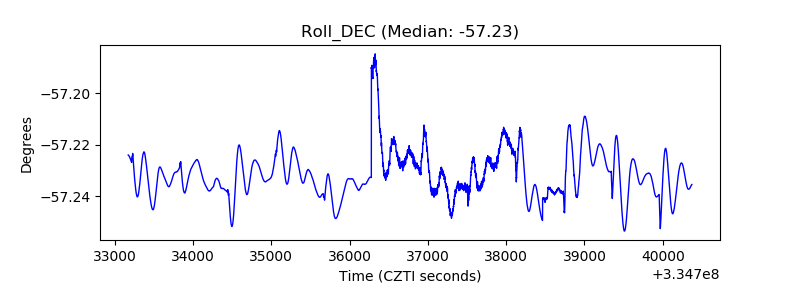 |
| _Roll_RA |  |
| Veto Counter | 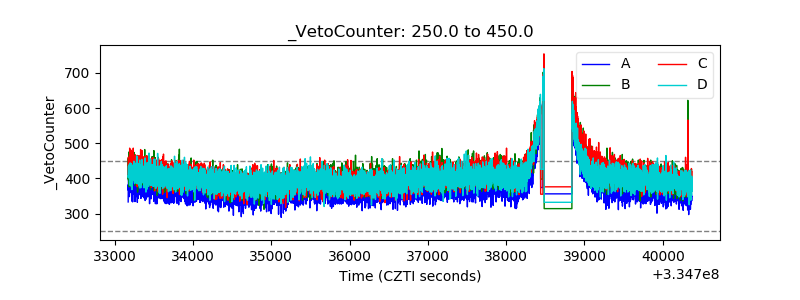 |