| Param | Original file | Final file |
|---|---|---|
| Filename | modeM0/AS1A09_008T02_9000003796_26320cztM0_level2.evt | modeM0/AS1A09_008T02_9000003796_26320cztM0_level2_quad_clean.evt |
| Size (bytes) | 517,187,520 | 109,647,360 |
| Size | 493.2 MB | 104.6 MB |
| Events in quadrant A | 3,245,971 | 711,350 |
| Events in quadrant B | 3,307,122 | 731,385 |
| Events in quadrant C | 3,748,488 | 704,614 |
| Events in quadrant D | 4,881,894 | 681,437 |
| Mode M0 | |||
|---|---|---|---|
| Quadrant | BADHDUFLAG | Total packets | Discarded packets |
| A | 0 | 14387 | 0 |
| B | 0 | 14489 | 0 |
| C | 0 | 15466 | 0 |
| D | 0 | 19244 | 0 |
| Mode M9 | |||
|---|---|---|---|
| Quadrant | BADHDUFLAG | Total packets | Discarded packets |
| A | 0 | 2 | 0 |
| B | 0 | 2 | 0 |
| C | 0 | 2 | 0 |
| D | 0 | 2 | 0 |
| Quadrant | Total seconds | Saturated seconds | Saturation percentage |
|---|---|---|---|
| A | 7056 | 155 | 2.196712% |
| B | 7056 | 170 | 2.409297% |
| C | 7056 | 272 | 3.854875% |
| D | 7056 | 509 | 7.213719% |
Noise dominated data is calculated using 1-second bins in cleaned event files. If a bin has >2000 counts, and if more than 50% of those come from <1% of pixels, then it is considered to be noise-dominated and hence unusable.
| Quadrant | # 1 sec bins | Bins with >0 counts | Bins with >2000 counts | High rate bins dominated by noise | Noise dominated (total time) | Noise dominated (detector-on time) | Marked lightcurve |
|---|---|---|---|---|---|---|---|
| A | 7256 | 7057 | 0 | 0 | 0.00% | 0.00% | 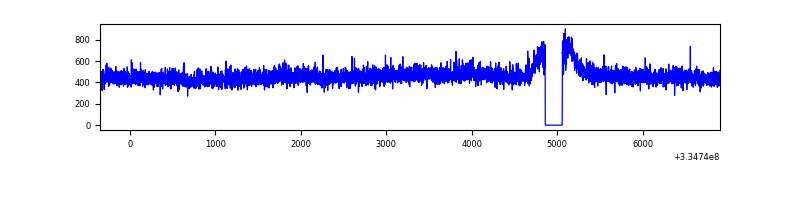 |
| B | 7256 | 7057 | 0 | 0 | 0.00% | 0.00% | 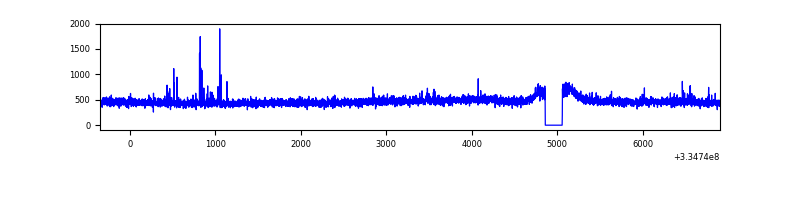 |
| C | 7256 | 7057 | 41 | 41 | 0.57% | 0.58% | 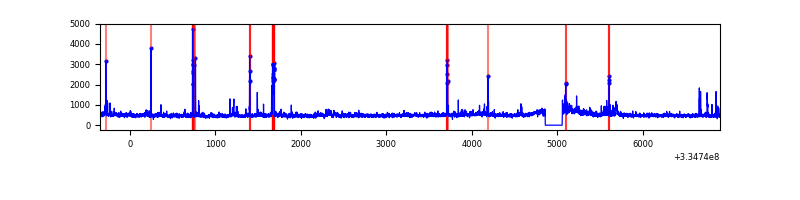 |
| D | 7256 | 7057 | 244 | 244 | 3.36% | 3.46% | 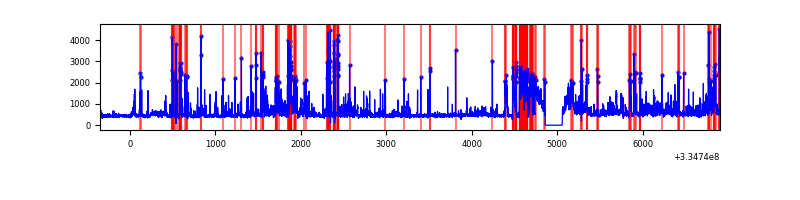 |
Top three noisy pixels from each quadrant. If the there are fewer than three noisy pixels in the level2.evt file, extra rows are filled as -1
| Pixel properties | Quadrant properties | ||||||
|---|---|---|---|---|---|---|---|
| Quadrant | DetID | PixID | Counts | Sigma | Mean | Median | Sigma |
| A | 13 | 254 | 10209 | 55.19 | 839 | 819 | 170.1 |
| A | 3 | 137 | 8011 | 42.27 | 839 | 819 | 170.1 |
| A | 11 | 29 | 7740 | 40.68 | 839 | 819 | 170.1 |
| B | 12 | 16 | 28513 | 173.65 | 834 | 809 | 159.5 |
| B | 12 | 111 | 19671 | 118.23 | 834 | 809 | 159.5 |
| B | 11 | 111 | 17973 | 107.58 | 834 | 809 | 159.5 |
| C | 3 | 233 | 359171 | 1889.58 | 811 | 816 | 189.6 |
| C | 14 | 238 | 129029 | 676.06 | 811 | 816 | 189.6 |
| C | 2 | 16 | 100533 | 525.8 | 811 | 816 | 189.6 |
| D | 1 | 52 | 1354995 | 7013.76 | 808 | 788 | 193.1 |
| D | 11 | 176 | 240719 | 1242.66 | 808 | 788 | 193.1 |
| D | 12 | 233 | 222169 | 1146.59 | 808 | 788 | 193.1 |
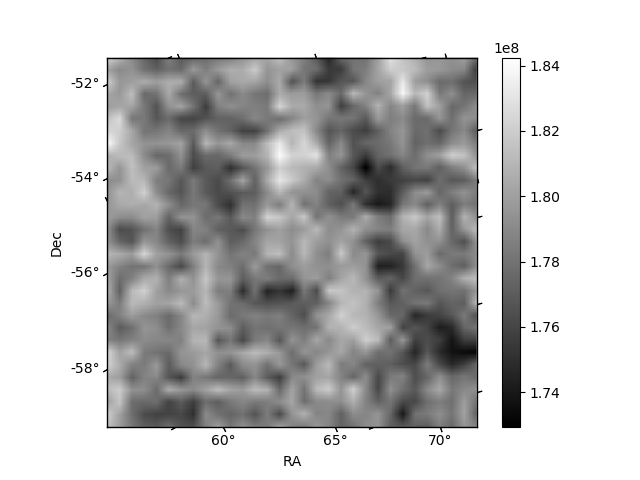
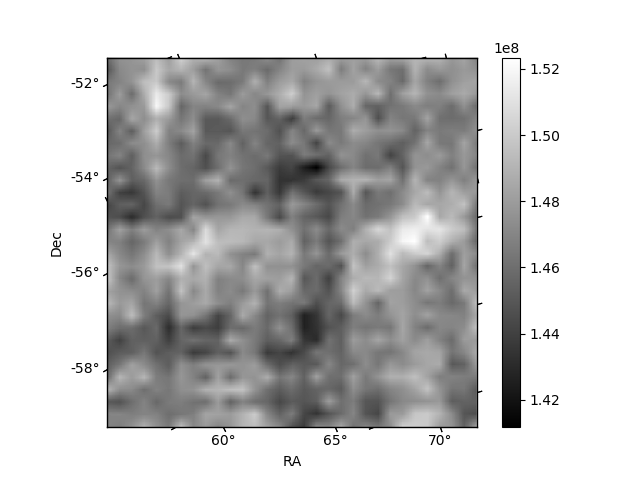
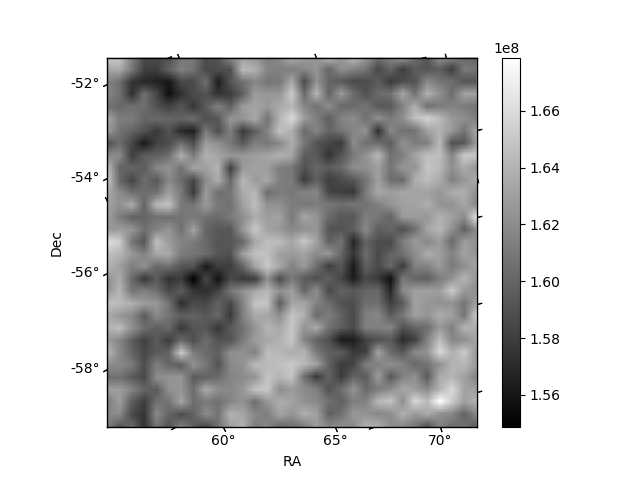
Histogram calculated using DETX and DETY for each event in the final _common_clean file
| Quadrant A | 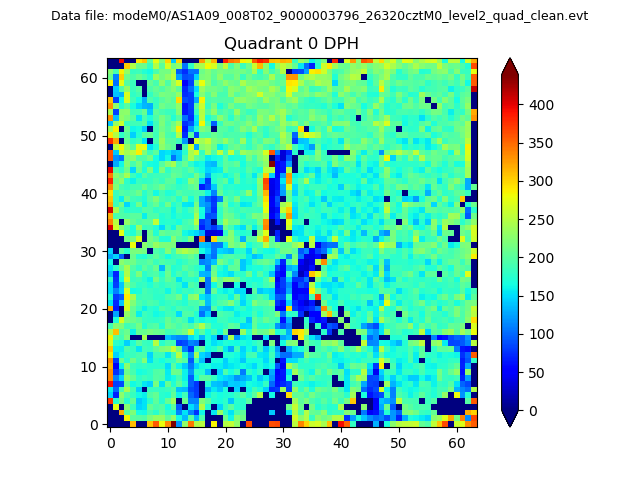 |
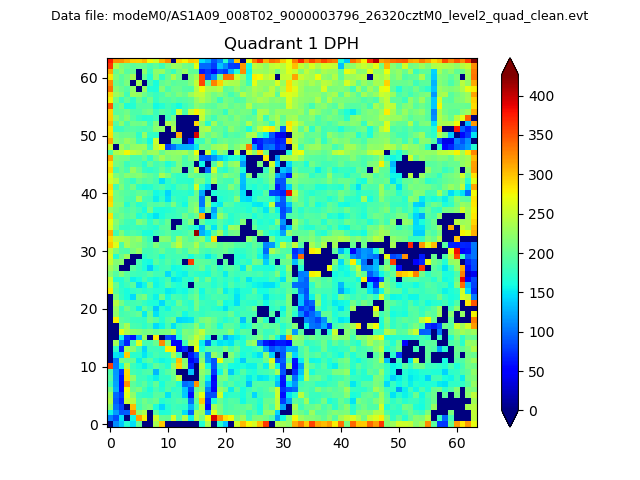 |
Quadrant B |
|---|---|---|---|
| Quadrant D | 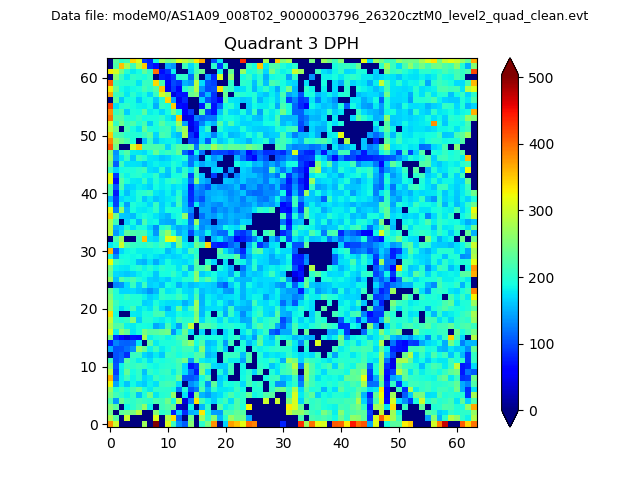 |
 |
Quadrant C |
| Plot type | Count rate plots | Images |
|---|---|---|
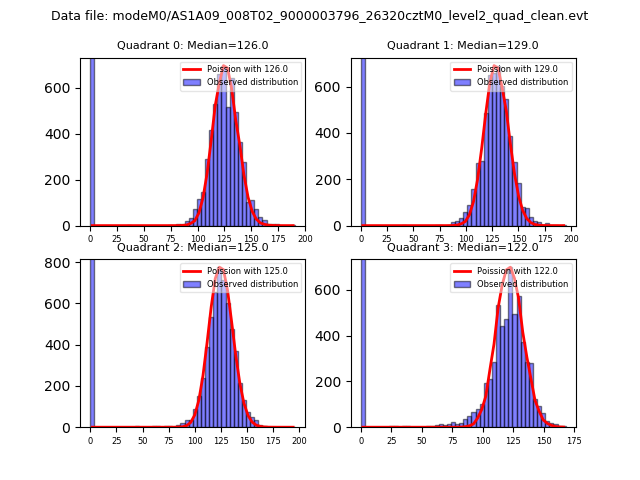
| Comparison with Poisson distribution Blue bars denote a histogram of data divided into 1 sec bins. Red curve is a Poisson curve with rate = median count rate of data. |
 |
 |
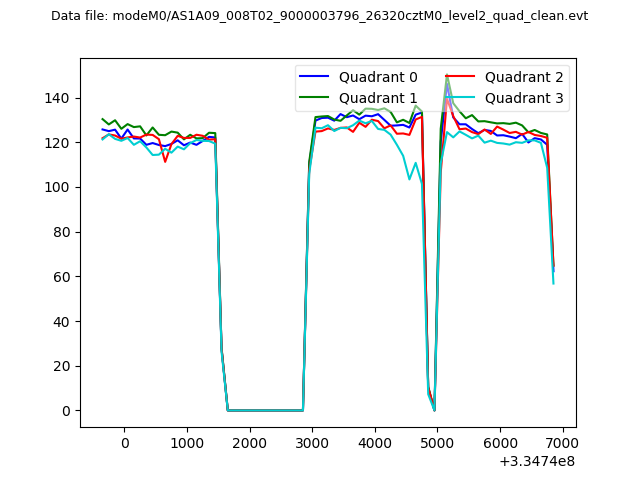
| Quadrant-wise count rates Data is divided into 100 sec bins |
 |
|
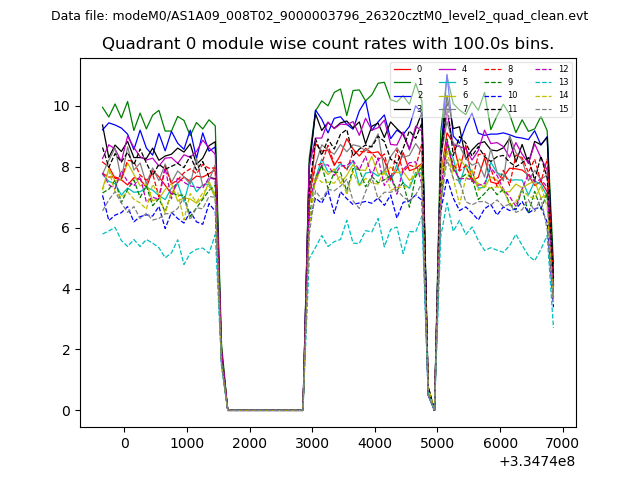
| Module-wise count rates for Quadrant A Data is divided into 100 sec bins |
 |
 |
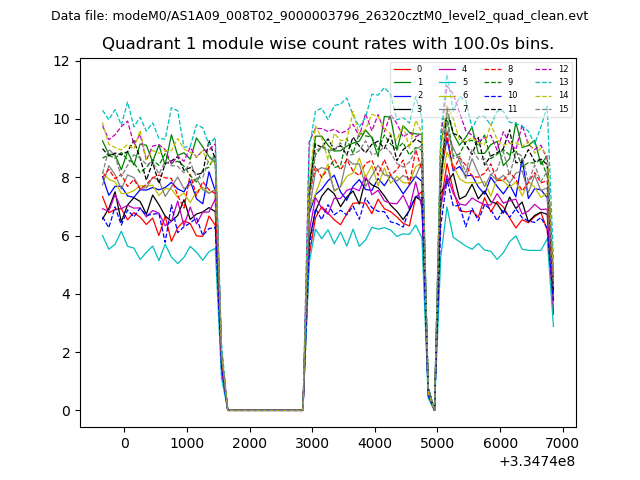
| Module-wise count rates for Quadrant B Data is divided into 100 sec bins |
 |
 |
| Module-wise count rates for Quadrant C Data is divided into 100 sec bins |
 |
 |
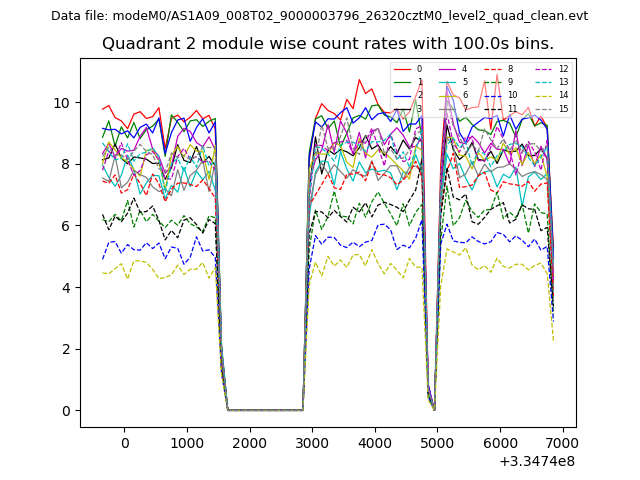
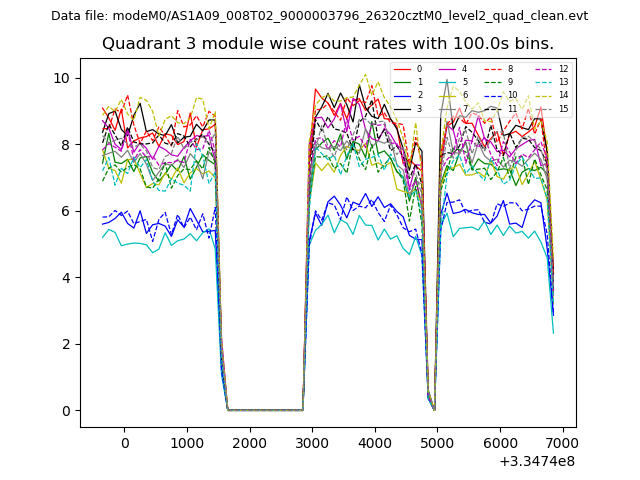
| Module-wise count rates for Quadrant D Data is divided into 100 sec bins |
 |
 |
| Parameter | Plot |
|---|---|
| CZT HV Monitor | 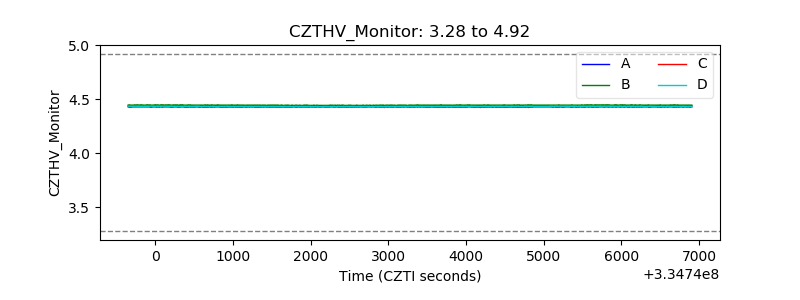 |
| D_VDD | 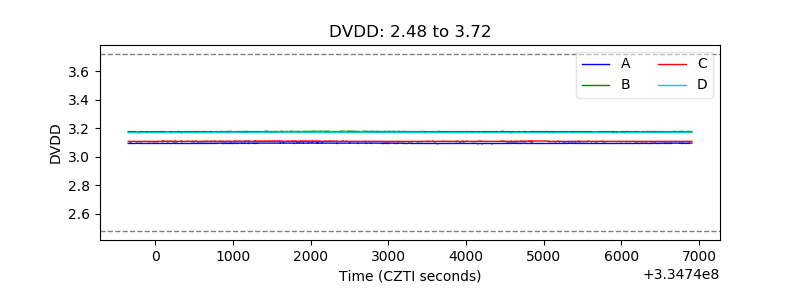 |
| Temperature 1 | 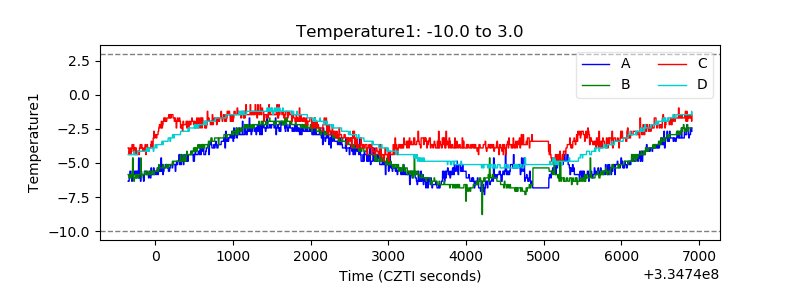 |
| Veto HV Monitor | 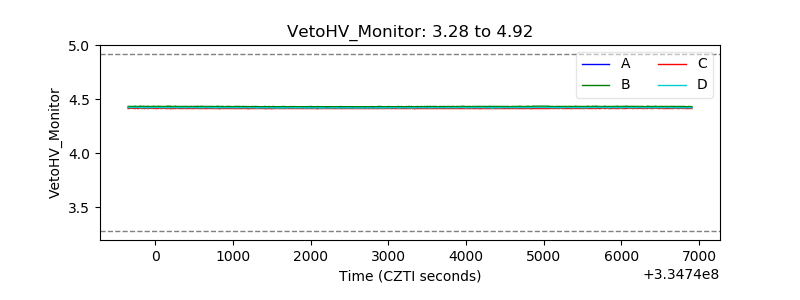 |
| Veto LLD | 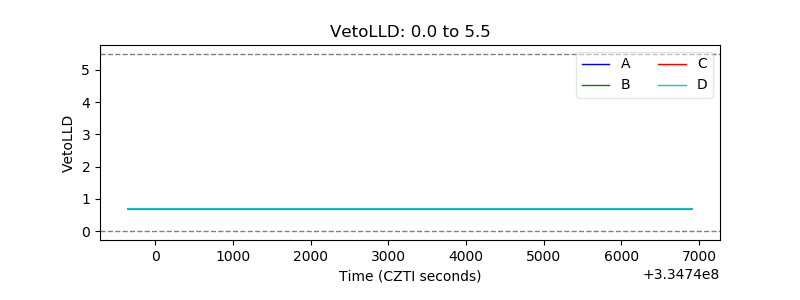 |
| Alpha Counter | 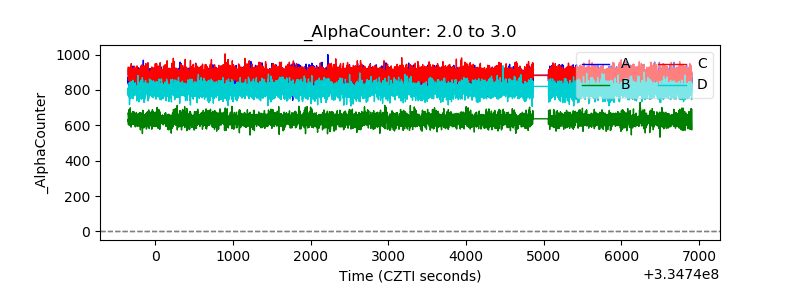 |
| _CPM_Rate | 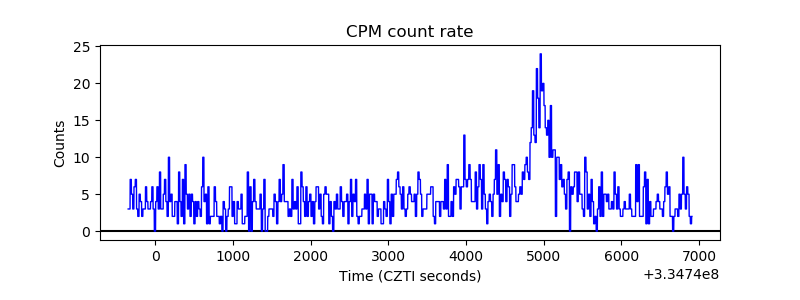 |
| CZT Counter |  |
| +2.5 Volts monitor |  |
| +5 Volts monitor |  |
| _ROLL_ROT | 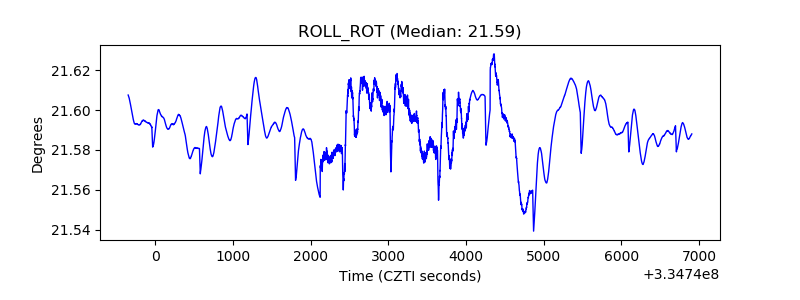 |
| _Roll_DEC | 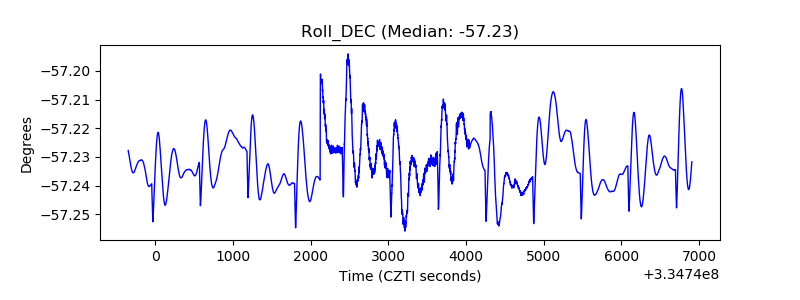 |
| _Roll_RA |  |
| Veto Counter | 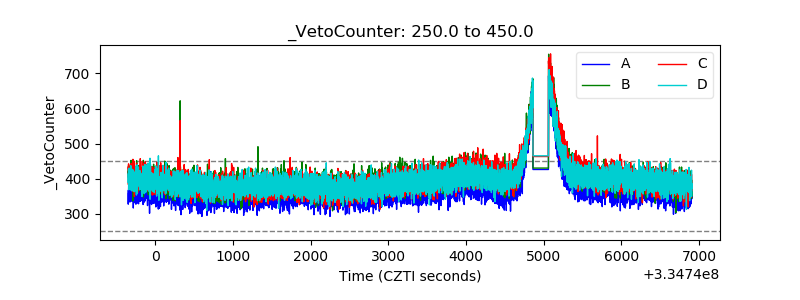 |