| Param | Original file | Final file |
|---|---|---|
| Filename | modeM0/AS1A09_008T02_9000003796_26323cztM0_level2.evt | modeM0/AS1A09_008T02_9000003796_26323cztM0_level2_quad_clean.evt |
| Size (bytes) | 1,109,295,360 | 187,139,520 |
| Size | 1.0 GB | 178.5 MB |
| Events in quadrant A | 6,073,368 | 1,214,012 |
| Events in quadrant B | 6,144,584 | 1,237,680 |
| Events in quadrant C | 9,390,874 | 1,169,576 |
| Events in quadrant D | 11,106,429 | 1,146,467 |
| Mode M0 | |||
|---|---|---|---|
| Quadrant | BADHDUFLAG | Total packets | Discarded packets |
| A | 0 | 26622 | 0 |
| B | 0 | 26728 | 0 |
| C | 0 | 36324 | 0 |
| D | 0 | 41847 | 0 |
| Mode M9 | |||
|---|---|---|---|
| Quadrant | BADHDUFLAG | Total packets | Discarded packets |
| A | 0 | 18 | 0 |
| B | 0 | 18 | 0 |
| C | 0 | 18 | 0 |
| D | 0 | 18 | 0 |
| Quadrant | Total seconds | Saturated seconds | Saturation percentage |
|---|---|---|---|
| A | 13026 | 254 | 1.949946% |
| B | 13027 | 286 | 2.195440% |
| C | 13026 | 1246 | 9.565484% |
| D | 13026 | 1642 | 12.605558% |
Noise dominated data is calculated using 1-second bins in cleaned event files. If a bin has >2000 counts, and if more than 50% of those come from <1% of pixels, then it is considered to be noise-dominated and hence unusable.
| Quadrant | # 1 sec bins | Bins with >0 counts | Bins with >2000 counts | High rate bins dominated by noise | Noise dominated (total time) | Noise dominated (detector-on time) | Marked lightcurve |
|---|---|---|---|---|---|---|---|
| A | 14711 | 13029 | 0 | 0 | 0.00% | 0.00% | 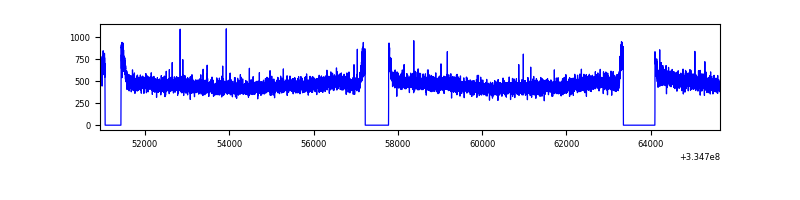 |
| B | 14712 | 13030 | 1 | 1 | 0.01% | 0.01% | 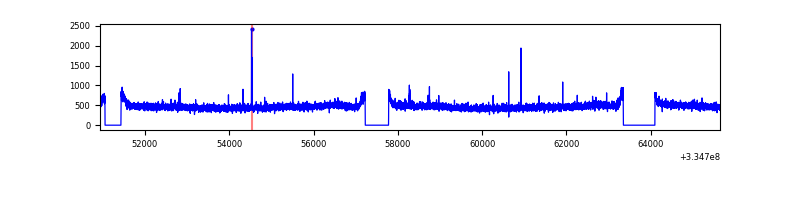 |
| C | 14711 | 13029 | 542 | 542 | 3.68% | 4.16% | 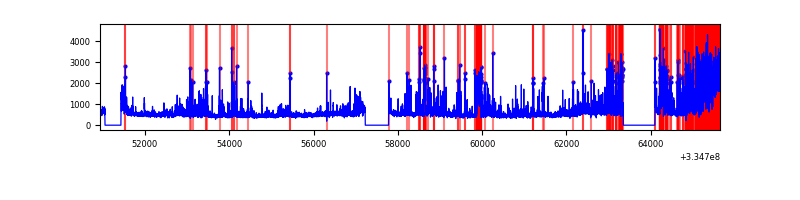 |
| D | 14711 | 13029 | 1180 | 1180 | 8.02% | 9.06% | 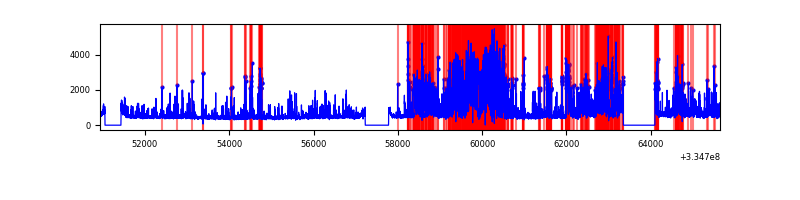 |
Top three noisy pixels from each quadrant. If the there are fewer than three noisy pixels in the level2.evt file, extra rows are filled as -1
| Pixel properties | Quadrant properties | ||||||
|---|---|---|---|---|---|---|---|
| Quadrant | DetID | PixID | Counts | Sigma | Mean | Median | Sigma |
| A | 13 | 254 | 20349 | 59.51 | 1573 | 1534 | 316.2 |
| A | 3 | 137 | 14967 | 42.49 | 1573 | 1534 | 316.2 |
| A | 0 | 226 | 13296 | 37.2 | 1573 | 1534 | 316.2 |
| B | 12 | 111 | 37280 | 120.44 | 1559 | 1516 | 296.9 |
| B | 11 | 111 | 33810 | 108.76 | 1559 | 1516 | 296.9 |
| B | 14 | 111 | 29525 | 94.33 | 1559 | 1516 | 296.9 |
| C | 4 | 254 | 2046898 | 5994.53 | 1469 | 1479 | 341.2 |
| C | 3 | 233 | 724373 | 2118.59 | 1469 | 1479 | 341.2 |
| C | 2 | 16 | 655102 | 1915.58 | 1469 | 1479 | 341.2 |
| D | 1 | 52 | 3282212 | 9494.43 | 1464 | 1424 | 345.5 |
| D | 12 | 233 | 2021623 | 5846.35 | 1464 | 1424 | 345.5 |
| D | 11 | 176 | 214762 | 617.39 | 1464 | 1424 | 345.5 |
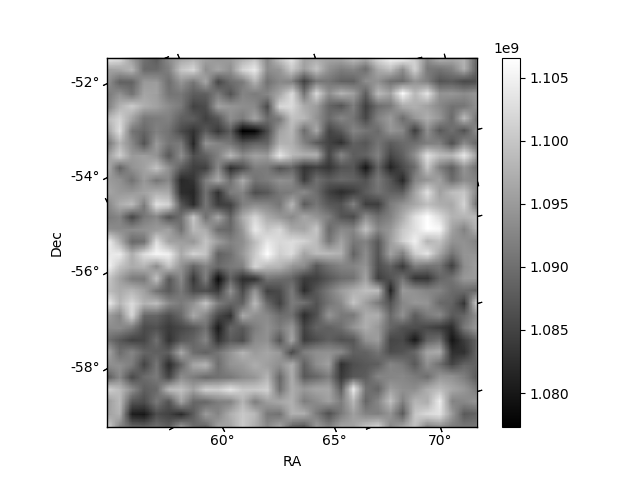
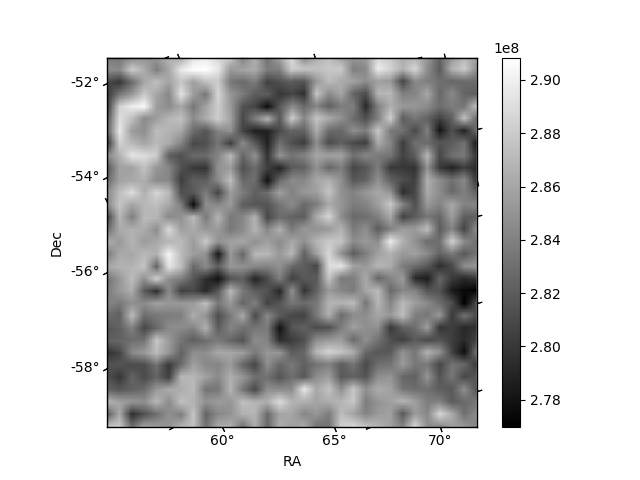
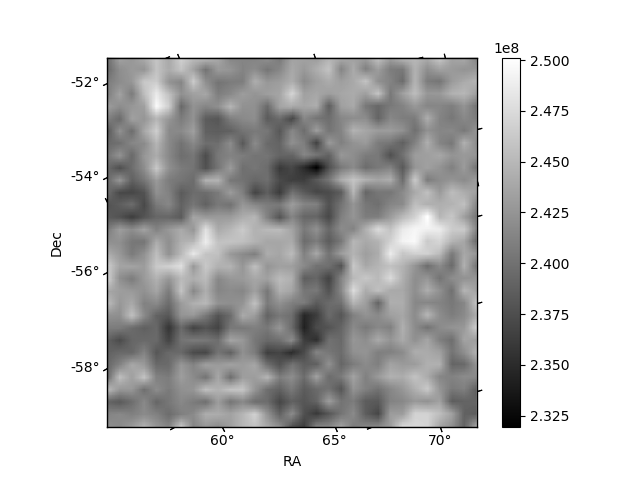
Histogram calculated using DETX and DETY for each event in the final _common_clean file
| Quadrant A | 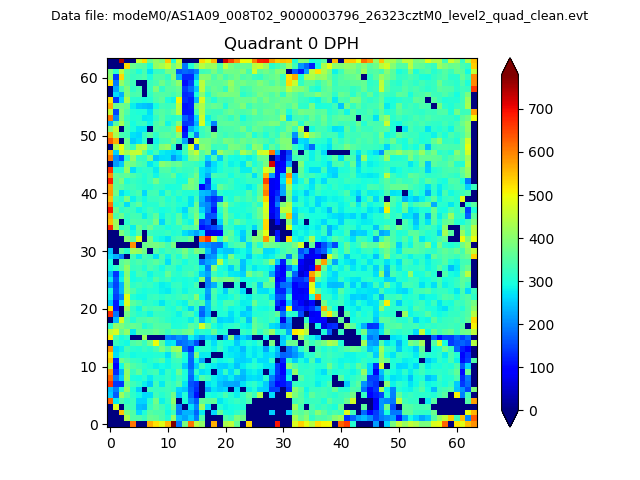 |
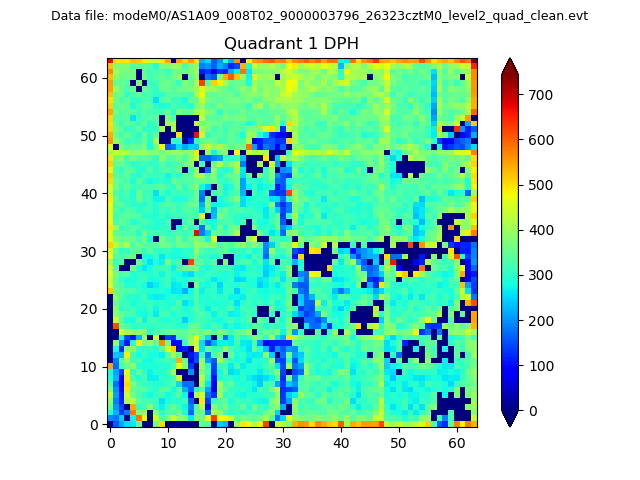 |
Quadrant B |
|---|---|---|---|
| Quadrant D | 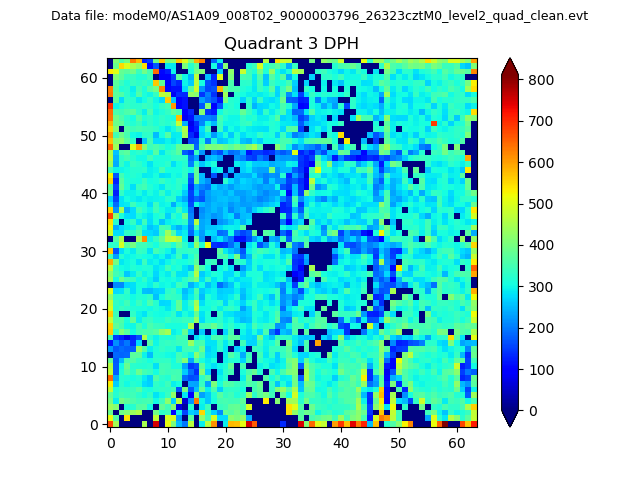 |
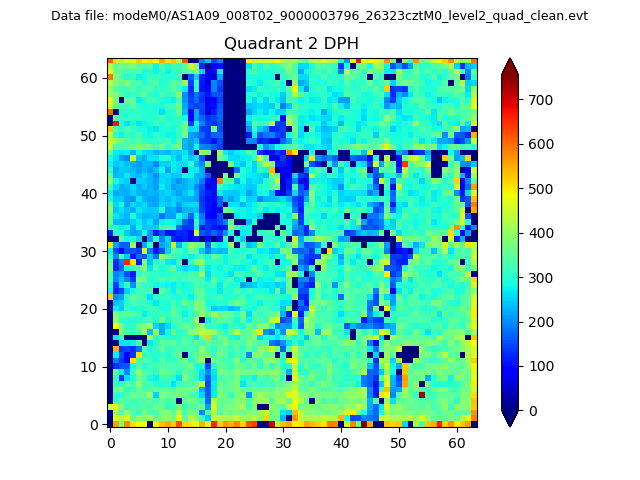 |
Quadrant C |
| Plot type | Count rate plots | Images |
|---|---|---|
| Comparison with Poisson distribution Blue bars denote a histogram of data divided into 1 sec bins. Red curve is a Poisson curve with rate = median count rate of data. |
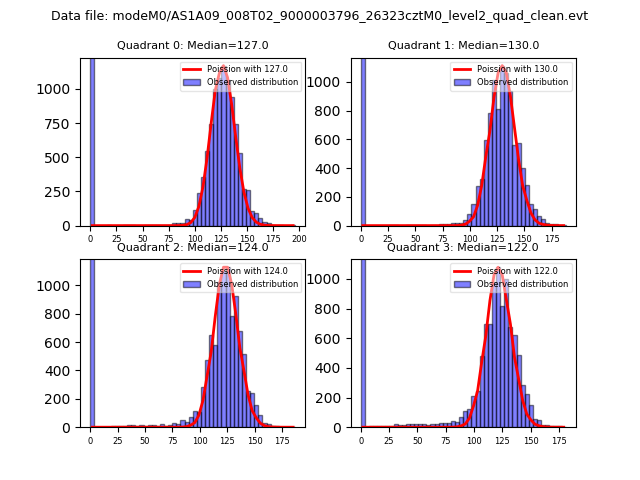 |
 |
| Quadrant-wise count rates Data is divided into 100 sec bins |
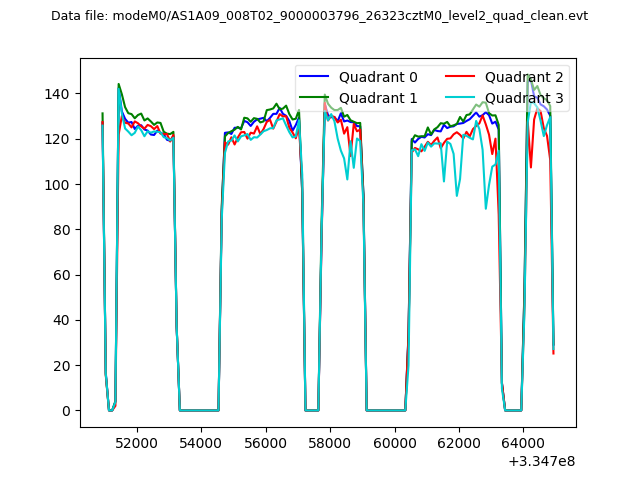 |
|
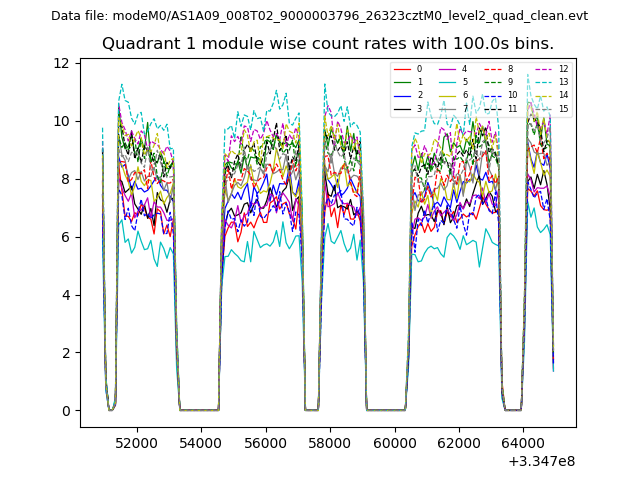
| Module-wise count rates for Quadrant A Data is divided into 100 sec bins |
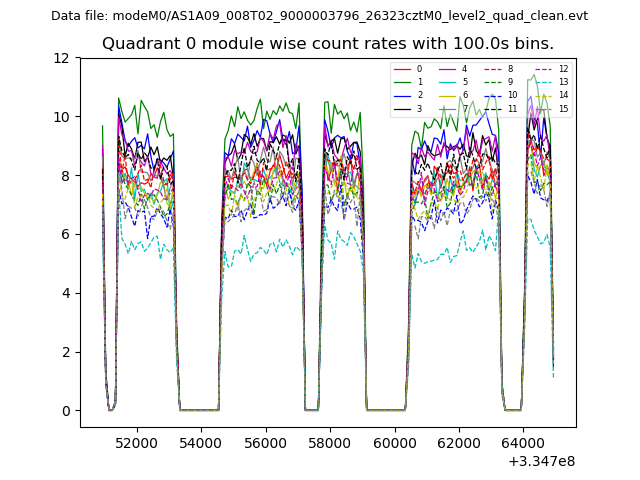 |
 |
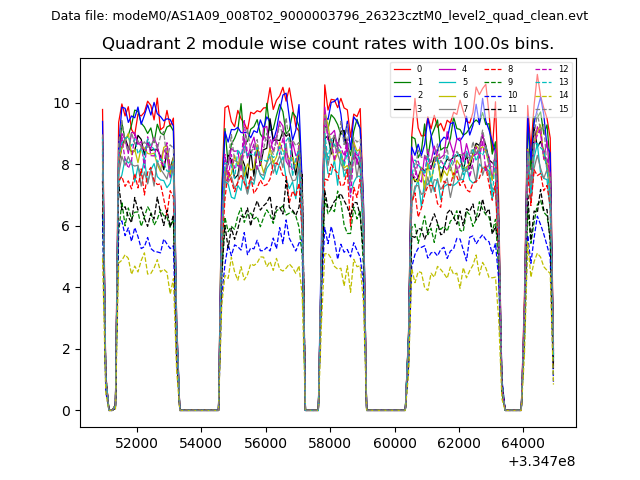
| Module-wise count rates for Quadrant B Data is divided into 100 sec bins |
 |
 |
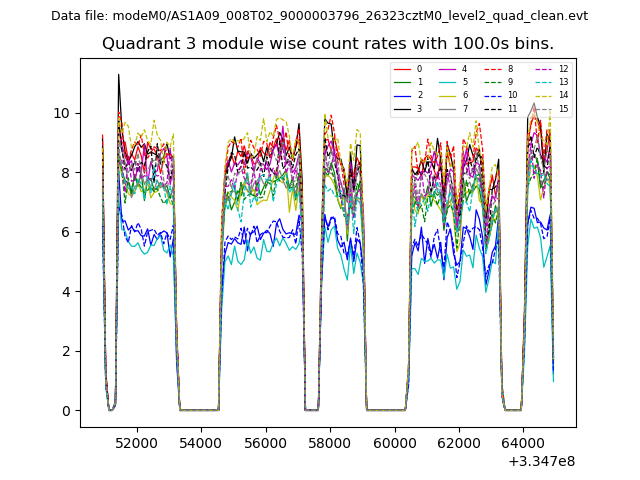
| Module-wise count rates for Quadrant C Data is divided into 100 sec bins |
 |
 |
| Module-wise count rates for Quadrant D Data is divided into 100 sec bins |
 |
 |
| Parameter | Plot |
|---|---|
| CZT HV Monitor | 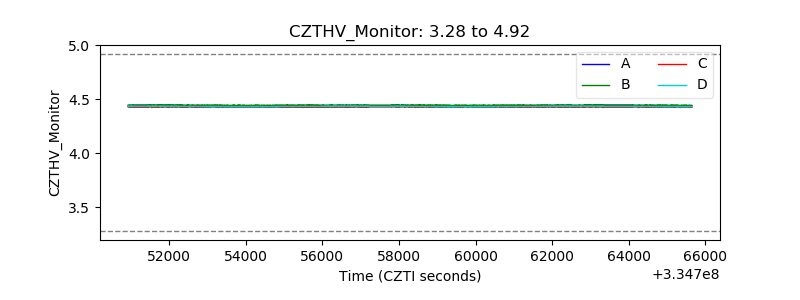 |
| D_VDD | 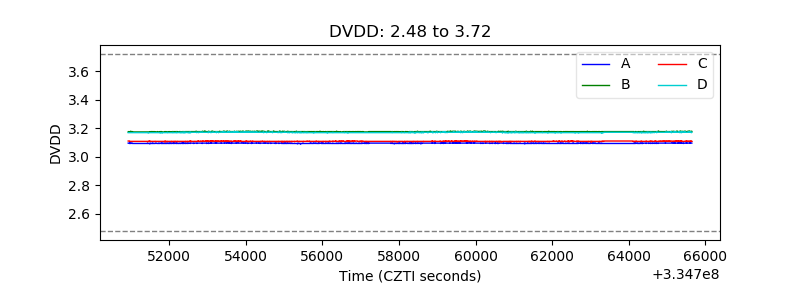 |
| Temperature 1 | 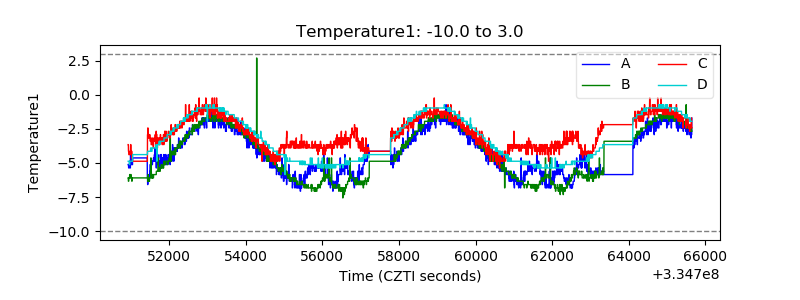 |
| Veto HV Monitor | 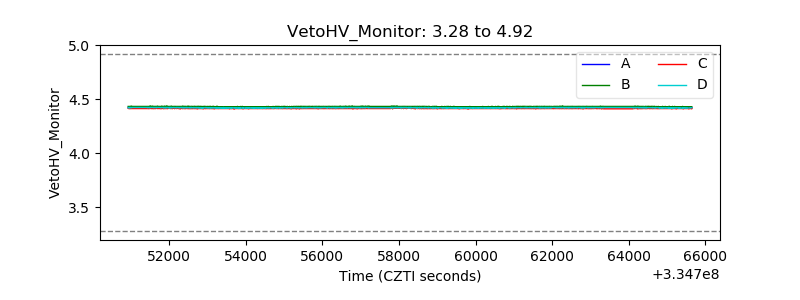 |
| Veto LLD | 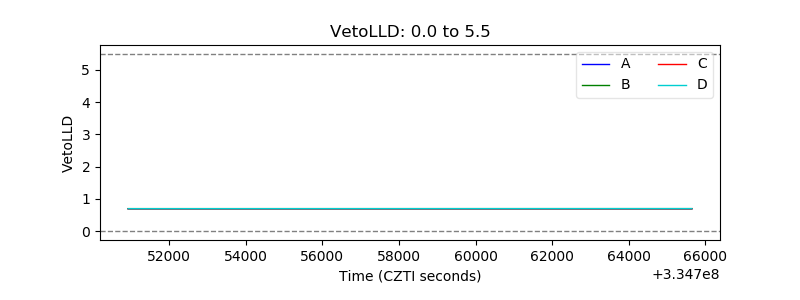 |
| Alpha Counter | 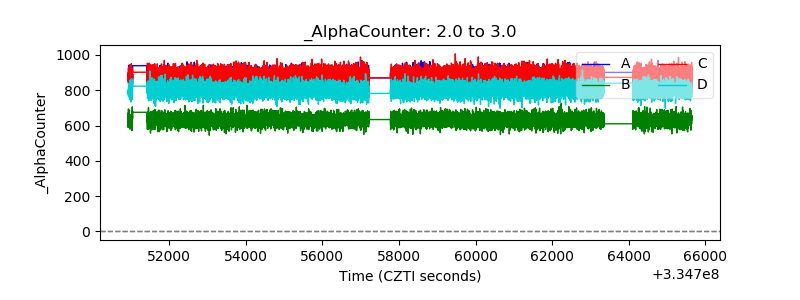 |
| _CPM_Rate | 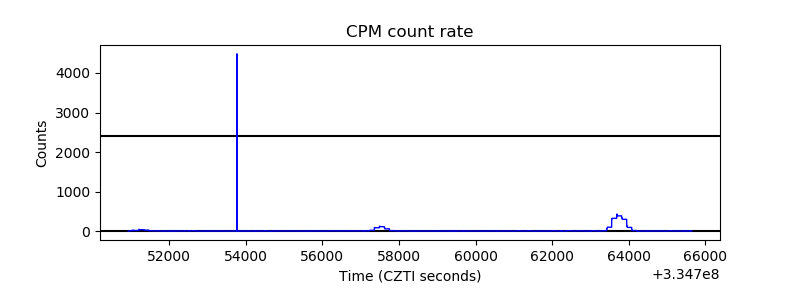 |
| CZT Counter | 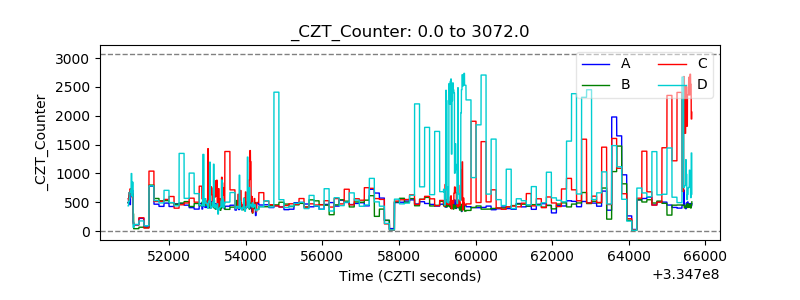 |
| +2.5 Volts monitor |  |
| +5 Volts monitor |  |
| _ROLL_ROT | 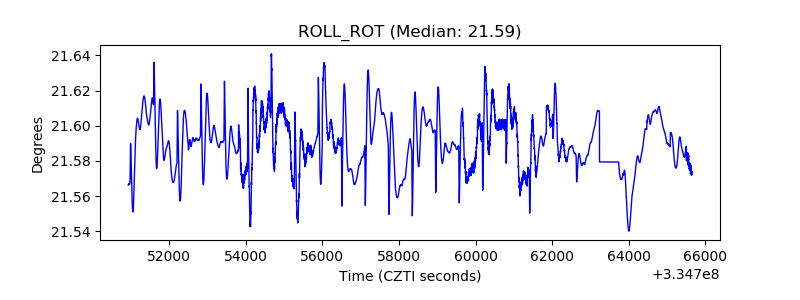 |
| _Roll_DEC | 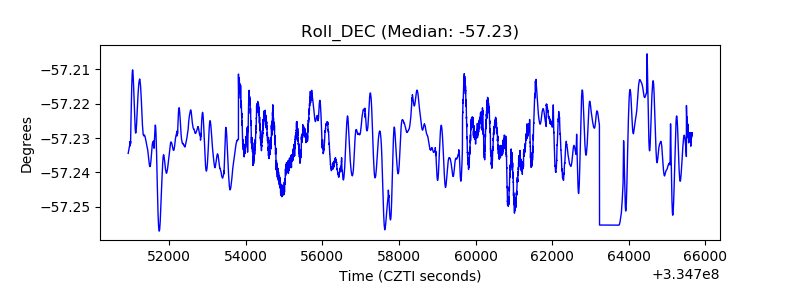 |
| _Roll_RA | 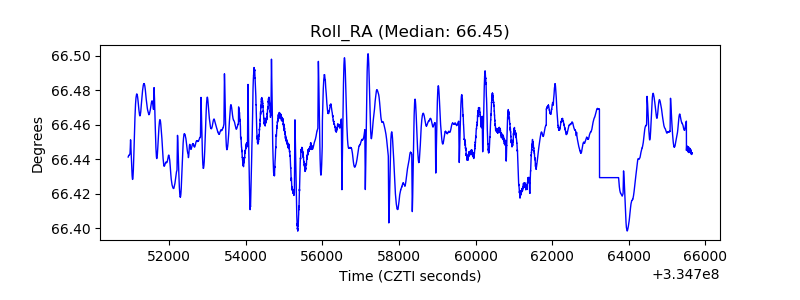 |
| Veto Counter | 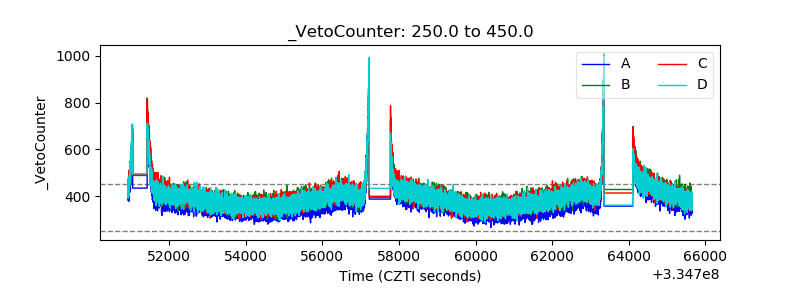 |