| Param | Original file | Final file |
|---|---|---|
| Filename | modeM0/AS1A09_008T02_9000003796_26324cztM0_level2.evt | modeM0/AS1A09_008T02_9000003796_26324cztM0_level2_quad_clean.evt |
| Size (bytes) | 659,260,800 | 70,989,120 |
| Size | 628.7 MB | 67.7 MB |
| Events in quadrant A | 2,805,419 | 467,520 |
| Events in quadrant B | 2,832,944 | 473,002 |
| Events in quadrant C | 9,227,558 | 350,999 |
| Events in quadrant D | 4,695,462 | 440,389 |
| Mode M0 | |||
|---|---|---|---|
| Quadrant | BADHDUFLAG | Total packets | Discarded packets |
| A | 0 | 12268 | 0 |
| B | 0 | 12282 | 0 |
| C | 0 | 31467 | 0 |
| D | 0 | 17973 | 0 |
| Mode M9 | |||
|---|---|---|---|
| Quadrant | BADHDUFLAG | Total packets | Discarded packets |
| A | 0 | 10 | 0 |
| B | 0 | 10 | 0 |
| C | 0 | 10 | 0 |
| D | 0 | 10 | 0 |
| Quadrant | Total seconds | Saturated seconds | Saturation percentage |
|---|---|---|---|
| A | 5971 | 47 | 0.787138% |
| B | 5970 | 58 | 0.971524% |
| C | 5970 | 2871 | 48.090452% |
| D | 5970 | 491 | 8.224456% |
Noise dominated data is calculated using 1-second bins in cleaned event files. If a bin has >2000 counts, and if more than 50% of those come from <1% of pixels, then it is considered to be noise-dominated and hence unusable.
| Quadrant | # 1 sec bins | Bins with >0 counts | Bins with >2000 counts | High rate bins dominated by noise | Noise dominated (total time) | Noise dominated (detector-on time) | Marked lightcurve |
|---|---|---|---|---|---|---|---|
| A | 6876 | 5972 | 0 | 0 | 0.00% | 0.00% | 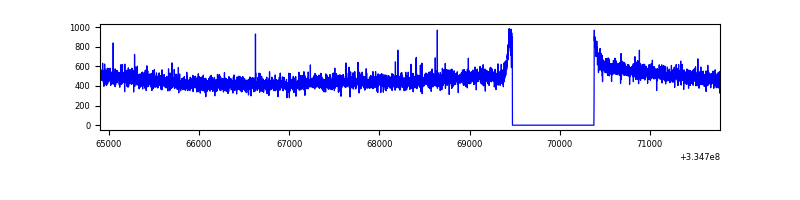 |
| B | 6875 | 5971 | 1 | 1 | 0.01% | 0.02% | 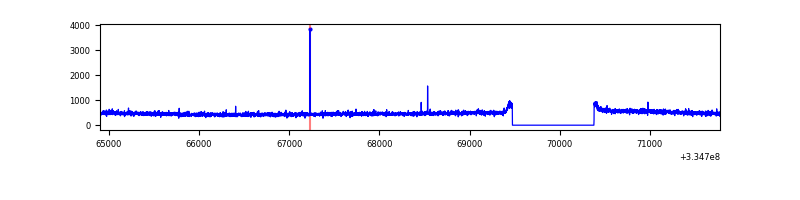 |
| C | 6875 | 5971 | 1989 | 1989 | 28.93% | 33.31% | 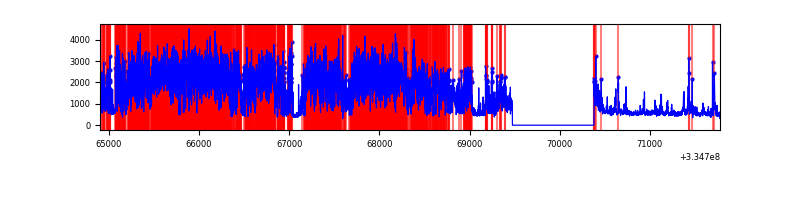 |
| D | 6875 | 5971 | 337 | 337 | 4.90% | 5.64% | 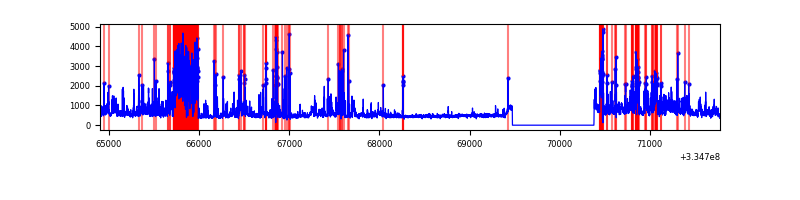 |
Top three noisy pixels from each quadrant. If the there are fewer than three noisy pixels in the level2.evt file, extra rows are filled as -1
| Pixel properties | Quadrant properties | ||||||
|---|---|---|---|---|---|---|---|
| Quadrant | DetID | PixID | Counts | Sigma | Mean | Median | Sigma |
| A | 13 | 254 | 9008 | 56.94 | 725 | 708 | 145.8 |
| A | 3 | 137 | 6804 | 41.82 | 725 | 708 | 145.8 |
| A | 0 | 226 | 6329 | 38.56 | 725 | 708 | 145.8 |
| B | 12 | 111 | 16409 | 115.07 | 718 | 700 | 136.5 |
| B | 11 | 111 | 14750 | 102.92 | 718 | 700 | 136.5 |
| B | 14 | 111 | 13135 | 91.09 | 718 | 700 | 136.5 |
| C | 4 | 254 | 6628873 | 50253.56 | 561 | 564 | 131.9 |
| C | 3 | 233 | 262110 | 1982.95 | 561 | 564 | 131.9 |
| C | 14 | 238 | 87238 | 657.13 | 561 | 564 | 131.9 |
| D | 12 | 233 | 1157739 | 7064.27 | 678 | 658 | 163.8 |
| D | 1 | 52 | 746563 | 4553.93 | 678 | 658 | 163.8 |
| D | 11 | 176 | 212651 | 1294.27 | 678 | 658 | 163.8 |
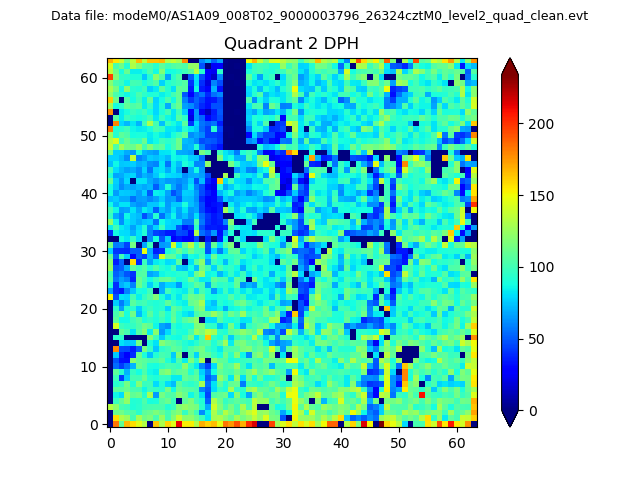
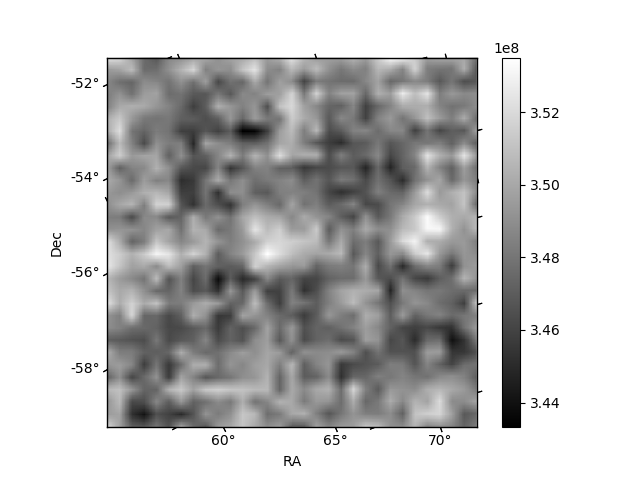
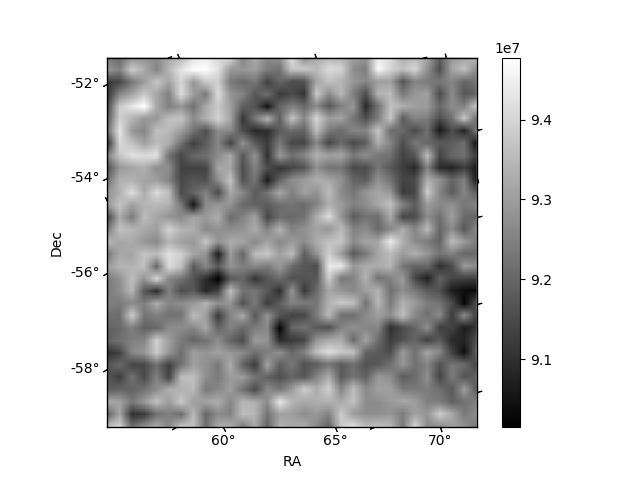
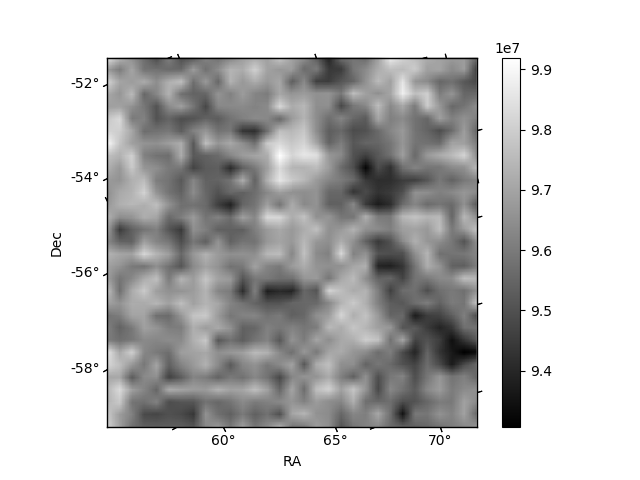
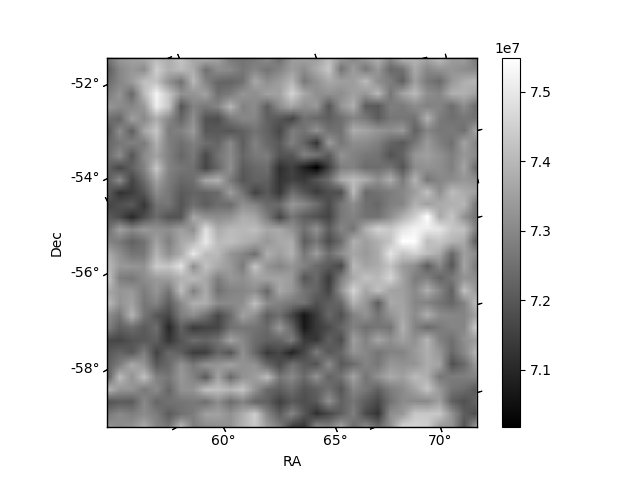
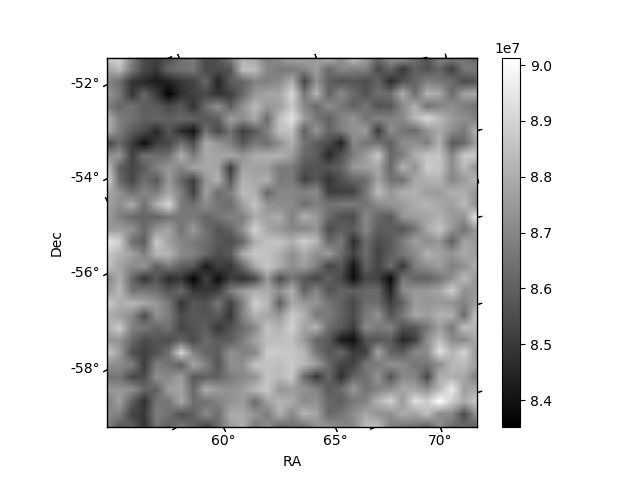
Histogram calculated using DETX and DETY for each event in the final _common_clean file
| Quadrant A | 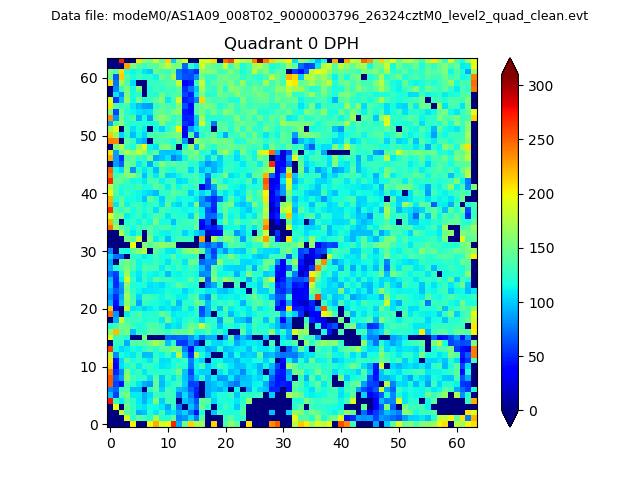 |
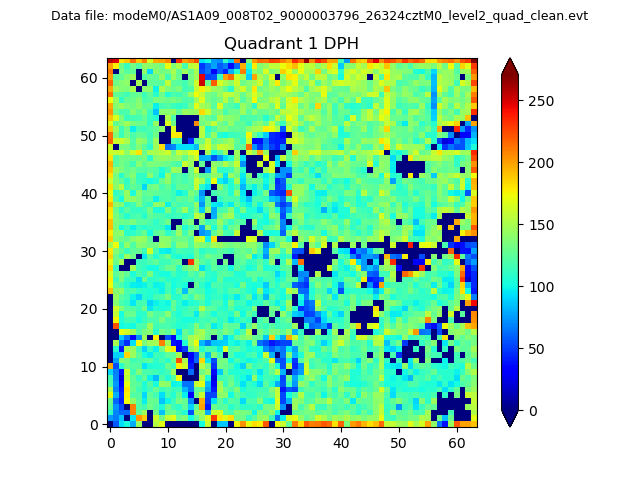 |
Quadrant B |
|---|---|---|---|
| Quadrant D | 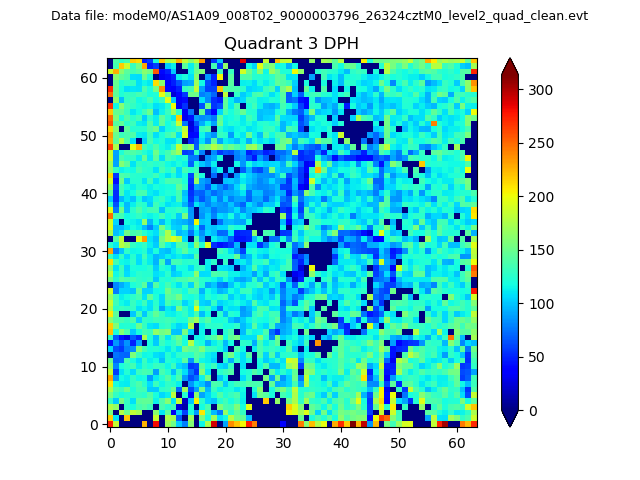 |
 |
Quadrant C |
| Plot type | Count rate plots | Images |
|---|---|---|
| Comparison with Poisson distribution Blue bars denote a histogram of data divided into 1 sec bins. Red curve is a Poisson curve with rate = median count rate of data. |
 |
 |
| Quadrant-wise count rates Data is divided into 100 sec bins |
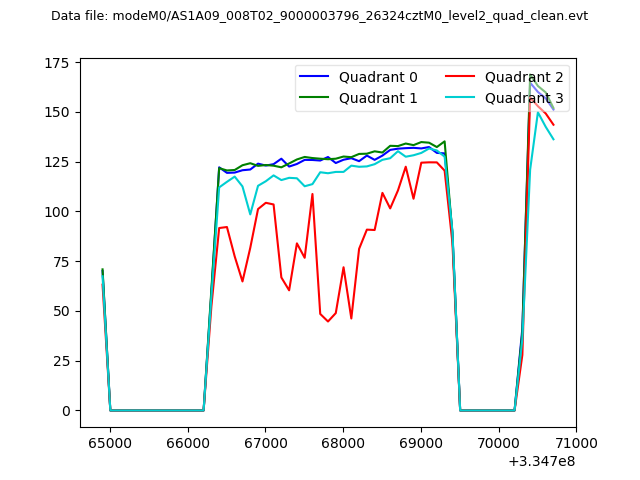 |
|
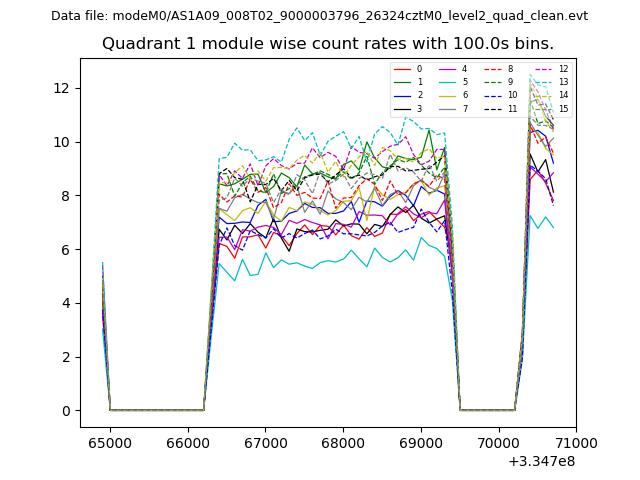
| Module-wise count rates for Quadrant A Data is divided into 100 sec bins |
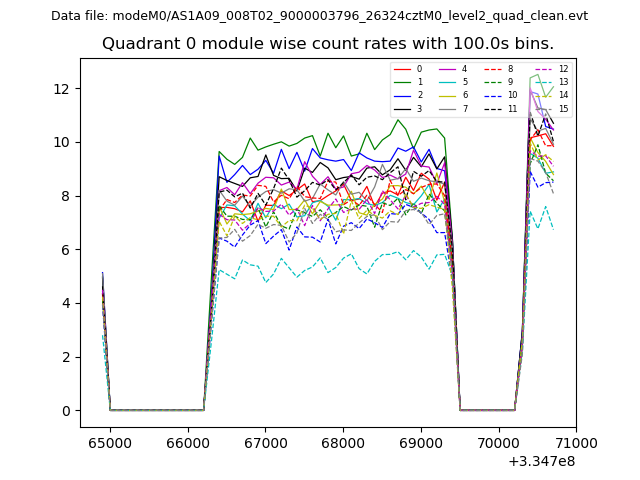 |
 |
| Module-wise count rates for Quadrant B Data is divided into 100 sec bins |
 |
 |
| Module-wise count rates for Quadrant C Data is divided into 100 sec bins |
 |
 |
| Module-wise count rates for Quadrant D Data is divided into 100 sec bins |
 |
 |
| Parameter | Plot |
|---|---|
| CZT HV Monitor | 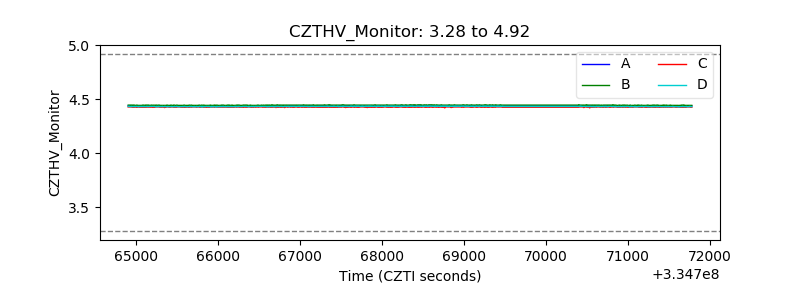 |
| D_VDD | 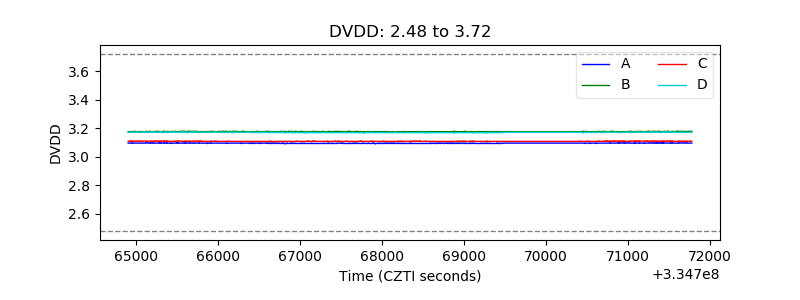 |
| Temperature 1 | 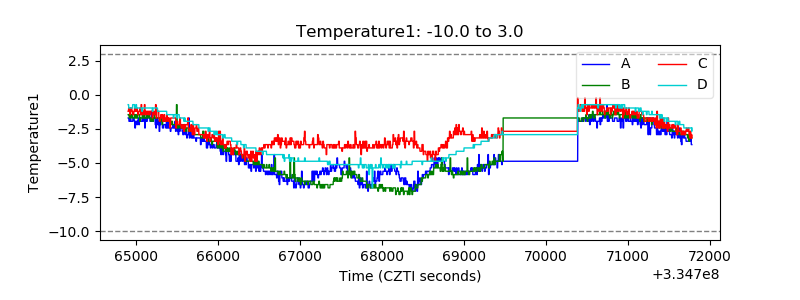 |
| Veto HV Monitor | 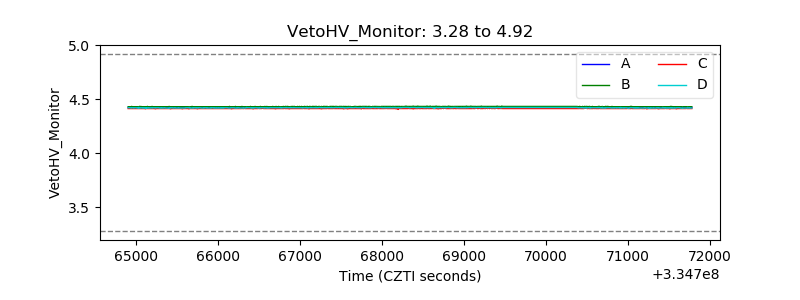 |
| Veto LLD |  |
| Alpha Counter | 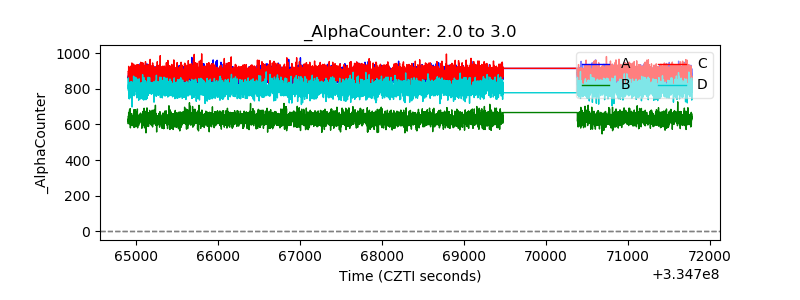 |
| _CPM_Rate | 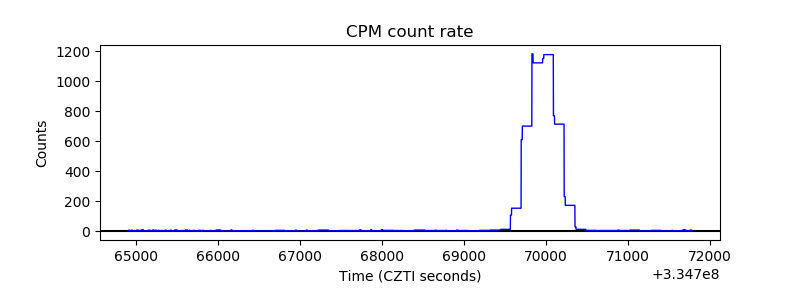 |
| CZT Counter | 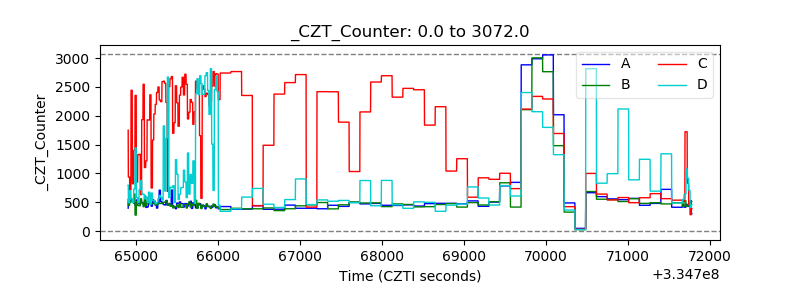 |
| +2.5 Volts monitor |  |
| +5 Volts monitor |  |
| _ROLL_ROT | 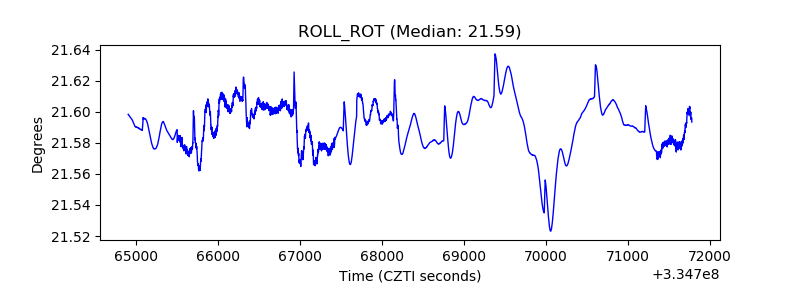 |
| _Roll_DEC | 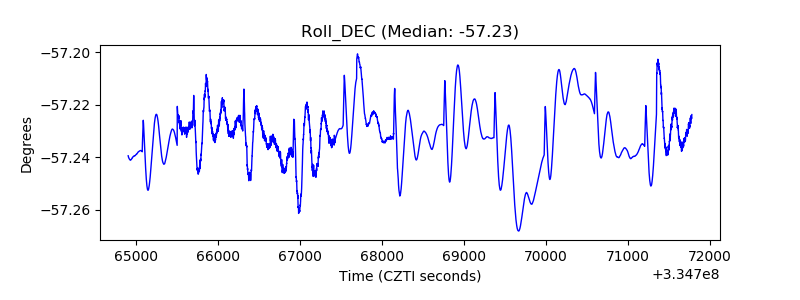 |
| _Roll_RA | 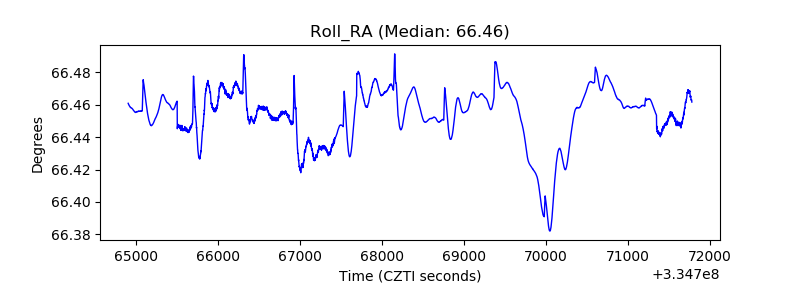 |
| Veto Counter | 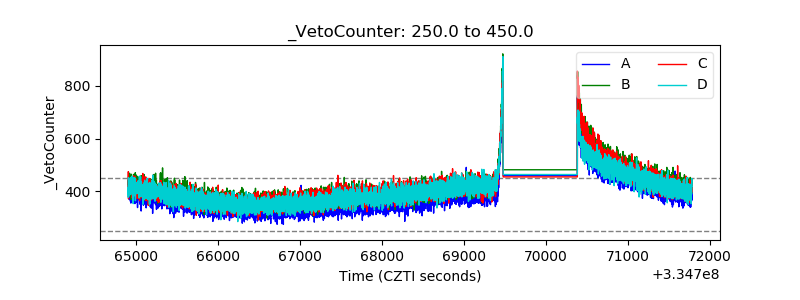 |