| Param | Original file | Final file |
|---|---|---|
| Filename | modeM0/AS1A09_008T02_9000003796_26327cztM0_level2.evt | modeM0/AS1A09_008T02_9000003796_26327cztM0_level2_quad_clean.evt |
| Size (bytes) | 541,895,040 | 83,986,560 |
| Size | 516.8 MB | 80.1 MB |
| Events in quadrant A | 3,255,963 | 536,044 |
| Events in quadrant B | 3,254,839 | 549,163 |
| Events in quadrant C | 3,746,329 | 514,073 |
| Events in quadrant D | 5,727,223 | 504,279 |
| Mode M0 | |||
|---|---|---|---|
| Quadrant | BADHDUFLAG | Total packets | Discarded packets |
| A | 0 | 13936 | 0 |
| B | 0 | 13819 | 0 |
| C | 0 | 15136 | 0 |
| D | 0 | 21468 | 0 |
| Mode M9 | |||
|---|---|---|---|
| Quadrant | BADHDUFLAG | Total packets | Discarded packets |
| A | 0 | 14 | 0 |
| B | 0 | 15 | 0 |
| C | 0 | 15 | 0 |
| D | 0 | 15 | 0 |
| Quadrant | Total seconds | Saturated seconds | Saturation percentage |
|---|---|---|---|
| A | 6301 | 45 | 0.714172% |
| B | 6300 | 59 | 0.936508% |
| C | 6300 | 214 | 3.396825% |
| D | 6300 | 655 | 10.396825% |
Noise dominated data is calculated using 1-second bins in cleaned event files. If a bin has >2000 counts, and if more than 50% of those come from <1% of pixels, then it is considered to be noise-dominated and hence unusable.
| Quadrant | # 1 sec bins | Bins with >0 counts | Bins with >2000 counts | High rate bins dominated by noise | Noise dominated (total time) | Noise dominated (detector-on time) | Marked lightcurve |
|---|---|---|---|---|---|---|---|
| A | 7475 | 6301 | 0 | 0 | 0.00% | 0.00% | 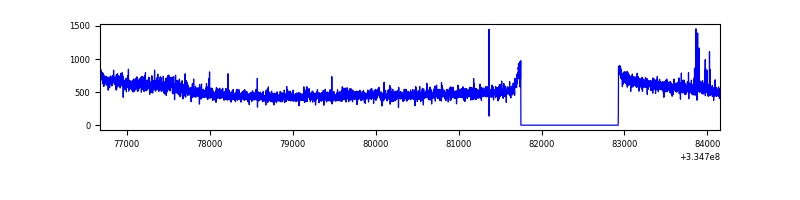 |
| B | 7474 | 6300 | 0 | 0 | 0.00% | 0.00% | 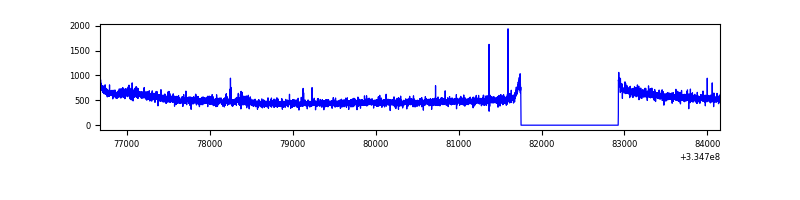 |
| C | 7474 | 6300 | 88 | 88 | 1.18% | 1.40% | 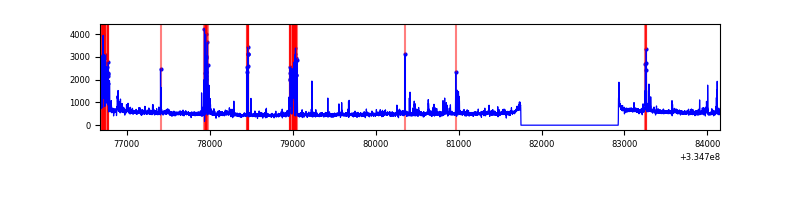 |
| D | 7474 | 6300 | 502 | 502 | 6.72% | 7.97% | 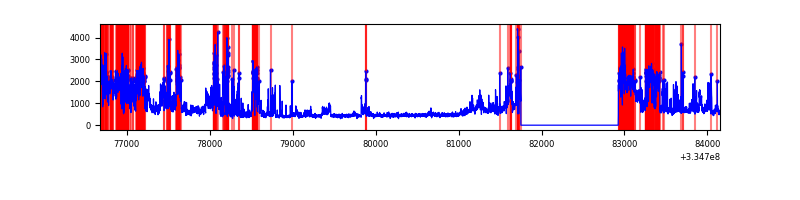 |
Top three noisy pixels from each quadrant. If the there are fewer than three noisy pixels in the level2.evt file, extra rows are filled as -1
| Pixel properties | Quadrant properties | ||||||
|---|---|---|---|---|---|---|---|
| Quadrant | DetID | PixID | Counts | Sigma | Mean | Median | Sigma |
| A | 6 | 16 | 53052 | 318.99 | 823 | 805 | 163.8 |
| A | 4 | 2 | 20657 | 121.21 | 823 | 805 | 163.8 |
| A | 13 | 254 | 10317 | 58.08 | 823 | 805 | 163.8 |
| B | 0 | 230 | 47445 | 306.76 | 822 | 804 | 152.0 |
| B | 12 | 111 | 17891 | 112.38 | 822 | 804 | 152.0 |
| B | 11 | 111 | 15806 | 98.67 | 822 | 804 | 152.0 |
| C | 3 | 233 | 480666 | 2697.18 | 775 | 782 | 177.9 |
| C | 14 | 238 | 127542 | 712.45 | 775 | 782 | 177.9 |
| C | 0 | 207 | 100795 | 562.12 | 775 | 782 | 177.9 |
| D | 1 | 52 | 2782229 | 15368.92 | 760 | 740 | 181.0 |
| D | 11 | 176 | 35531 | 192.23 | 760 | 740 | 181.0 |
| D | 2 | 234 | 28075 | 151.03 | 760 | 740 | 181.0 |
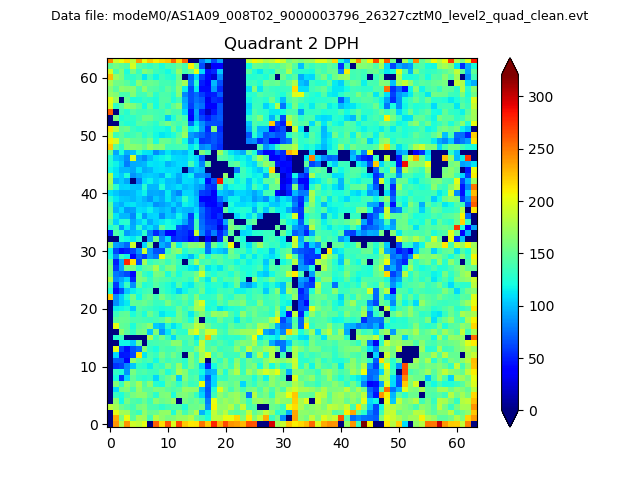
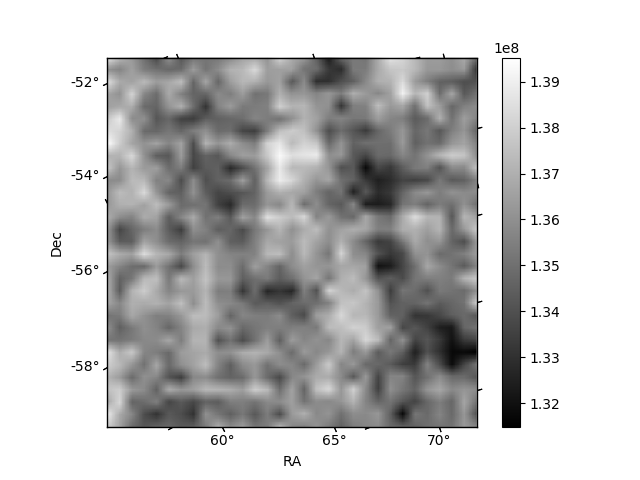
Histogram calculated using DETX and DETY for each event in the final _common_clean file
| Quadrant A |  |
 |
Quadrant B |
|---|---|---|---|
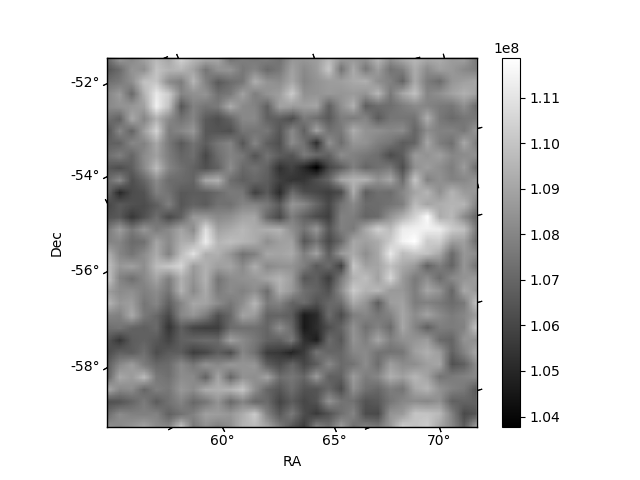
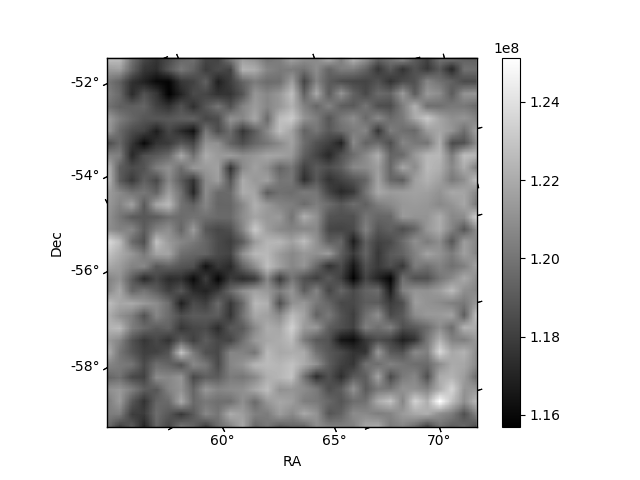
| Quadrant D | 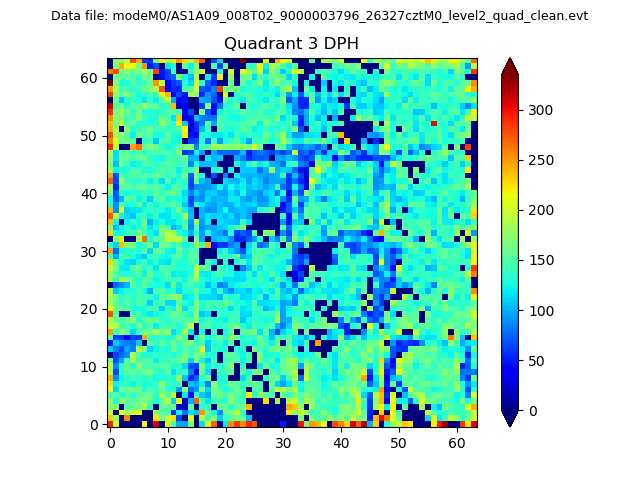 |
 |
Quadrant C |
| Plot type | Count rate plots | Images |
|---|---|---|
| Comparison with Poisson distribution Blue bars denote a histogram of data divided into 1 sec bins. Red curve is a Poisson curve with rate = median count rate of data. |
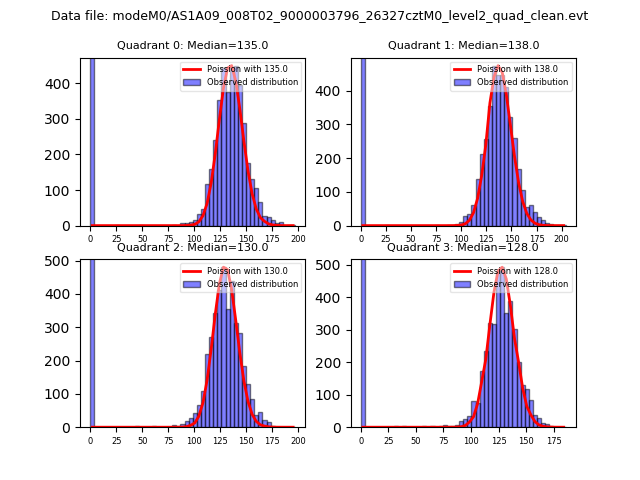 |
 |
| Quadrant-wise count rates Data is divided into 100 sec bins |
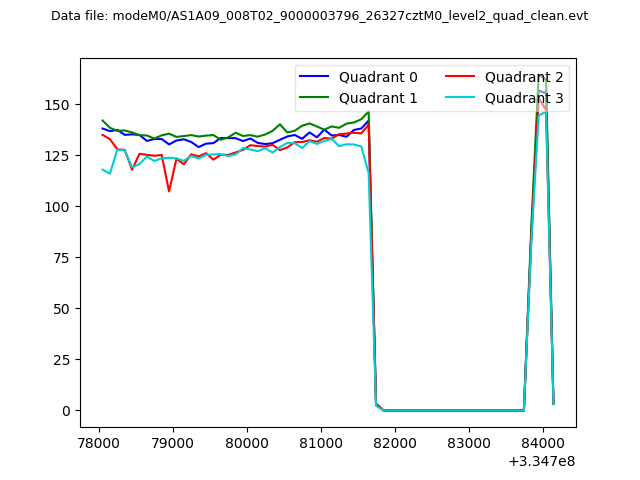 |
|
| Module-wise count rates for Quadrant A Data is divided into 100 sec bins |
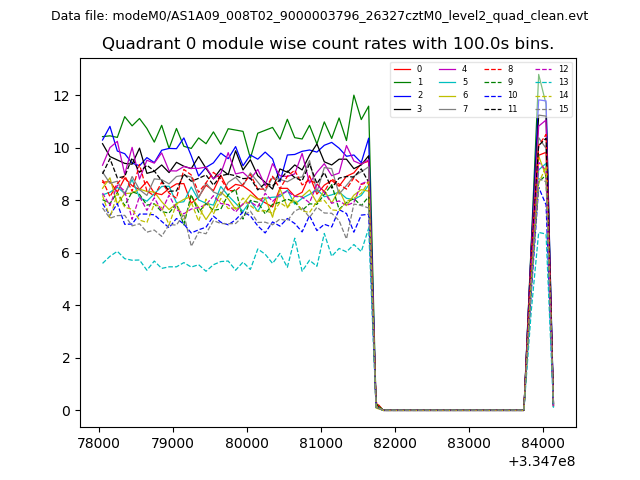 |
 |
| Module-wise count rates for Quadrant B Data is divided into 100 sec bins |
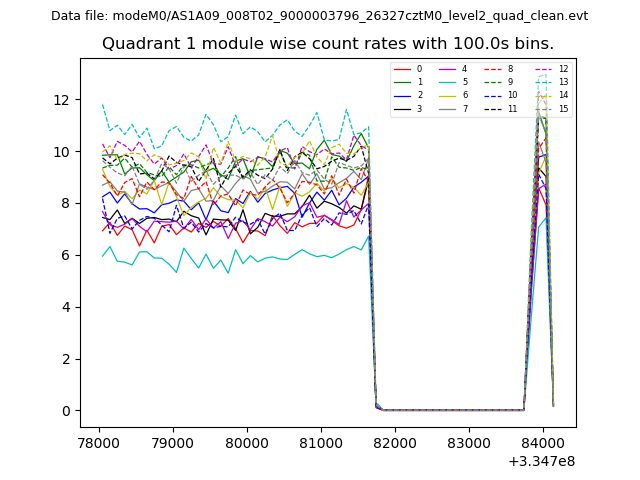 |
 |
| Module-wise count rates for Quadrant C Data is divided into 100 sec bins |
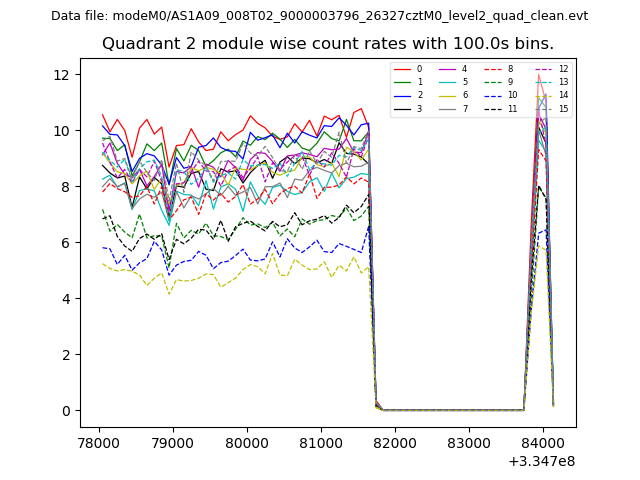 |
 |
| Module-wise count rates for Quadrant D Data is divided into 100 sec bins |
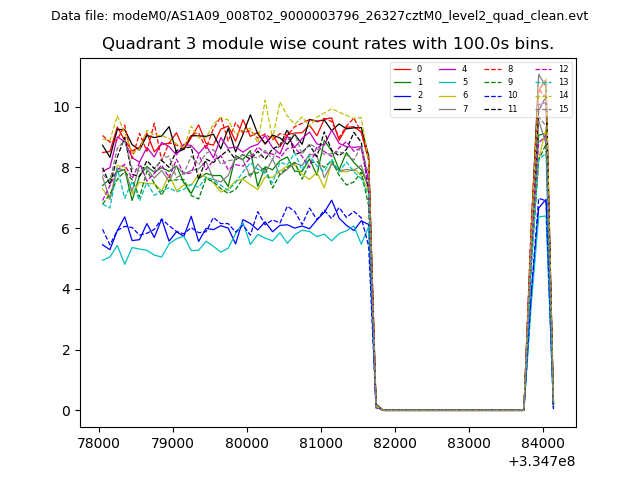 |
 |
| Parameter | Plot |
|---|---|
| CZT HV Monitor | 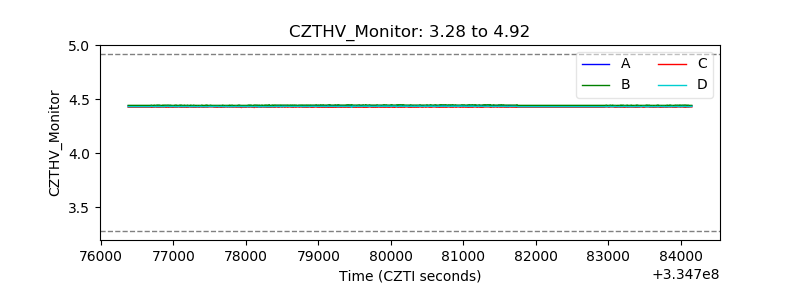 |
| D_VDD | 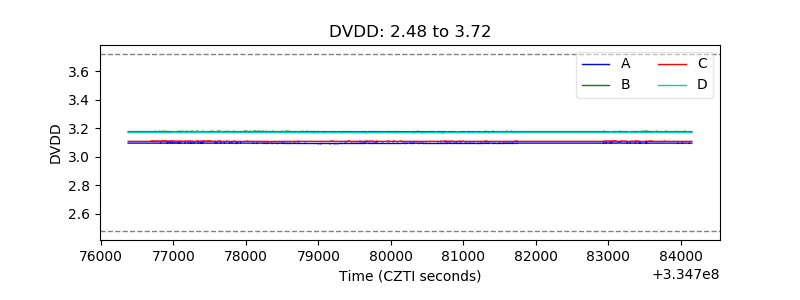 |
| Temperature 1 | 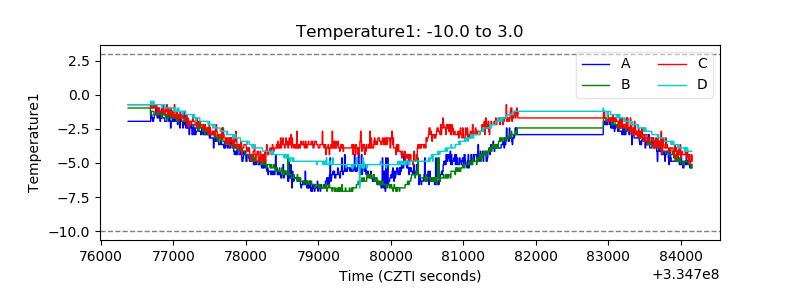 |
| Veto HV Monitor | 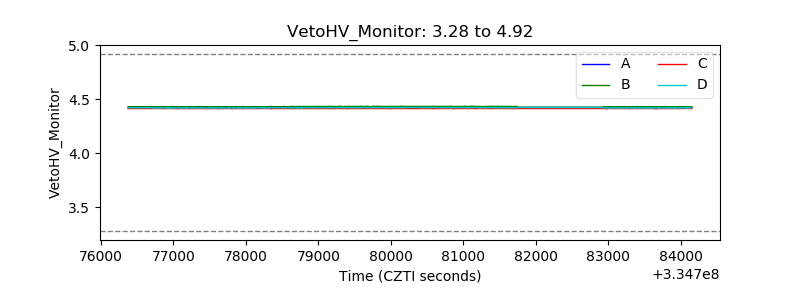 |
| Veto LLD | 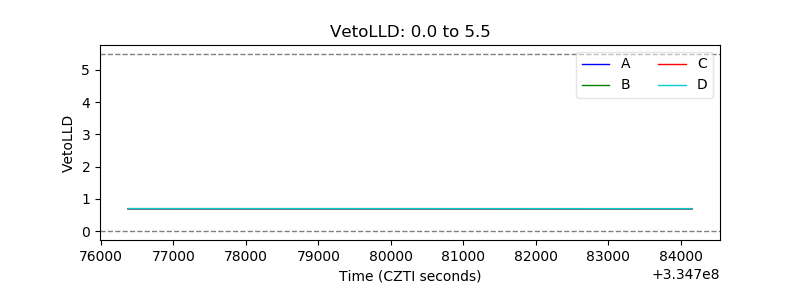 |
| Alpha Counter | 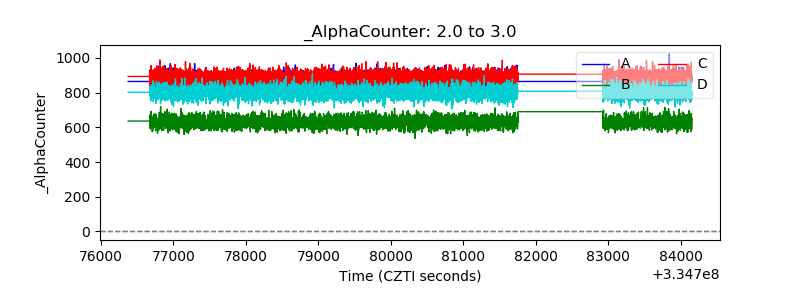 |
| _CPM_Rate | 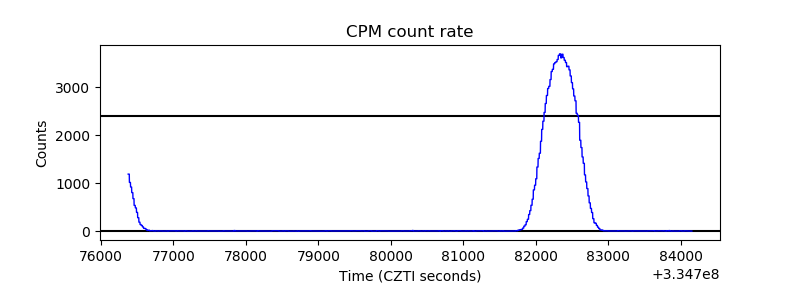 |
| CZT Counter | 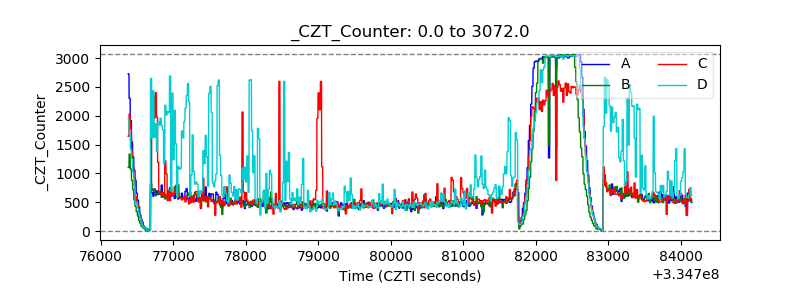 |
| +2.5 Volts monitor |  |
| +5 Volts monitor | 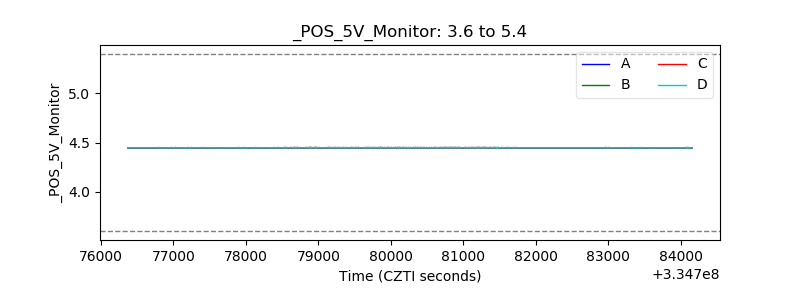 |
| _ROLL_ROT | 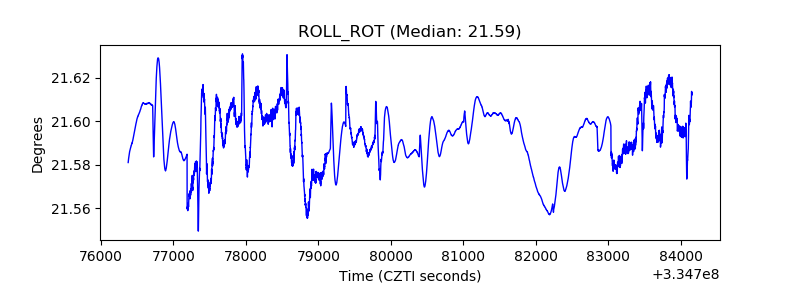 |
| _Roll_DEC | 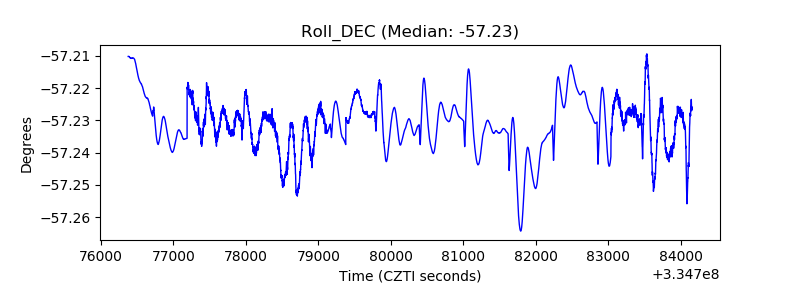 |
| _Roll_RA | 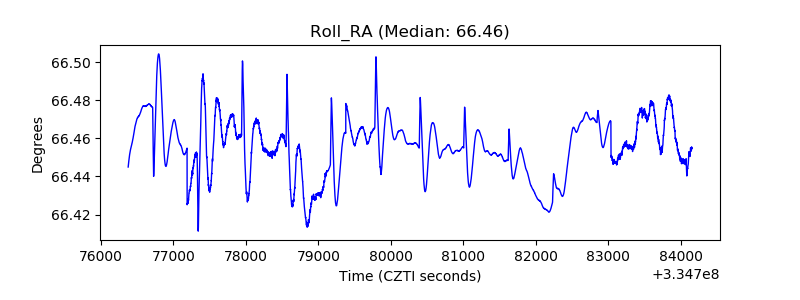 |
| Veto Counter | 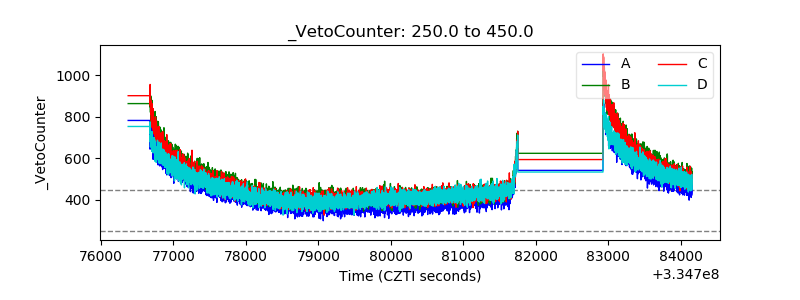 |