| Param | Original file | Final file |
|---|---|---|
| Filename | modeM0/AS1A09_008T02_9000003796_26329cztM0_level2.evt | modeM0/AS1A09_008T02_9000003796_26329cztM0_level2_quad_clean.evt |
| Size (bytes) | 516,297,600 | 124,902,720 |
| Size | 492.4 MB | 119.1 MB |
| Events in quadrant A | 3,249,134 | 850,130 |
| Events in quadrant B | 3,327,569 | 875,168 |
| Events in quadrant C | 4,190,900 | 818,097 |
| Events in quadrant D | 4,445,621 | 804,070 |
| Mode M0 | |||
|---|---|---|---|
| Quadrant | BADHDUFLAG | Total packets | Discarded packets |
| A | 0 | 13527 | 0 |
| B | 0 | 13744 | 0 |
| C | 0 | 16568 | 0 |
| D | 0 | 17349 | 0 |
| Mode M9 | |||
|---|---|---|---|
| Quadrant | BADHDUFLAG | Total packets | Discarded packets |
| A | 0 | 15 | 0 |
| B | 0 | 16 | 0 |
| C | 0 | 16 | 0 |
| D | 0 | 16 | 0 |
| Quadrant | Total seconds | Saturated seconds | Saturation percentage |
|---|---|---|---|
| A | 6234 | 36 | 0.577478% |
| B | 6234 | 58 | 0.930382% |
| C | 6234 | 279 | 4.475457% |
| D | 6234 | 148 | 2.374078% |
Noise dominated data is calculated using 1-second bins in cleaned event files. If a bin has >2000 counts, and if more than 50% of those come from <1% of pixels, then it is considered to be noise-dominated and hence unusable.
| Quadrant | # 1 sec bins | Bins with >0 counts | Bins with >2000 counts | High rate bins dominated by noise | Noise dominated (total time) | Noise dominated (detector-on time) | Marked lightcurve |
|---|---|---|---|---|---|---|---|
| A | 7599 | 6235 | 0 | 0 | 0.00% | 0.00% | 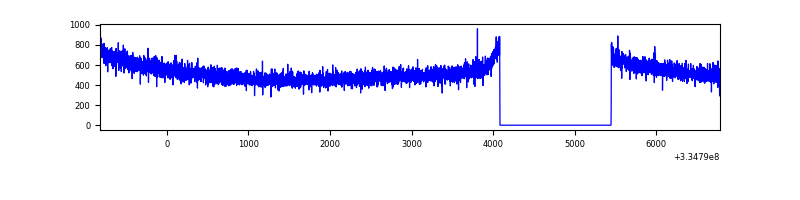 |
| B | 7599 | 6235 | 2 | 2 | 0.03% | 0.03% | 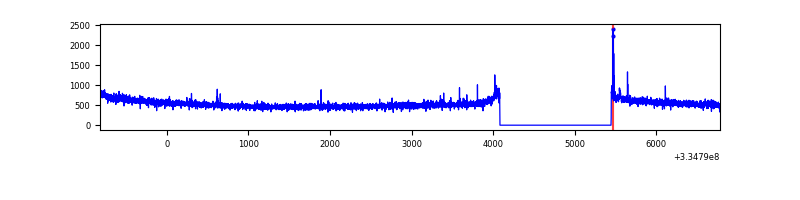 |
| C | 7599 | 6235 | 103 | 103 | 1.36% | 1.65% | 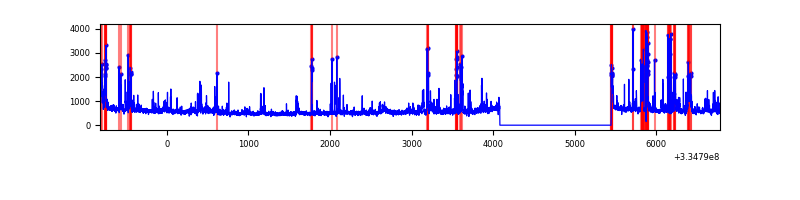 |
| D | 7599 | 6235 | 112 | 112 | 1.47% | 1.80% | 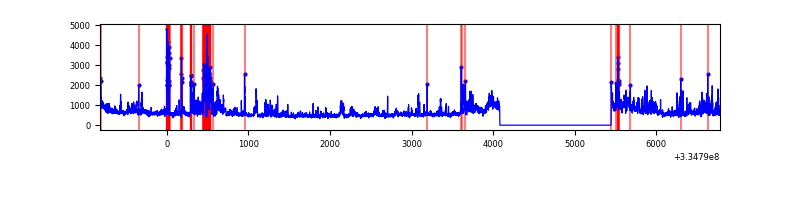 |
Top three noisy pixels from each quadrant. If the there are fewer than three noisy pixels in the level2.evt file, extra rows are filled as -1
| Pixel properties | Quadrant properties | ||||||
|---|---|---|---|---|---|---|---|
| Quadrant | DetID | PixID | Counts | Sigma | Mean | Median | Sigma |
| A | 13 | 254 | 10714 | 59.42 | 842 | 828 | 166.4 |
| A | 3 | 137 | 7330 | 39.08 | 842 | 828 | 166.4 |
| A | 0 | 226 | 7118 | 37.8 | 842 | 828 | 166.4 |
| B | 12 | 111 | 17859 | 109.82 | 845 | 825 | 155.1 |
| B | 0 | 230 | 16274 | 99.61 | 845 | 825 | 155.1 |
| B | 11 | 111 | 16024 | 97.99 | 845 | 825 | 155.1 |
| C | 3 | 233 | 866746 | 4716.56 | 805 | 814 | 183.6 |
| C | 14 | 238 | 132210 | 715.69 | 805 | 814 | 183.6 |
| C | 2 | 16 | 44979 | 240.56 | 805 | 814 | 183.6 |
| D | 1 | 52 | 1250617 | 6545.16 | 811 | 793 | 191.0 |
| D | 12 | 227 | 100352 | 521.38 | 811 | 793 | 191.0 |
| D | 2 | 234 | 25162 | 127.61 | 811 | 793 | 191.0 |
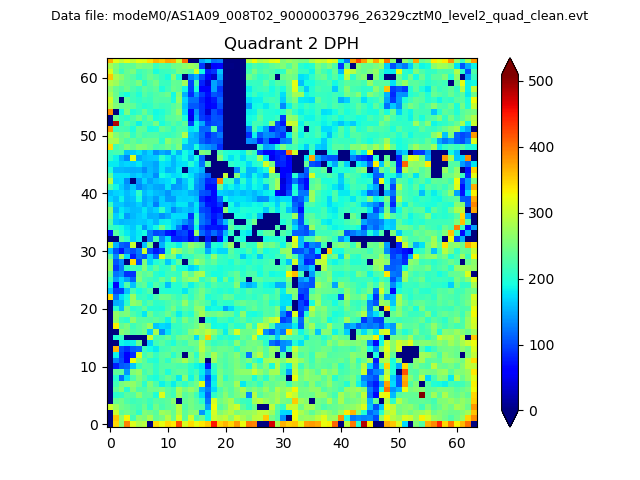
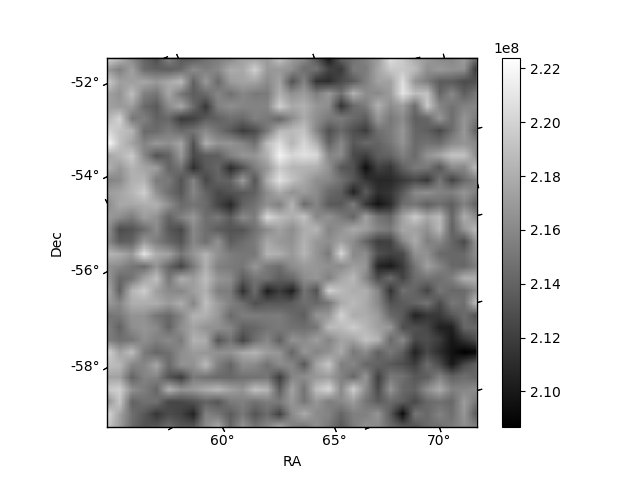
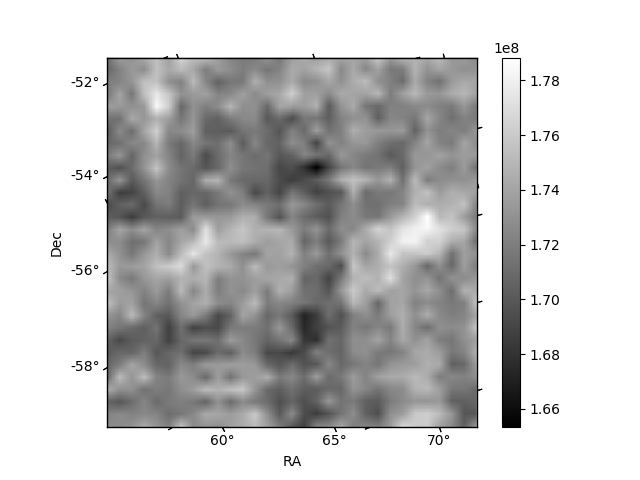
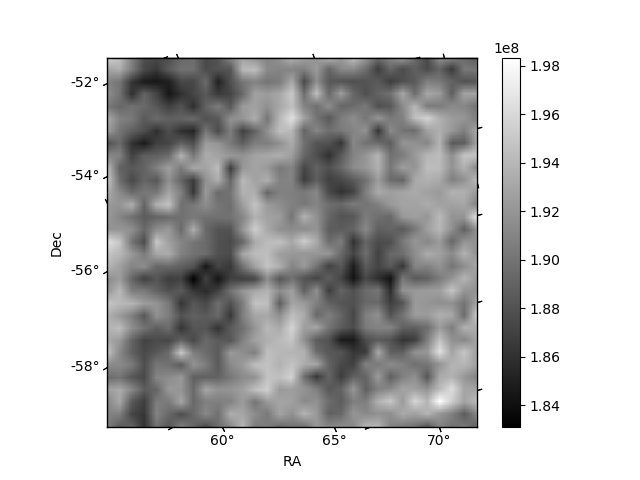
Histogram calculated using DETX and DETY for each event in the final _common_clean file
| Quadrant A | 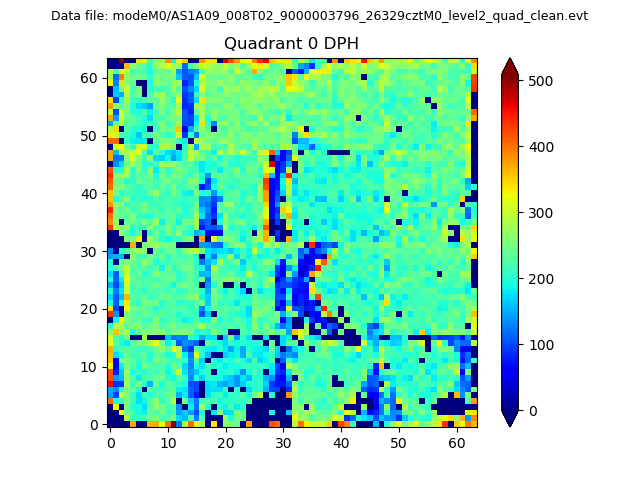 |
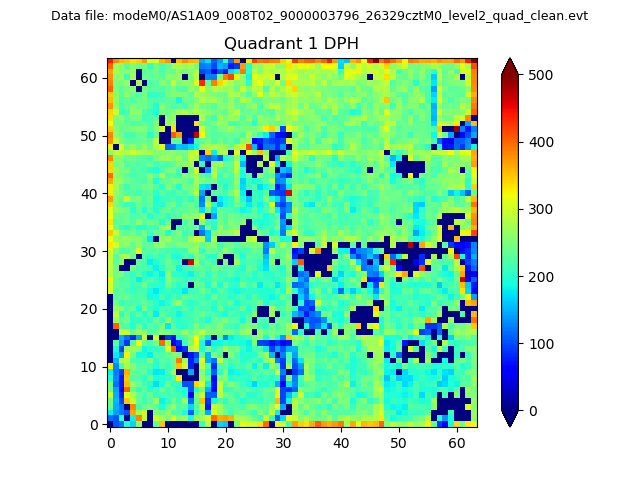 |
Quadrant B |
|---|---|---|---|
| Quadrant D | 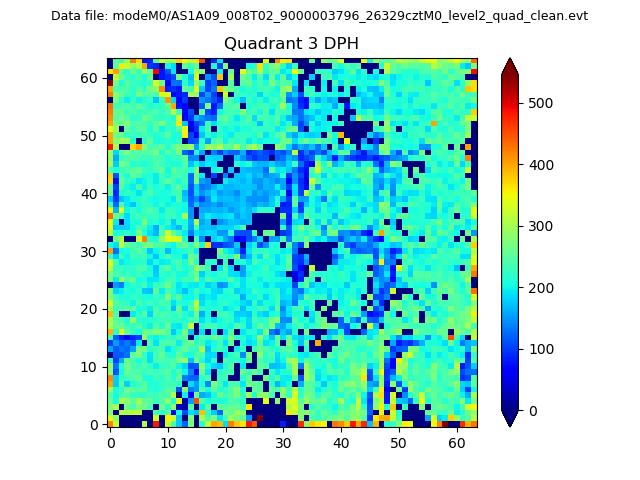 |
 |
Quadrant C |
| Plot type | Count rate plots | Images |
|---|---|---|
| Comparison with Poisson distribution Blue bars denote a histogram of data divided into 1 sec bins. Red curve is a Poisson curve with rate = median count rate of data. |
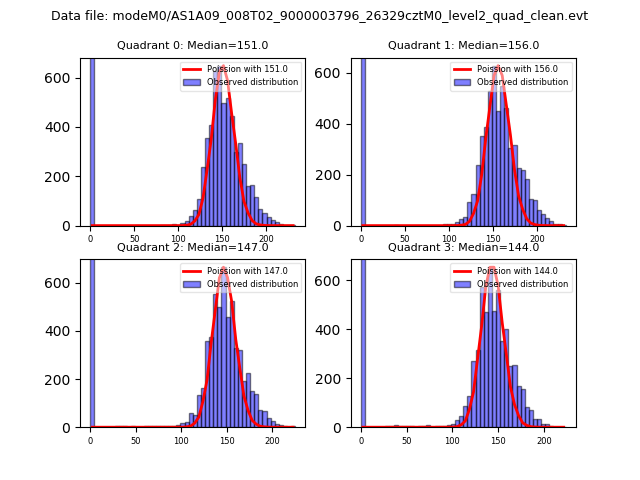 |
 |
| Quadrant-wise count rates Data is divided into 100 sec bins |
 |
|
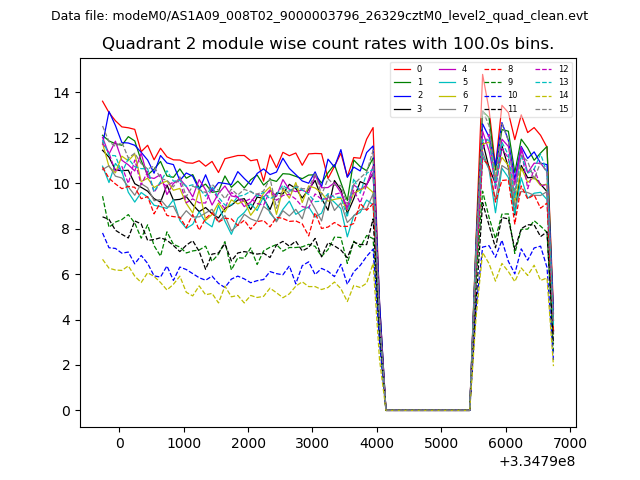
| Module-wise count rates for Quadrant A Data is divided into 100 sec bins |
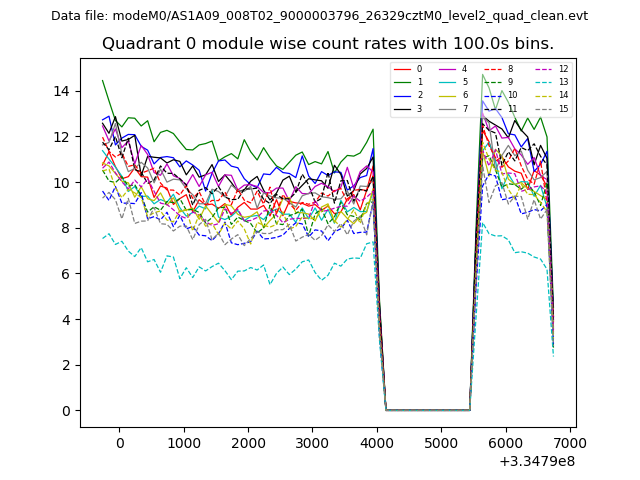 |
 |
| Module-wise count rates for Quadrant B Data is divided into 100 sec bins |
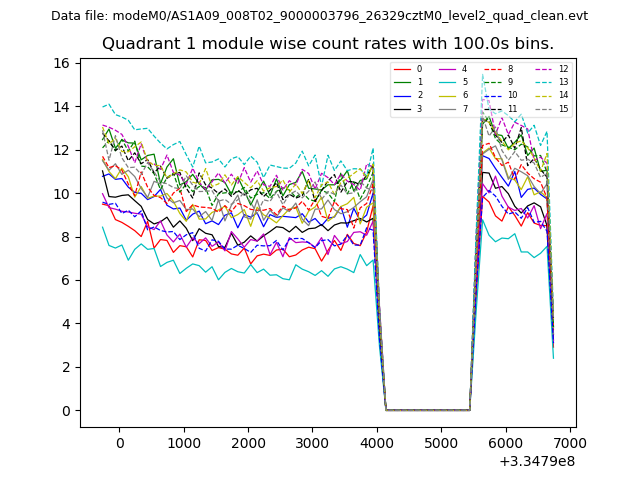 |
 |
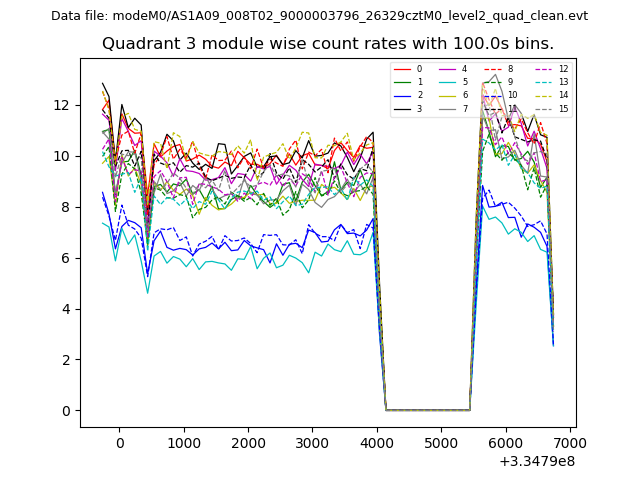
| Module-wise count rates for Quadrant C Data is divided into 100 sec bins |
 |
 |
| Module-wise count rates for Quadrant D Data is divided into 100 sec bins |
 |
 |
| Parameter | Plot |
|---|---|
| CZT HV Monitor | 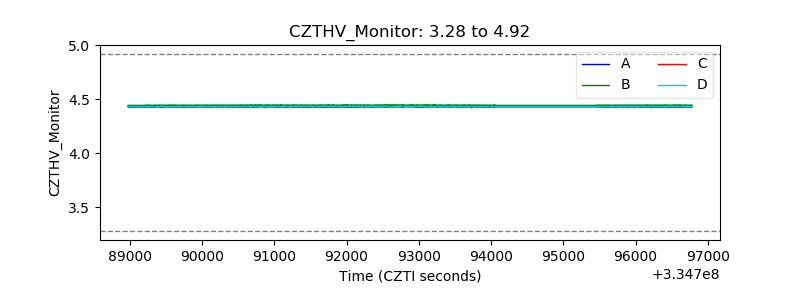 |
| D_VDD | 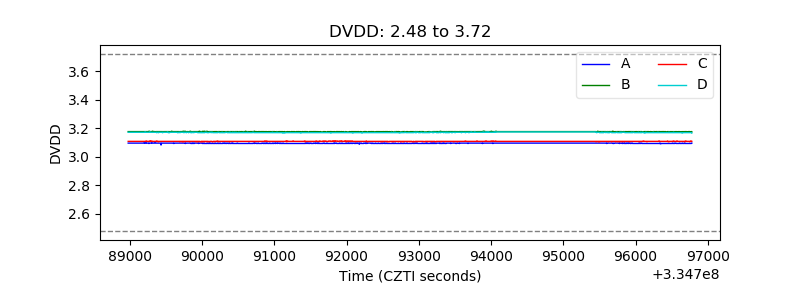 |
| Temperature 1 | 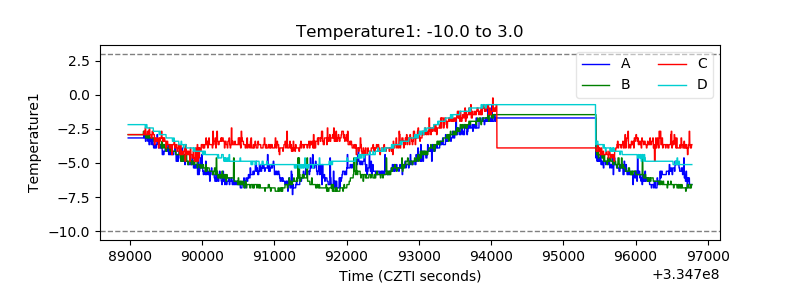 |
| Veto HV Monitor | 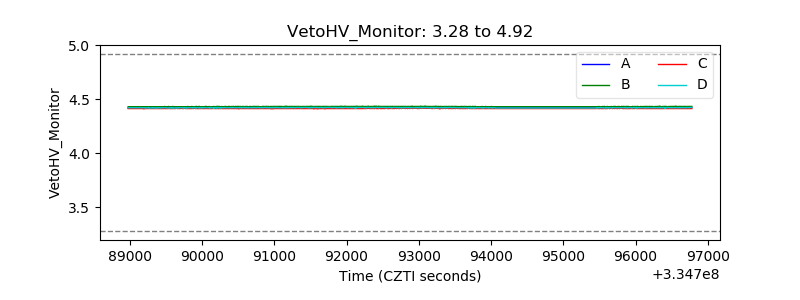 |
| Veto LLD | 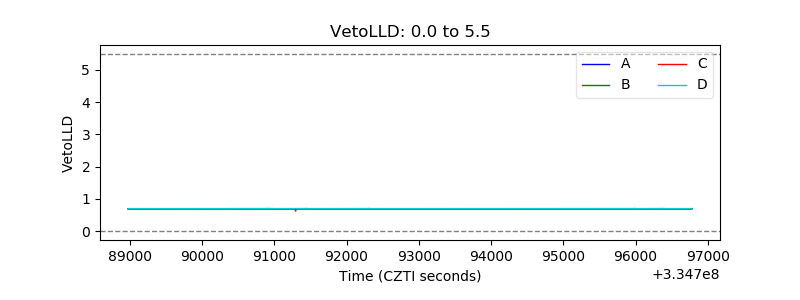 |
| Alpha Counter | 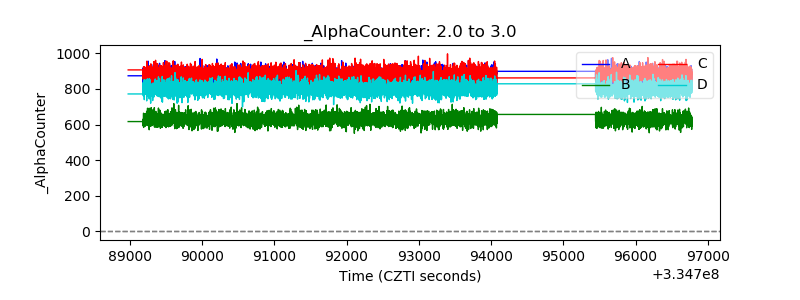 |
| _CPM_Rate | 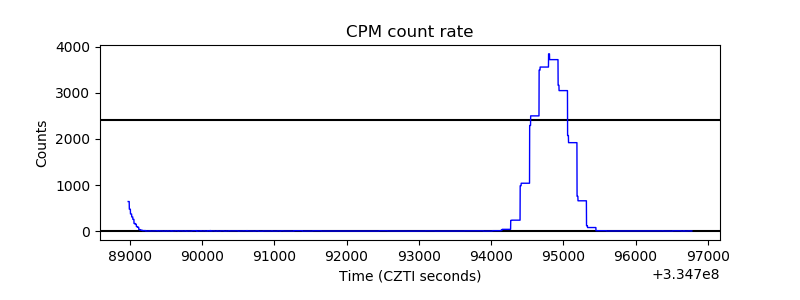 |
| CZT Counter |  |
| +2.5 Volts monitor |  |
| +5 Volts monitor |  |
| _ROLL_ROT | 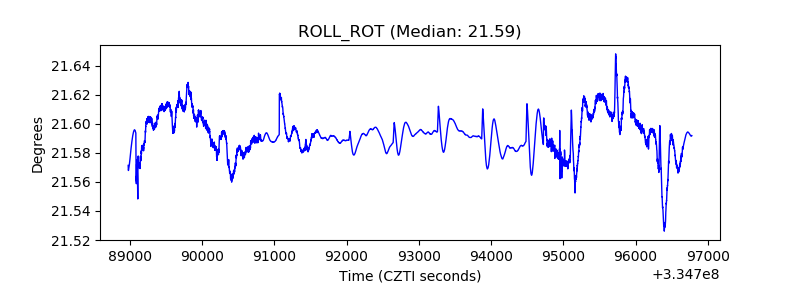 |
| _Roll_DEC | 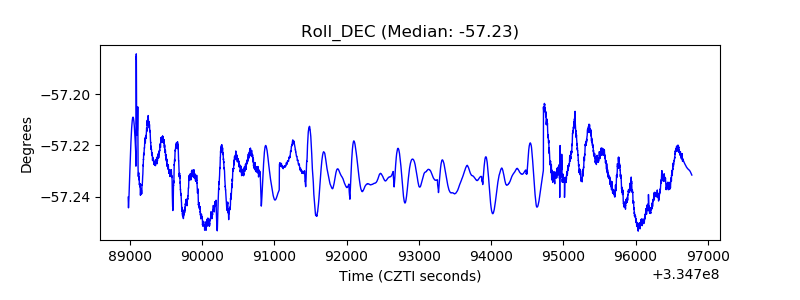 |
| _Roll_RA |  |
| Veto Counter | 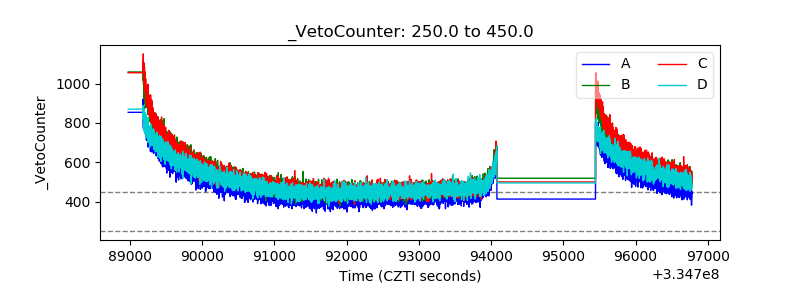 |