| Param | Original file | Final file |
|---|---|---|
| Filename | modeM0/AS1A09_008T02_9000003796_26330cztM0_level2.evt | modeM0/AS1A09_008T02_9000003796_26330cztM0_level2_quad_clean.evt |
| Size (bytes) | 544,852,800 | 128,972,160 |
| Size | 519.6 MB | 123.0 MB |
| Events in quadrant A | 3,177,404 | 880,803 |
| Events in quadrant B | 3,262,916 | 909,252 |
| Events in quadrant C | 4,271,533 | 851,575 |
| Events in quadrant D | 5,366,797 | 829,636 |
| Mode M0 | |||
|---|---|---|---|
| Quadrant | BADHDUFLAG | Total packets | Discarded packets |
| A | 0 | 13229 | 0 |
| B | 0 | 13437 | 0 |
| C | 0 | 16608 | 0 |
| D | 0 | 20184 | 0 |
| Mode M9 | |||
|---|---|---|---|
| Quadrant | BADHDUFLAG | Total packets | Discarded packets |
| A | 0 | 19 | 0 |
| B | 0 | 20 | 0 |
| C | 0 | 20 | 0 |
| D | 0 | 20 | 0 |
| Quadrant | Total seconds | Saturated seconds | Saturation percentage |
|---|---|---|---|
| A | 6228 | 38 | 0.610148% |
| B | 6228 | 56 | 0.899165% |
| C | 6228 | 395 | 6.342325% |
| D | 6228 | 350 | 5.619782% |
Noise dominated data is calculated using 1-second bins in cleaned event files. If a bin has >2000 counts, and if more than 50% of those come from <1% of pixels, then it is considered to be noise-dominated and hence unusable.
| Quadrant | # 1 sec bins | Bins with >0 counts | Bins with >2000 counts | High rate bins dominated by noise | Noise dominated (total time) | Noise dominated (detector-on time) | Marked lightcurve |
|---|---|---|---|---|---|---|---|
| A | 7553 | 6229 | 0 | 0 | 0.00% | 0.00% | 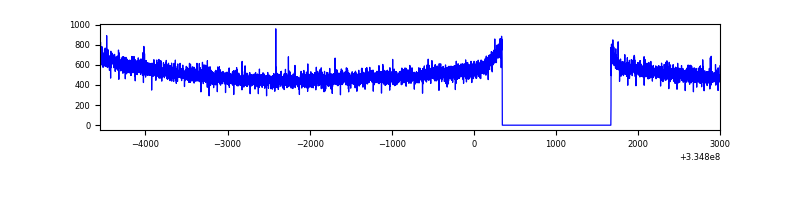 |
| B | 7553 | 6229 | 2 | 2 | 0.03% | 0.03% | 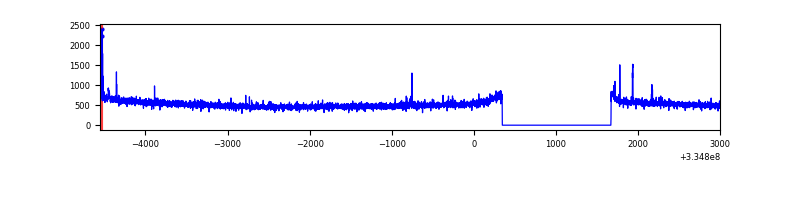 |
| C | 7553 | 6229 | 162 | 162 | 2.14% | 2.60% |  |
| D | 7553 | 6229 | 209 | 209 | 2.77% | 3.36% |  |
Top three noisy pixels from each quadrant. If the there are fewer than three noisy pixels in the level2.evt file, extra rows are filled as -1
| Pixel properties | Quadrant properties | ||||||
|---|---|---|---|---|---|---|---|
| Quadrant | DetID | PixID | Counts | Sigma | Mean | Median | Sigma |
| A | 13 | 254 | 9406 | 52.57 | 824 | 810 | 163.5 |
| A | 3 | 137 | 7052 | 38.18 | 824 | 810 | 163.5 |
| A | 0 | 226 | 7025 | 38.01 | 824 | 810 | 163.5 |
| B | 12 | 111 | 17716 | 111.74 | 826 | 807 | 151.3 |
| B | 11 | 111 | 15957 | 100.11 | 826 | 807 | 151.3 |
| B | 0 | 230 | 15401 | 96.44 | 826 | 807 | 151.3 |
| C | 3 | 233 | 1034496 | 5631.51 | 793 | 800 | 183.6 |
| C | 14 | 238 | 130879 | 708.66 | 793 | 800 | 183.6 |
| C | 2 | 16 | 15627 | 80.77 | 793 | 800 | 183.6 |
| D | 1 | 52 | 2226137 | 11937.65 | 794 | 778 | 186.4 |
| D | 12 | 227 | 110491 | 588.54 | 794 | 778 | 186.4 |
| D | 2 | 234 | 24139 | 125.32 | 794 | 778 | 186.4 |
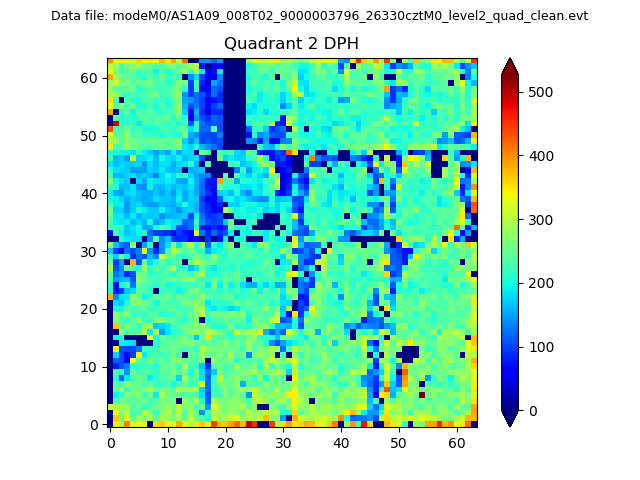
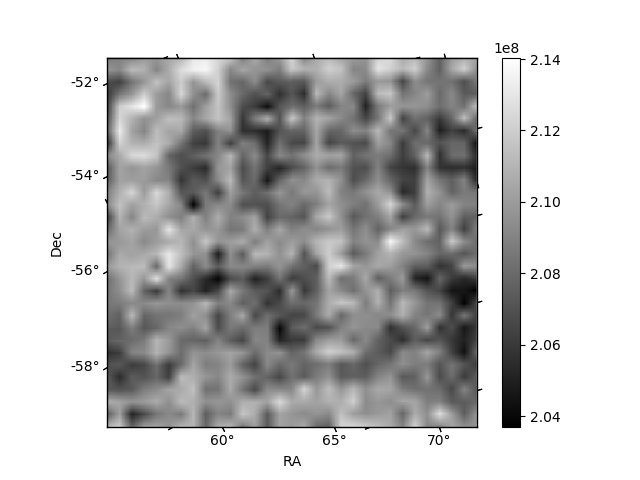
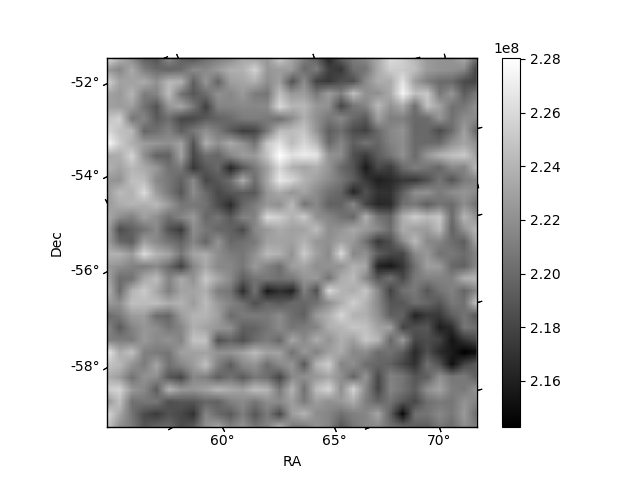
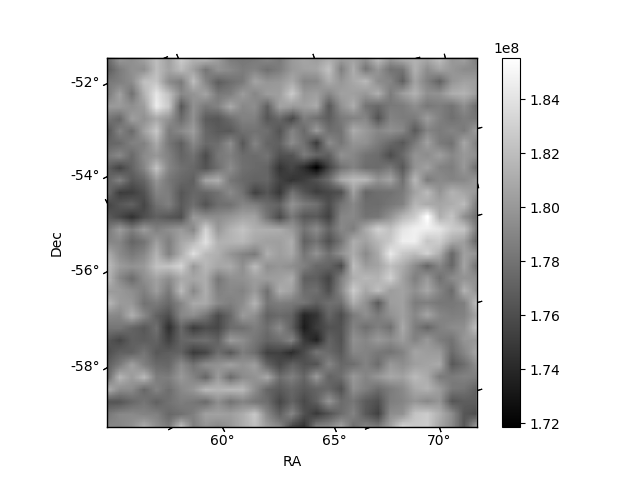
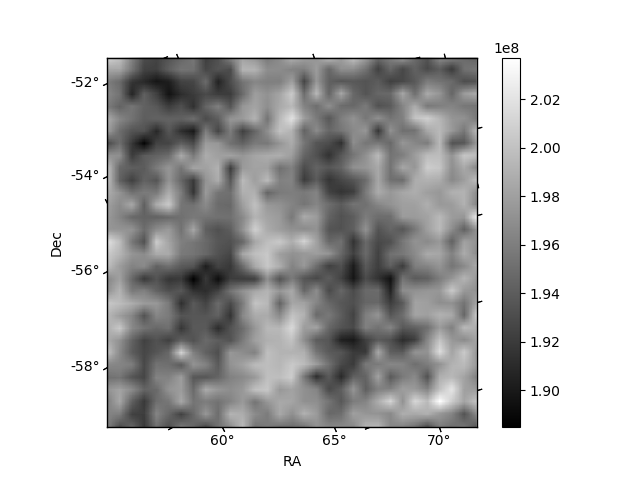
Histogram calculated using DETX and DETY for each event in the final _common_clean file
| Quadrant A | 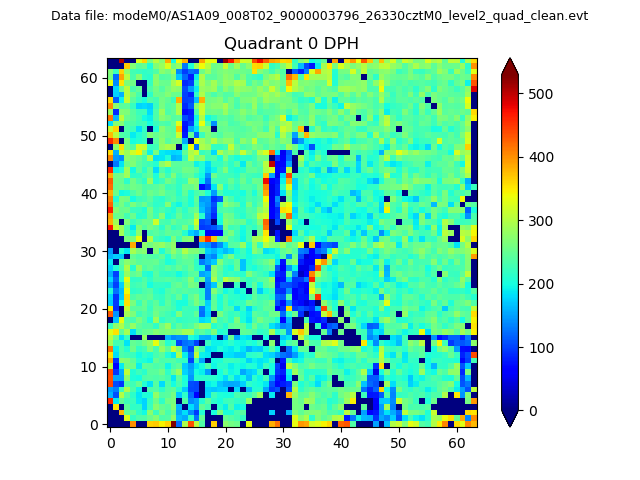 |
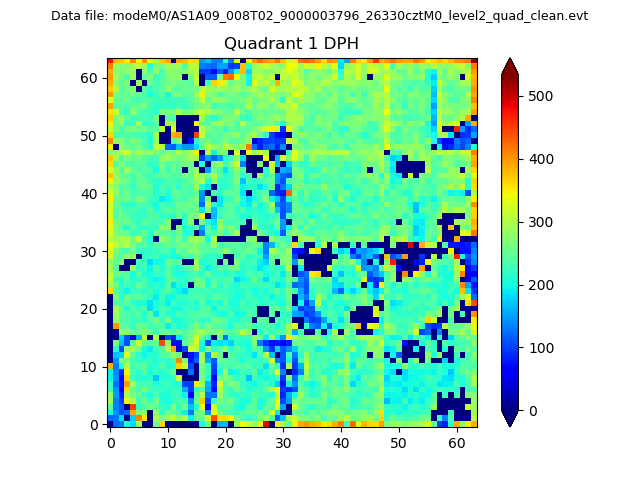 |
Quadrant B |
|---|---|---|---|
| Quadrant D | 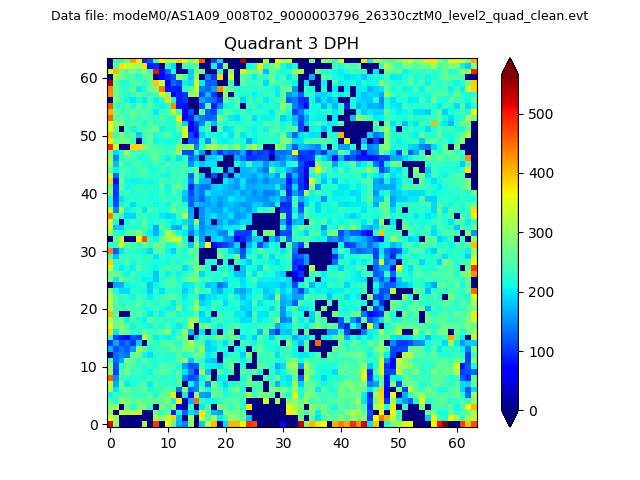 |
 |
Quadrant C |
| Plot type | Count rate plots | Images |
|---|---|---|
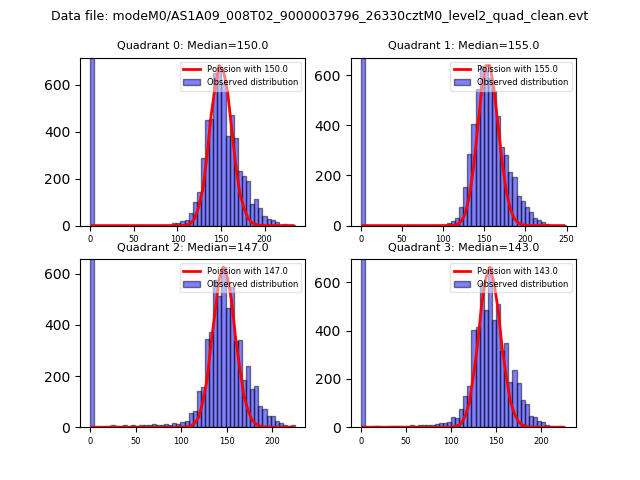
| Comparison with Poisson distribution Blue bars denote a histogram of data divided into 1 sec bins. Red curve is a Poisson curve with rate = median count rate of data. |
 |
 |
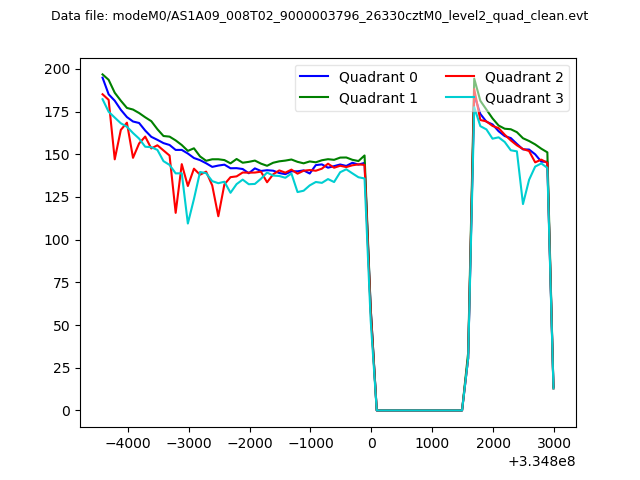
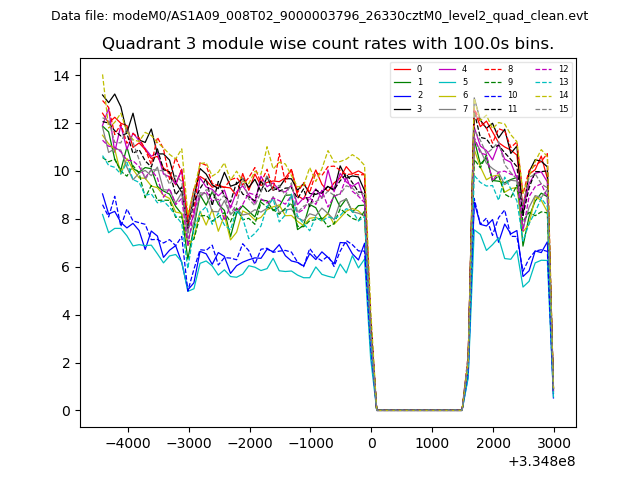
| Quadrant-wise count rates Data is divided into 100 sec bins |
 |
|
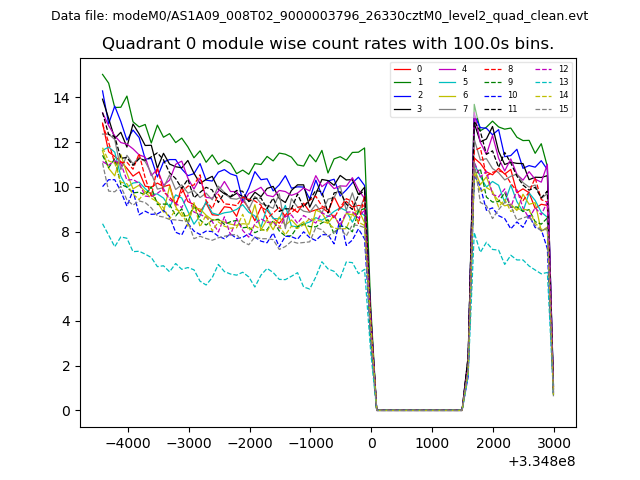
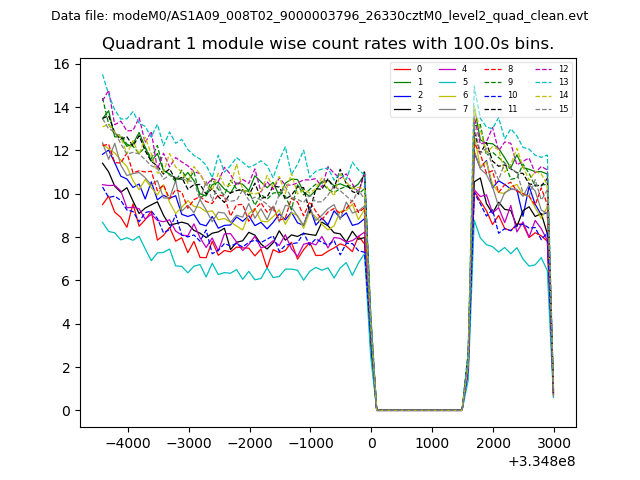
| Module-wise count rates for Quadrant A Data is divided into 100 sec bins |
 |
 |
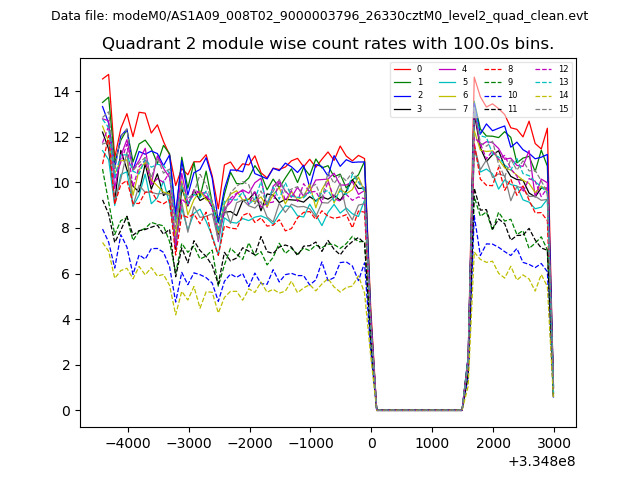
| Module-wise count rates for Quadrant B Data is divided into 100 sec bins |
 |
 |
| Module-wise count rates for Quadrant C Data is divided into 100 sec bins |
 |
 |
| Module-wise count rates for Quadrant D Data is divided into 100 sec bins |
 |
 |
| Parameter | Plot |
|---|---|
| CZT HV Monitor | 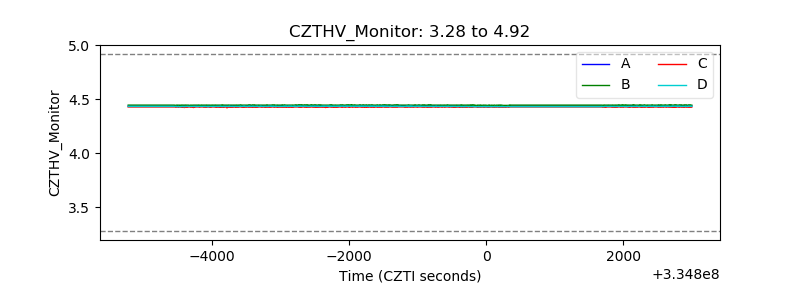 |
| D_VDD | 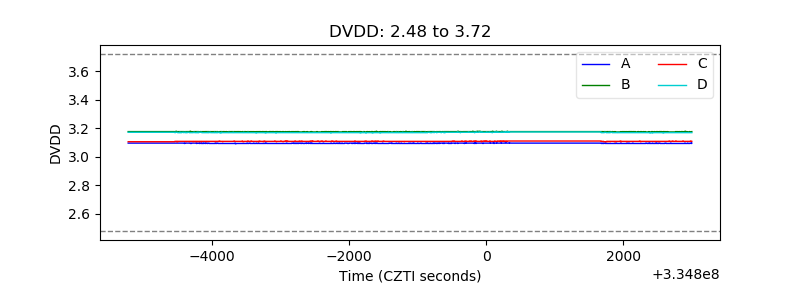 |
| Temperature 1 | 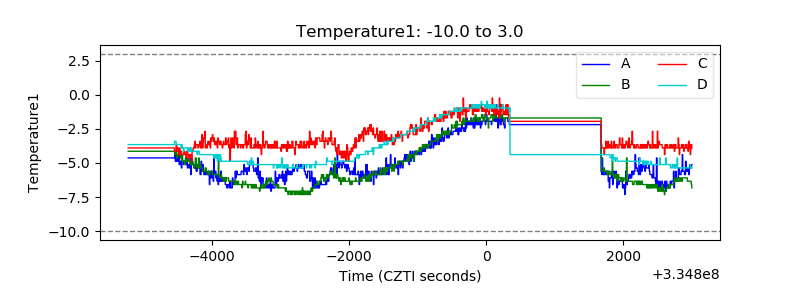 |
| Veto HV Monitor | 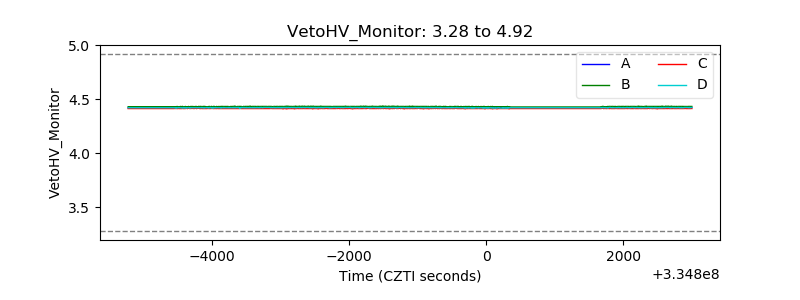 |
| Veto LLD | 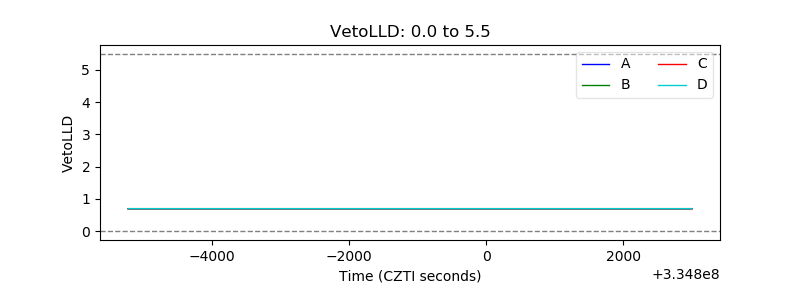 |
| Alpha Counter |  |
| _CPM_Rate | 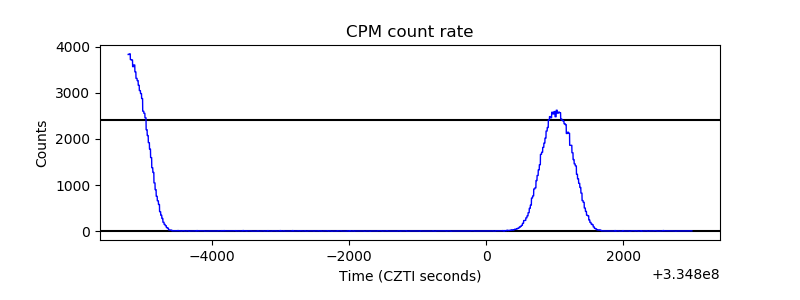 |
| CZT Counter | 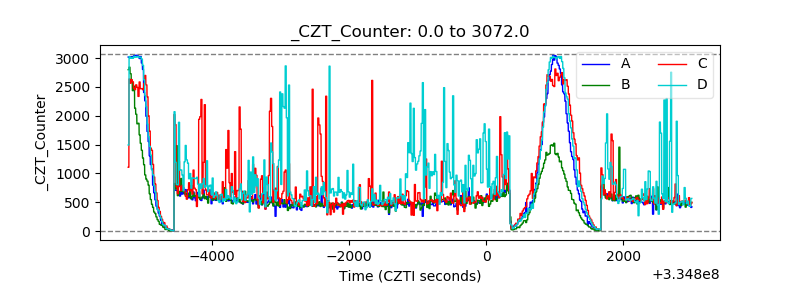 |
| +2.5 Volts monitor |  |
| +5 Volts monitor |  |
| _ROLL_ROT | 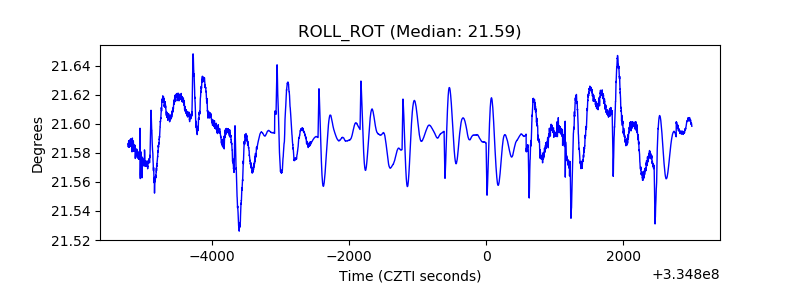 |
| _Roll_DEC | 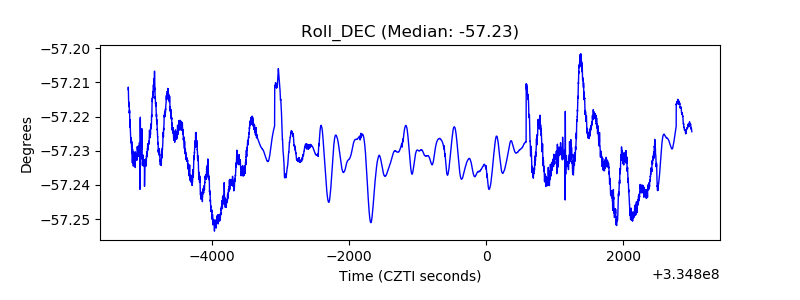 |
| _Roll_RA | 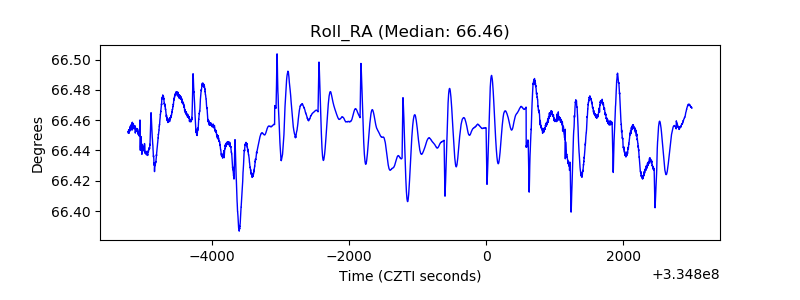 |
| Veto Counter | 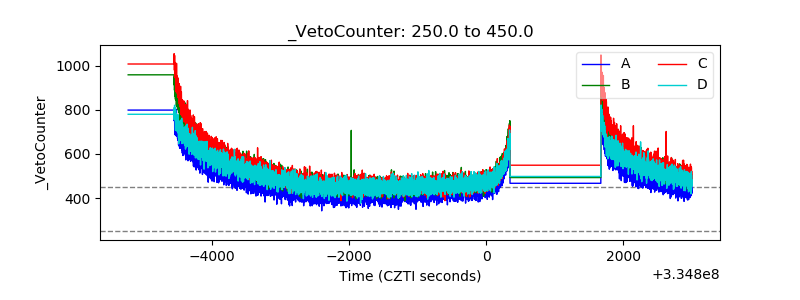 |