| Param | Original file | Final file |
|---|---|---|
| Filename | modeM0/AS1A09_008T02_9000003796_26331cztM0_level2.evt | modeM0/AS1A09_008T02_9000003796_26331cztM0_level2_quad_clean.evt |
| Size (bytes) | 594,204,480 | 118,134,720 |
| Size | 566.7 MB | 112.7 MB |
| Events in quadrant A | 3,121,151 | 806,174 |
| Events in quadrant B | 3,231,504 | 831,438 |
| Events in quadrant C | 4,867,619 | 785,238 |
| Events in quadrant D | 6,343,595 | 710,168 |
| Mode M0 | |||
|---|---|---|---|
| Quadrant | BADHDUFLAG | Total packets | Discarded packets |
| A | 0 | 13176 | 0 |
| B | 0 | 13406 | 0 |
| C | 0 | 18398 | 0 |
| D | 0 | 23117 | 0 |
| Mode M9 | |||
|---|---|---|---|
| Quadrant | BADHDUFLAG | Total packets | Discarded packets |
| A | 0 | 16 | 0 |
| B | 0 | 17 | 0 |
| C | 0 | 17 | 0 |
| D | 0 | 17 | 0 |
| Quadrant | Total seconds | Saturated seconds | Saturation percentage |
|---|---|---|---|
| A | 6370 | 12 | 0.188383% |
| B | 6369 | 59 | 0.926362% |
| C | 6369 | 639 | 10.032972% |
| D | 6369 | 1002 | 15.732454% |
Noise dominated data is calculated using 1-second bins in cleaned event files. If a bin has >2000 counts, and if more than 50% of those come from <1% of pixels, then it is considered to be noise-dominated and hence unusable.
| Quadrant | # 1 sec bins | Bins with >0 counts | Bins with >2000 counts | High rate bins dominated by noise | Noise dominated (total time) | Noise dominated (detector-on time) | Marked lightcurve |
|---|---|---|---|---|---|---|---|
| A | 7610 | 6372 | 0 | 0 | 0.00% | 0.00% | 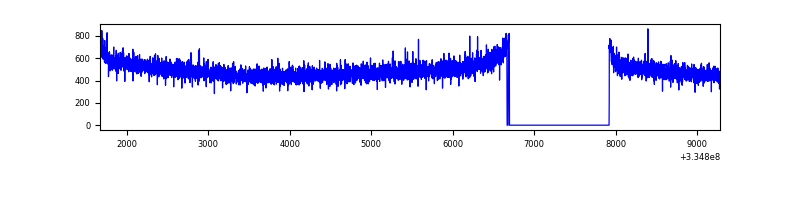 |
| B | 7609 | 6371 | 1 | 1 | 0.01% | 0.02% | 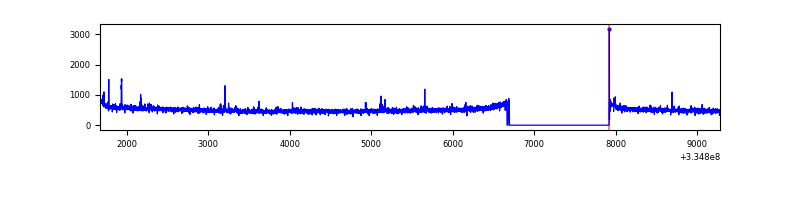 |
| C | 7609 | 6371 | 332 | 332 | 4.36% | 5.21% | 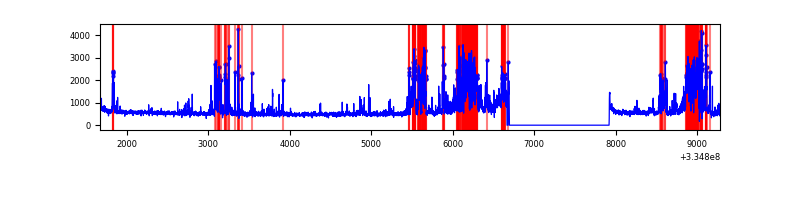 |
| D | 7608 | 6370 | 659 | 659 | 8.66% | 10.35% | 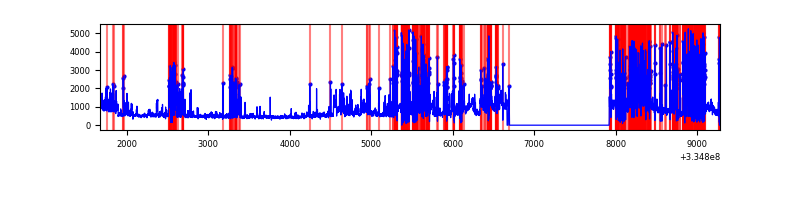 |
Top three noisy pixels from each quadrant. If the there are fewer than three noisy pixels in the level2.evt file, extra rows are filled as -1
| Pixel properties | Quadrant properties | ||||||
|---|---|---|---|---|---|---|---|
| Quadrant | DetID | PixID | Counts | Sigma | Mean | Median | Sigma |
| A | 13 | 254 | 8865 | 50.36 | 808 | 791 | 160.3 |
| A | 3 | 137 | 7186 | 39.88 | 808 | 791 | 160.3 |
| A | 0 | 226 | 6746 | 37.14 | 808 | 791 | 160.3 |
| B | 0 | 219 | 33039 | 213.53 | 811 | 790 | 151.0 |
| B | 12 | 111 | 17964 | 113.71 | 811 | 790 | 151.0 |
| B | 11 | 111 | 15934 | 100.27 | 811 | 790 | 151.0 |
| C | 3 | 233 | 1724954 | 9627.67 | 773 | 777 | 179.1 |
| C | 14 | 238 | 123651 | 686.12 | 773 | 777 | 179.1 |
| C | 2 | 16 | 10727 | 55.56 | 773 | 777 | 179.1 |
| D | 1 | 52 | 3207902 | 18707.31 | 730 | 712 | 171.4 |
| D | 12 | 227 | 356627 | 2076.03 | 730 | 712 | 171.4 |
| D | 2 | 234 | 25830 | 146.51 | 730 | 712 | 171.4 |
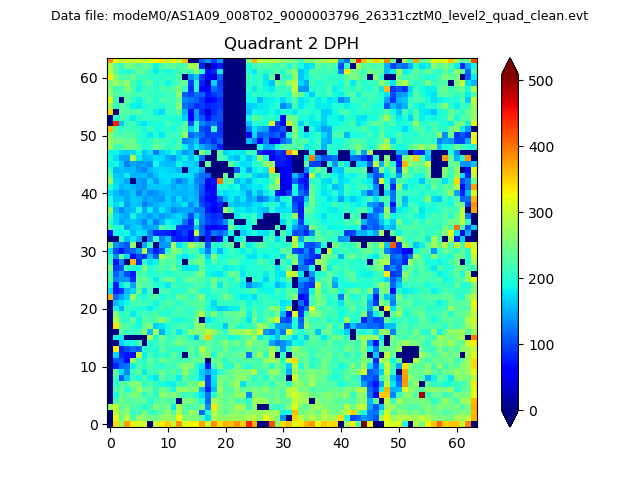
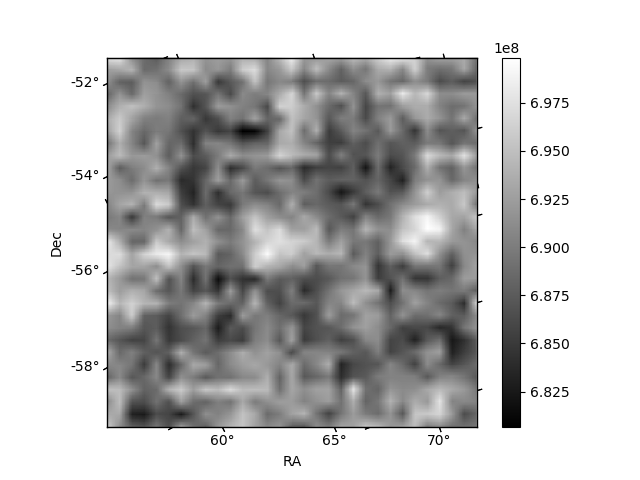
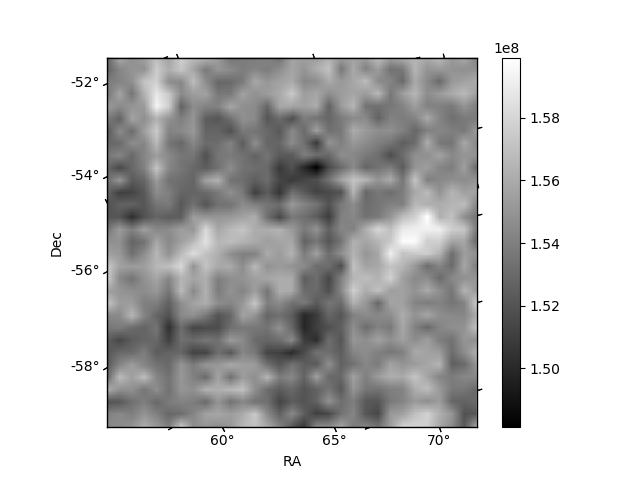
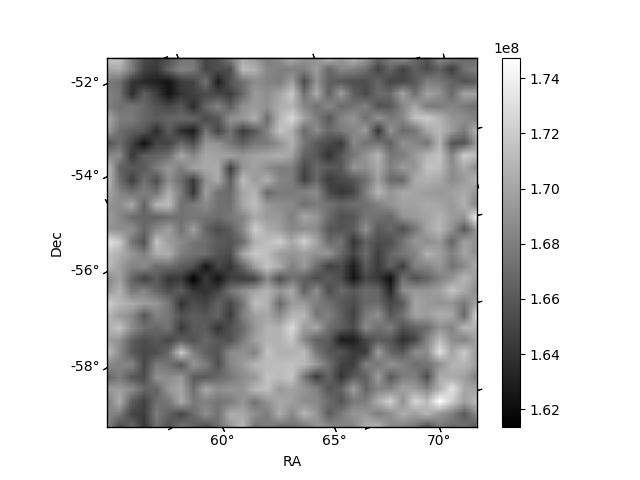
Histogram calculated using DETX and DETY for each event in the final _common_clean file
| Quadrant A | 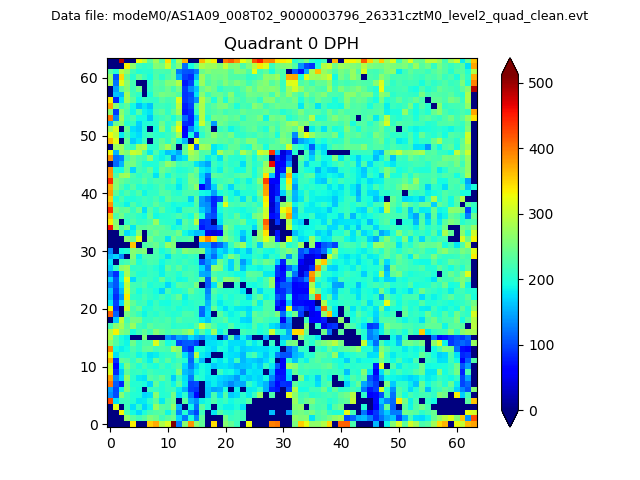 |
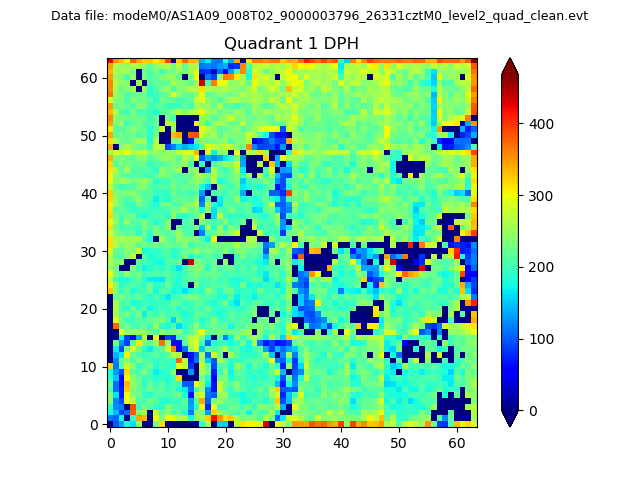 |
Quadrant B |
|---|---|---|---|
| Quadrant D | 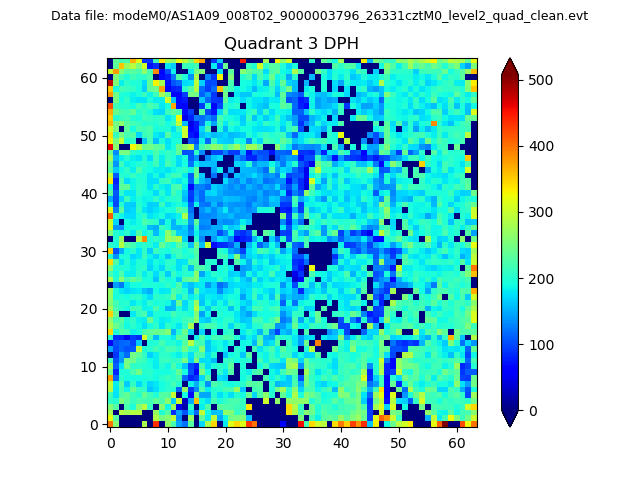 |
 |
Quadrant C |
| Plot type | Count rate plots | Images |
|---|---|---|
| Comparison with Poisson distribution Blue bars denote a histogram of data divided into 1 sec bins. Red curve is a Poisson curve with rate = median count rate of data. |
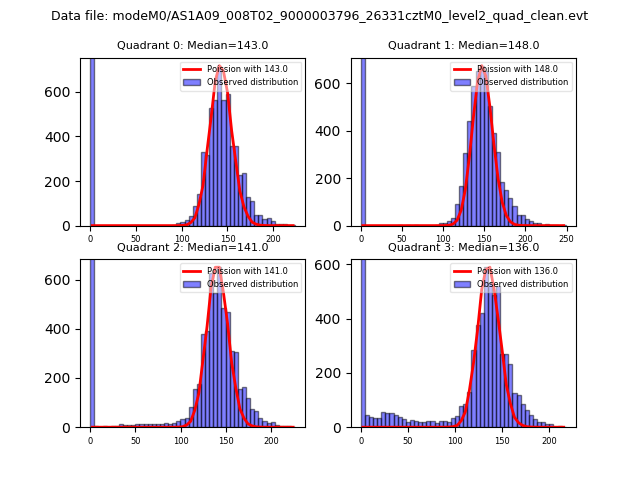 |
 |
| Quadrant-wise count rates Data is divided into 100 sec bins |
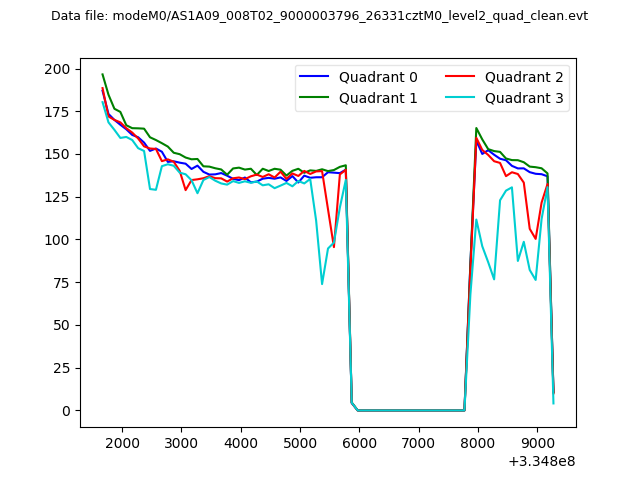 |
|
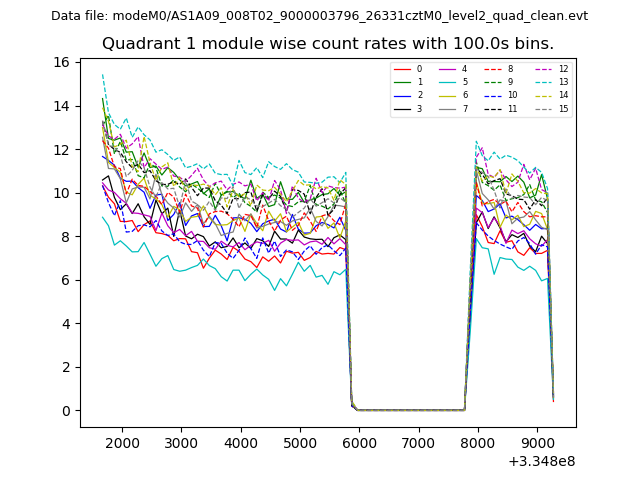
| Module-wise count rates for Quadrant A Data is divided into 100 sec bins |
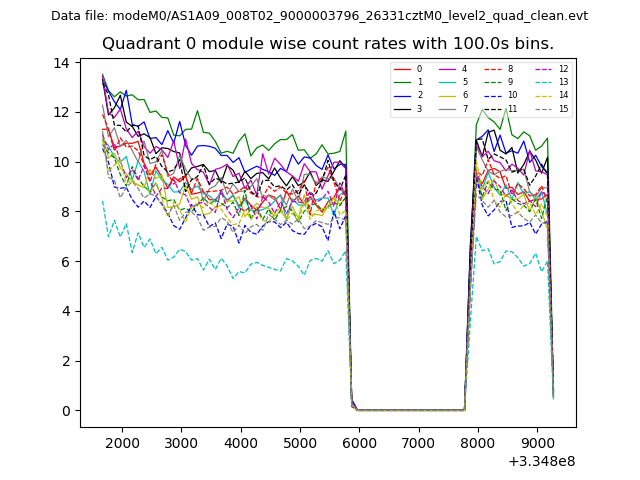 |
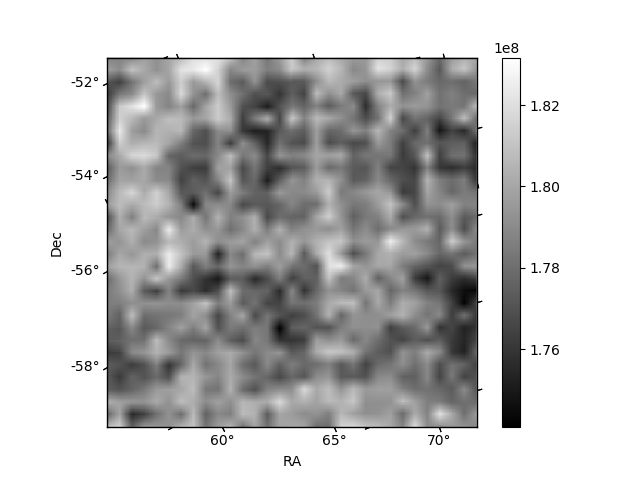 |
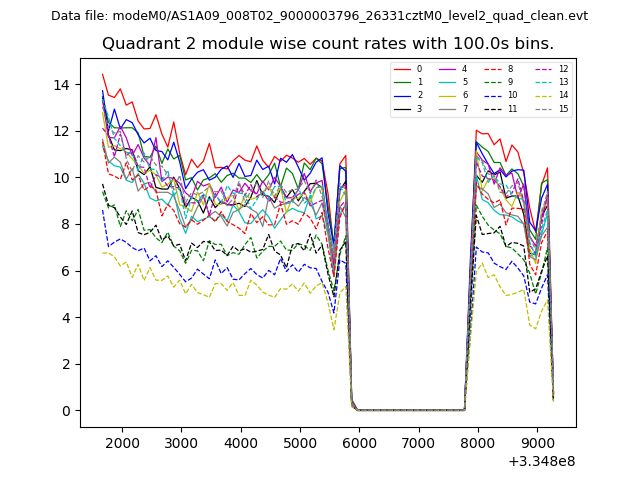
| Module-wise count rates for Quadrant B Data is divided into 100 sec bins |
 |
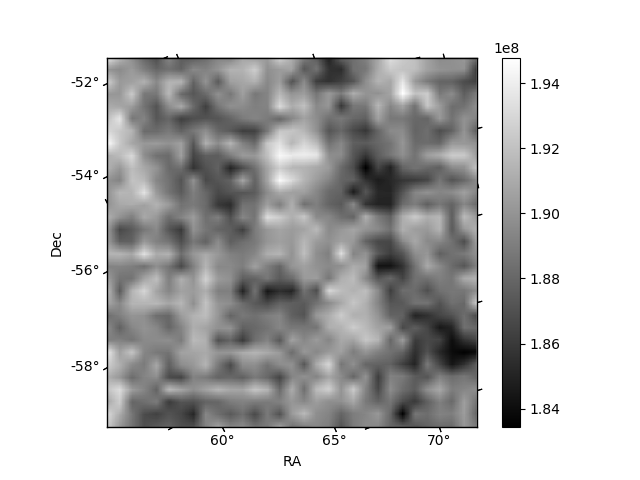 |
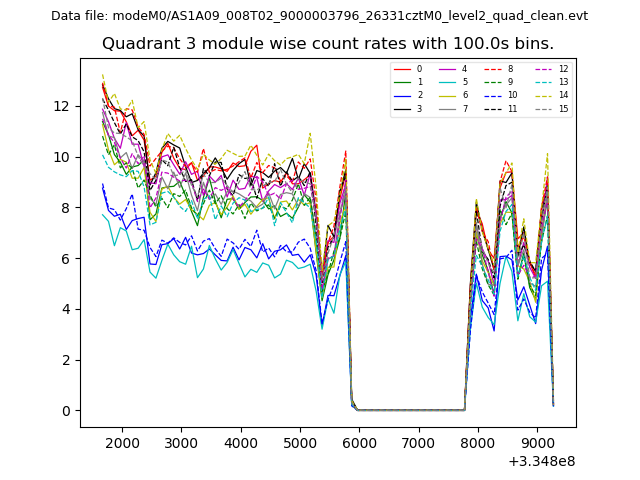
| Module-wise count rates for Quadrant C Data is divided into 100 sec bins |
 |
 |
| Module-wise count rates for Quadrant D Data is divided into 100 sec bins |
 |
 |
| Parameter | Plot |
|---|---|
| CZT HV Monitor | 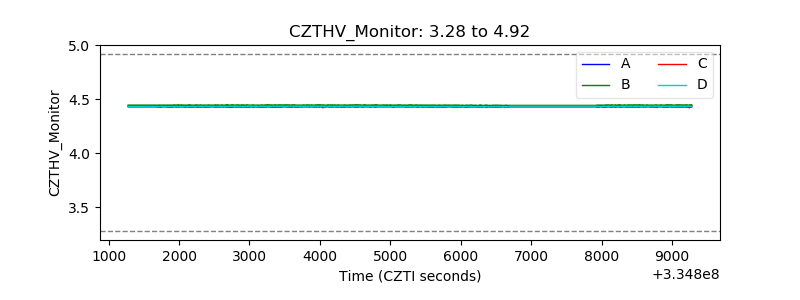 |
| D_VDD | 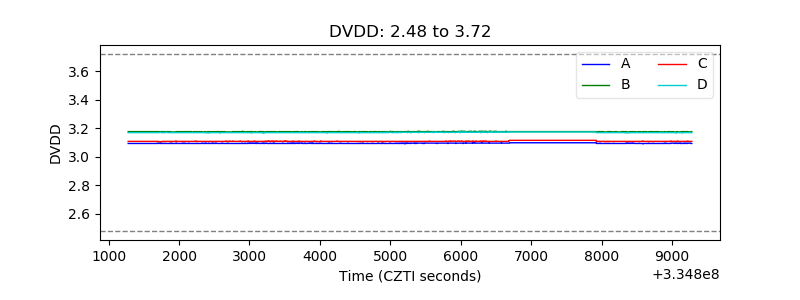 |
| Temperature 1 | 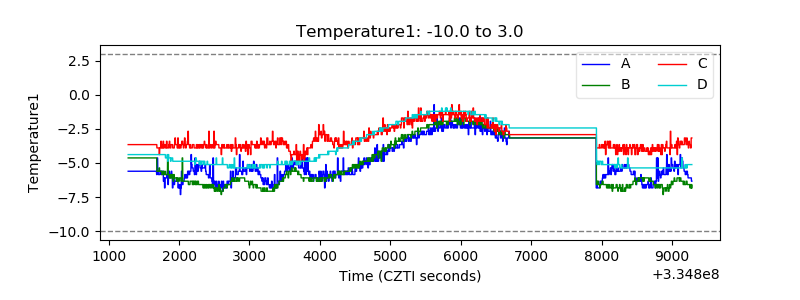 |
| Veto HV Monitor | 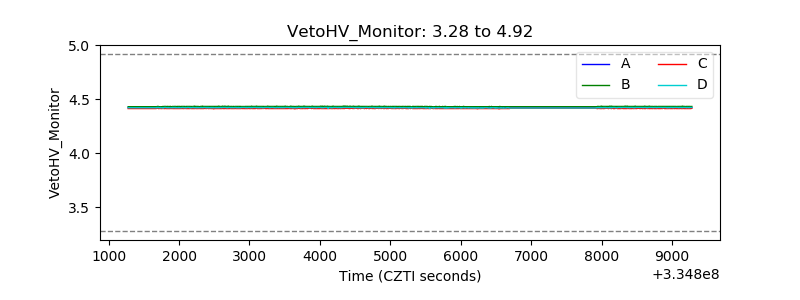 |
| Veto LLD | 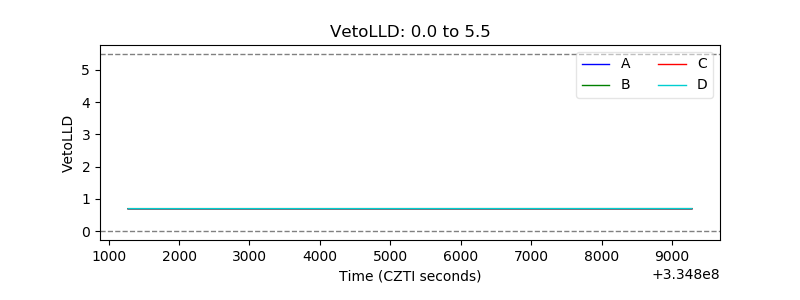 |
| Alpha Counter | 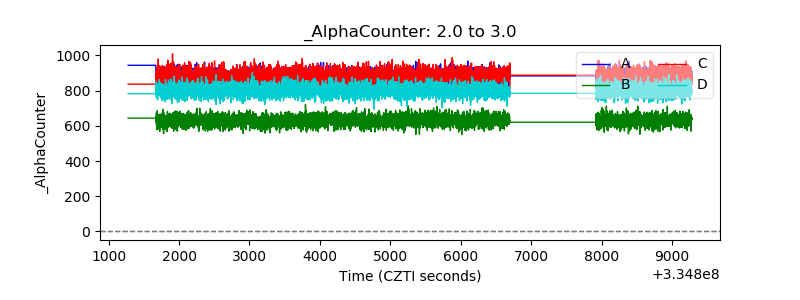 |
| _CPM_Rate | 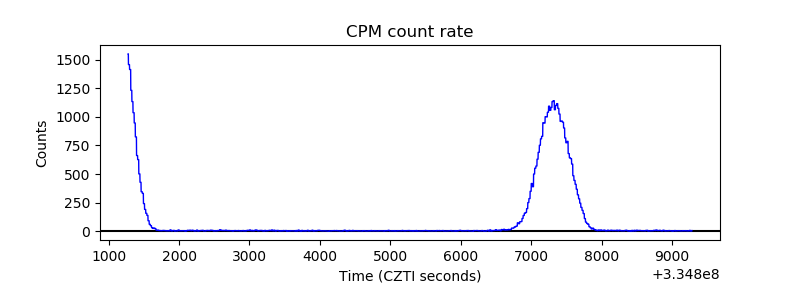 |
| CZT Counter | 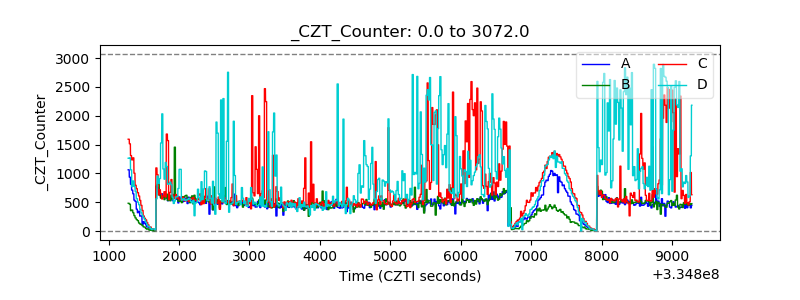 |
| +2.5 Volts monitor |  |
| +5 Volts monitor |  |
| _ROLL_ROT | 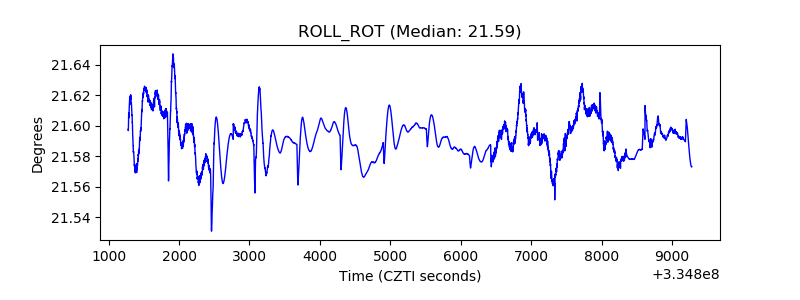 |
| _Roll_DEC | 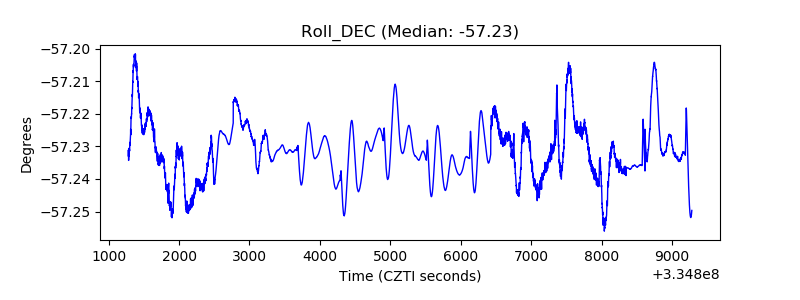 |
| _Roll_RA | 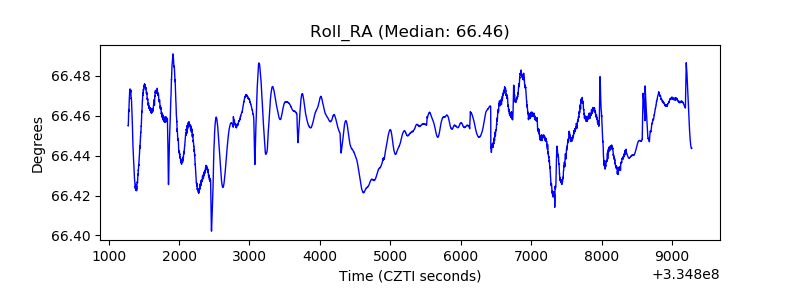 |
| Veto Counter | 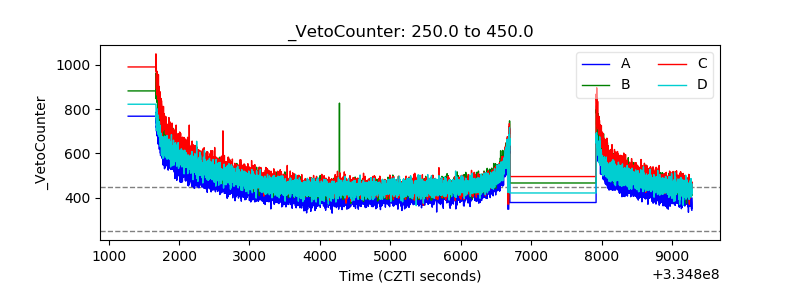 |