| Param | Original file | Final file |
|---|---|---|
| Filename | modeM0/AS1A09_008T02_9000003796_26332cztM0_level2.evt | modeM0/AS1A09_008T02_9000003796_26332cztM0_level2_quad_clean.evt |
| Size (bytes) | 618,462,720 | 101,793,600 |
| Size | 589.8 MB | 97.1 MB |
| Events in quadrant A | 3,070,053 | 691,958 |
| Events in quadrant B | 3,152,386 | 712,413 |
| Events in quadrant C | 4,305,551 | 672,615 |
| Events in quadrant D | 7,759,220 | 549,157 |
| Mode M0 | |||
|---|---|---|---|
| Quadrant | BADHDUFLAG | Total packets | Discarded packets |
| A | 0 | 13320 | 0 |
| B | 0 | 13437 | 0 |
| C | 0 | 16822 | 0 |
| D | 0 | 27550 | 0 |
| Mode M9 | |||
|---|---|---|---|
| Quadrant | BADHDUFLAG | Total packets | Discarded packets |
| A | 0 | 9 | 0 |
| B | 0 | 9 | 0 |
| C | 0 | 9 | 0 |
| D | 0 | 9 | 0 |
| Quadrant | Total seconds | Saturated seconds | Saturation percentage |
|---|---|---|---|
| A | 6539 | 22 | 0.336443% |
| B | 6540 | 43 | 0.657492% |
| C | 6540 | 334 | 5.107034% |
| D | 6540 | 1616 | 24.709480% |
Noise dominated data is calculated using 1-second bins in cleaned event files. If a bin has >2000 counts, and if more than 50% of those come from <1% of pixels, then it is considered to be noise-dominated and hence unusable.
| Quadrant | # 1 sec bins | Bins with >0 counts | Bins with >2000 counts | High rate bins dominated by noise | Noise dominated (total time) | Noise dominated (detector-on time) | Marked lightcurve |
|---|---|---|---|---|---|---|---|
| A | 7474 | 6540 | 0 | 0 | 0.00% | 0.00% | 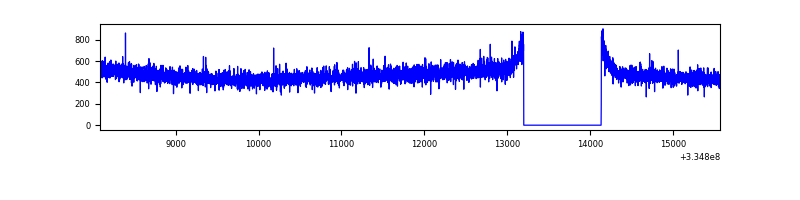 |
| B | 7475 | 6541 | 0 | 0 | 0.00% | 0.00% | 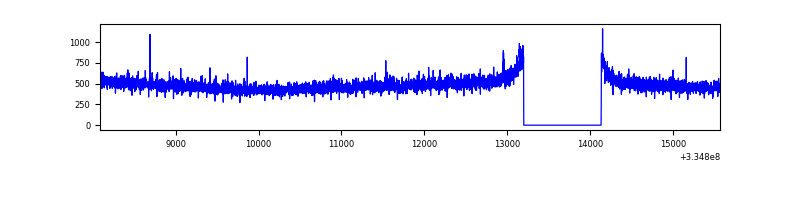 |
| C | 7475 | 6541 | 154 | 154 | 2.06% | 2.35% | 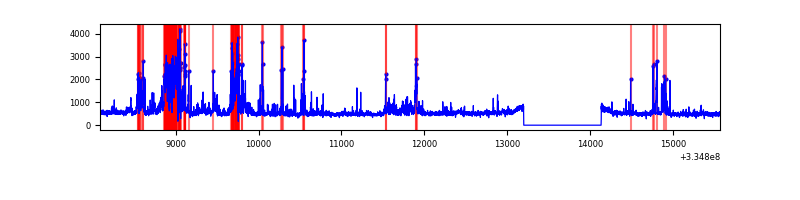 |
| D | 7475 | 6540 | 1171 | 1171 | 15.67% | 17.91% | 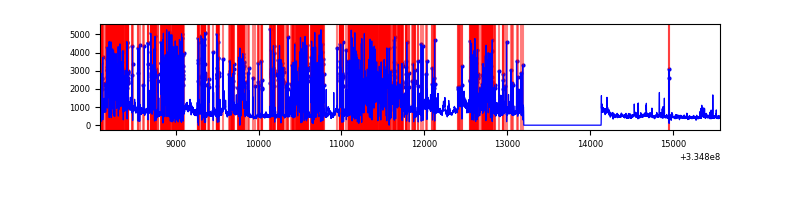 |
Top three noisy pixels from each quadrant. If the there are fewer than three noisy pixels in the level2.evt file, extra rows are filled as -1
| Pixel properties | Quadrant properties | ||||||
|---|---|---|---|---|---|---|---|
| Quadrant | DetID | PixID | Counts | Sigma | Mean | Median | Sigma |
| A | 13 | 254 | 10309 | 60.11 | 796 | 779 | 158.5 |
| A | 3 | 137 | 7321 | 41.26 | 796 | 779 | 158.5 |
| A | 0 | 226 | 6679 | 37.21 | 796 | 779 | 158.5 |
| B | 12 | 111 | 18208 | 114.46 | 798 | 777 | 152.3 |
| B | 11 | 111 | 16121 | 100.75 | 798 | 777 | 152.3 |
| B | 14 | 111 | 14951 | 93.07 | 798 | 777 | 152.3 |
| C | 3 | 233 | 874439 | 4863.23 | 775 | 781 | 179.6 |
| C | 2 | 16 | 276612 | 1535.42 | 775 | 781 | 179.6 |
| C | 14 | 238 | 123371 | 682.4 | 775 | 781 | 179.6 |
| D | 1 | 52 | 4618676 | 29288.86 | 671 | 655 | 157.7 |
| D | 12 | 227 | 577635 | 3659.38 | 671 | 655 | 157.7 |
| D | 2 | 234 | 26408 | 163.33 | 671 | 655 | 157.7 |
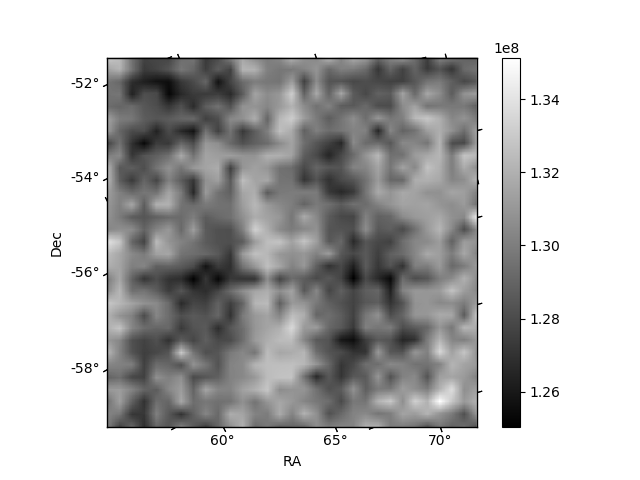
Histogram calculated using DETX and DETY for each event in the final _common_clean file
| Quadrant A | 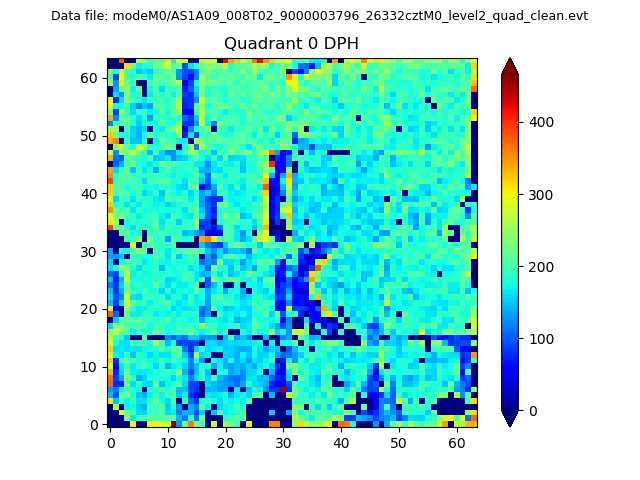 |
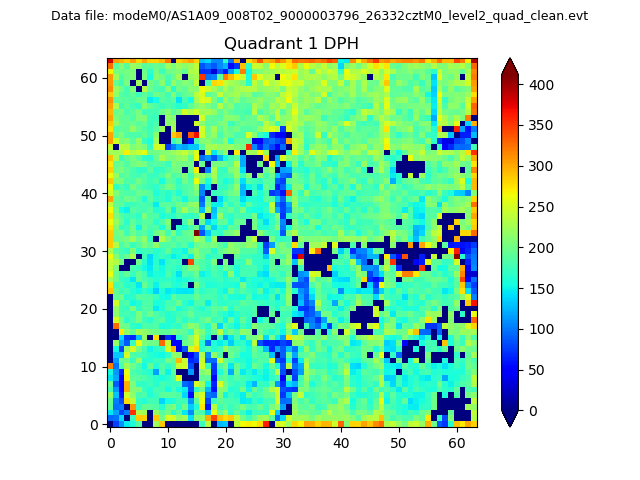 |
Quadrant B |
|---|---|---|---|
| Quadrant D | 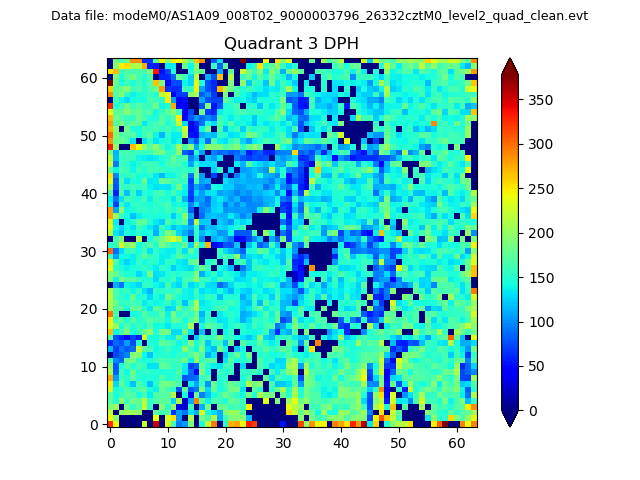 |
 |
Quadrant C |
| Plot type | Count rate plots | Images |
|---|---|---|
| Comparison with Poisson distribution Blue bars denote a histogram of data divided into 1 sec bins. Red curve is a Poisson curve with rate = median count rate of data. |
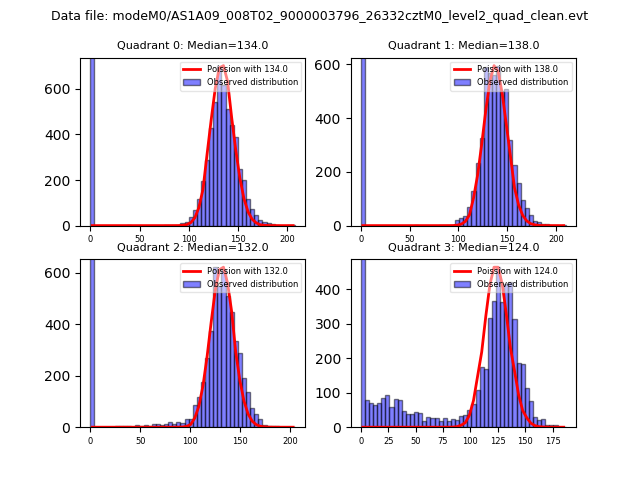 |
 |
| Quadrant-wise count rates Data is divided into 100 sec bins |
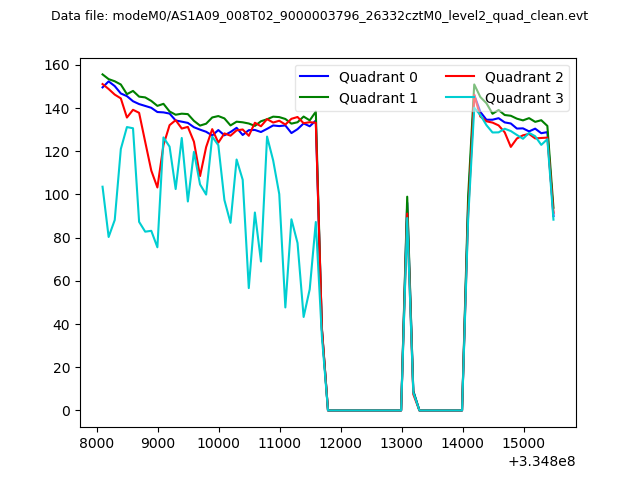 |
|
| Module-wise count rates for Quadrant A Data is divided into 100 sec bins |
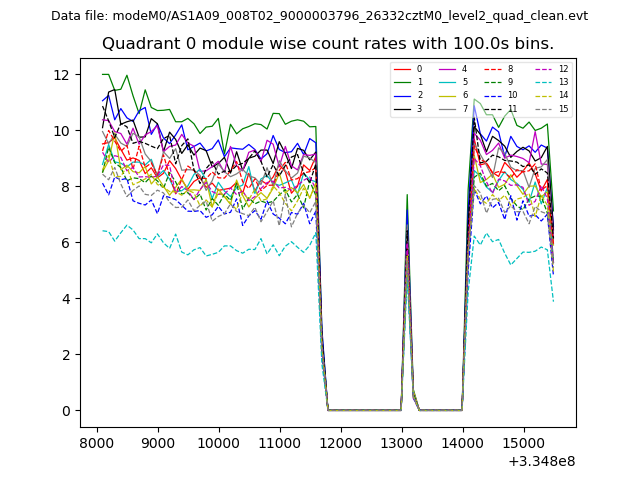 |
 |
| Module-wise count rates for Quadrant B Data is divided into 100 sec bins |
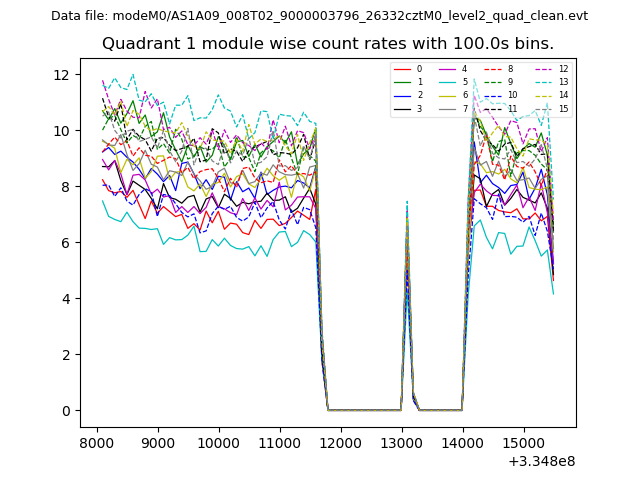 |
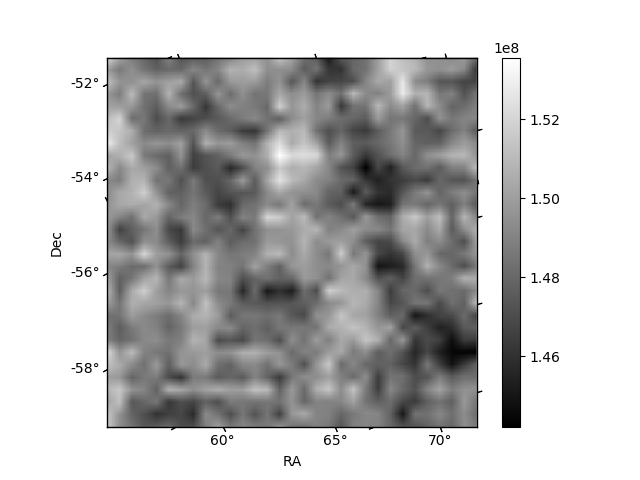 |
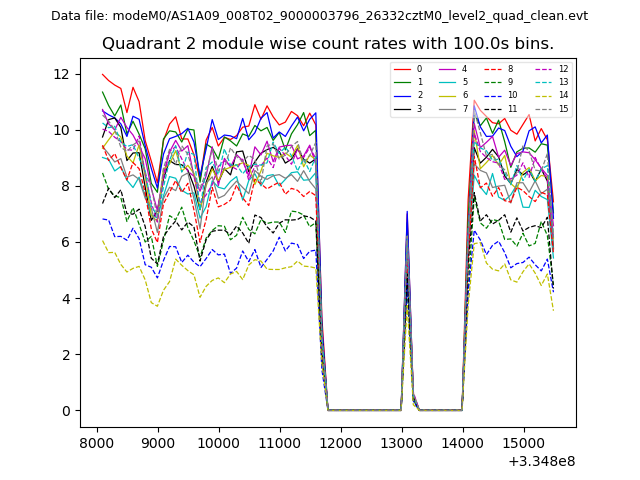
| Module-wise count rates for Quadrant C Data is divided into 100 sec bins |
 |
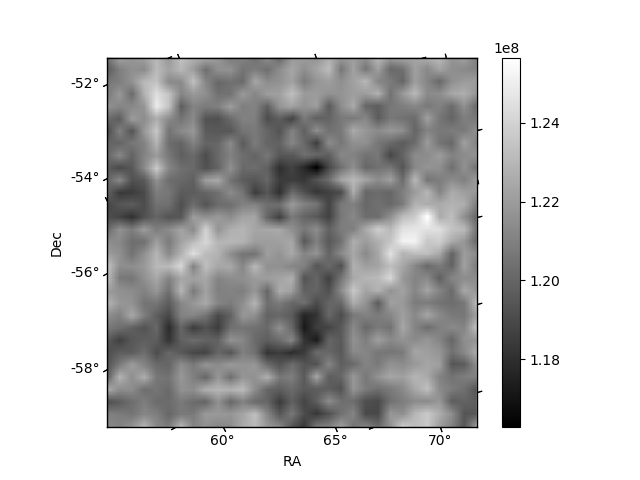 |
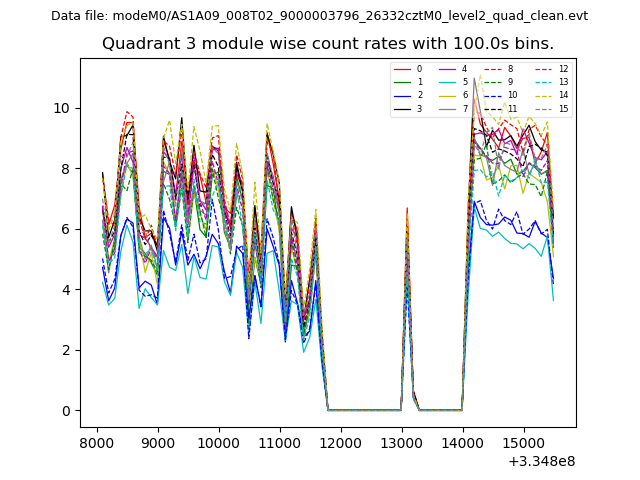
| Module-wise count rates for Quadrant D Data is divided into 100 sec bins |
 |
 |
| Parameter | Plot |
|---|---|
| CZT HV Monitor | 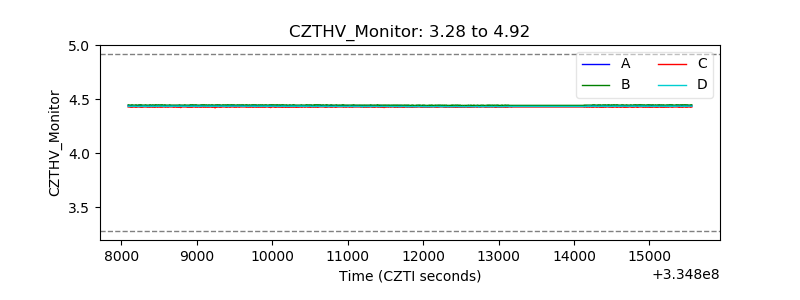 |
| D_VDD | 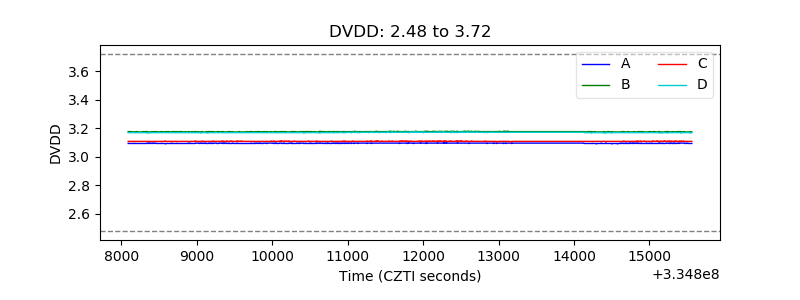 |
| Temperature 1 |  |
| Veto HV Monitor | 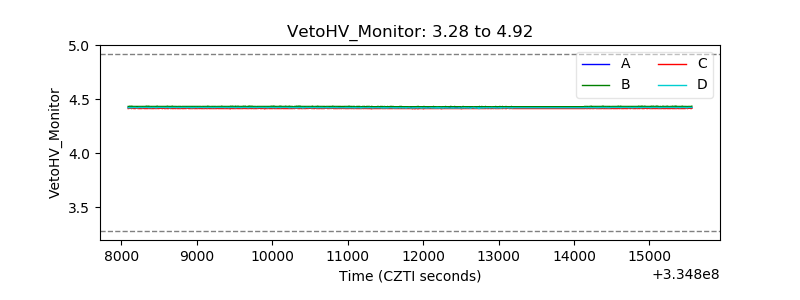 |
| Veto LLD | 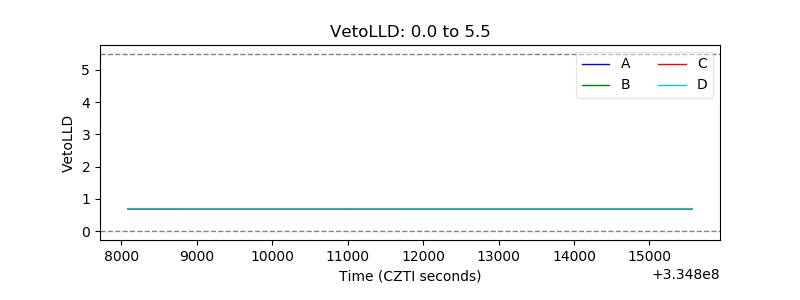 |
| Alpha Counter | 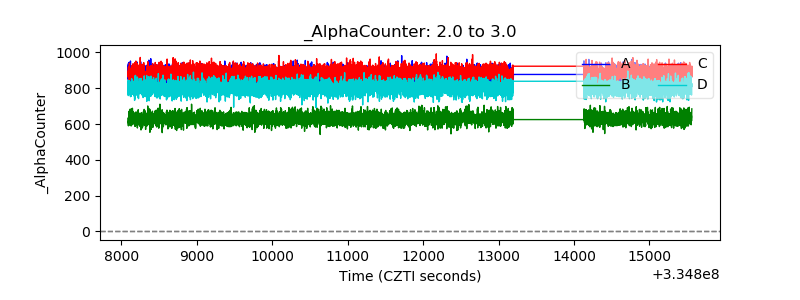 |
| _CPM_Rate | 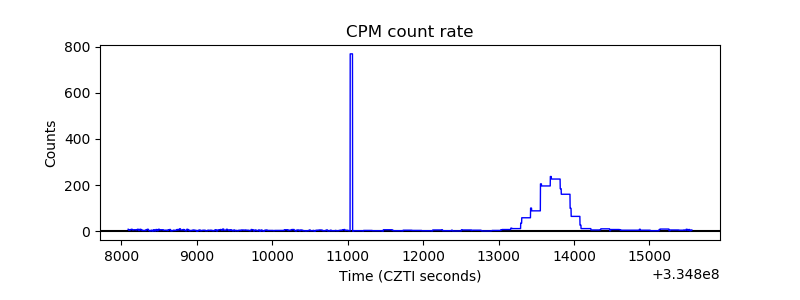 |
| CZT Counter | 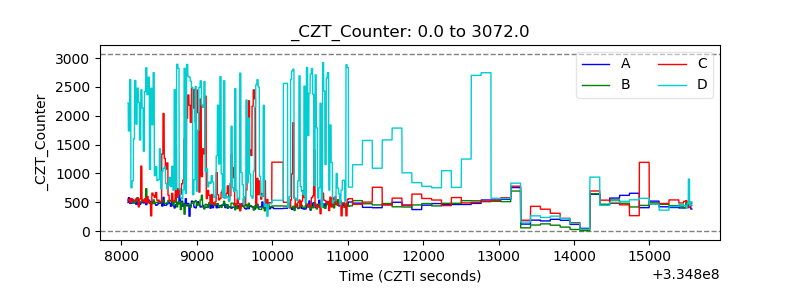 |
| +2.5 Volts monitor |  |
| +5 Volts monitor |  |
| _ROLL_ROT | 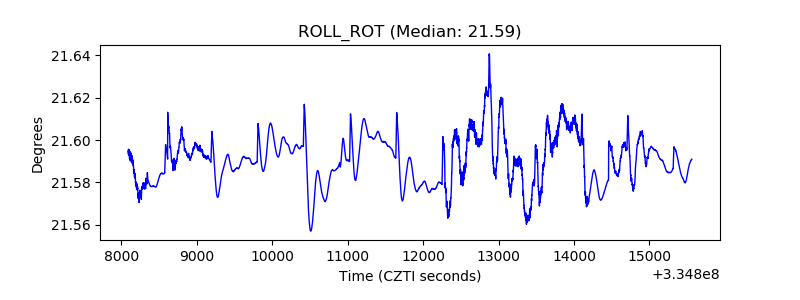 |
| _Roll_DEC | 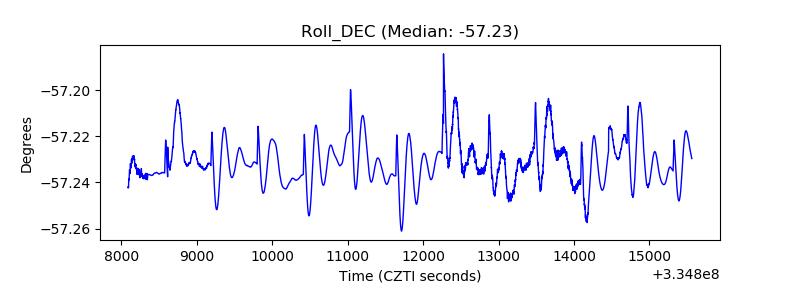 |
| _Roll_RA |  |
| Veto Counter | 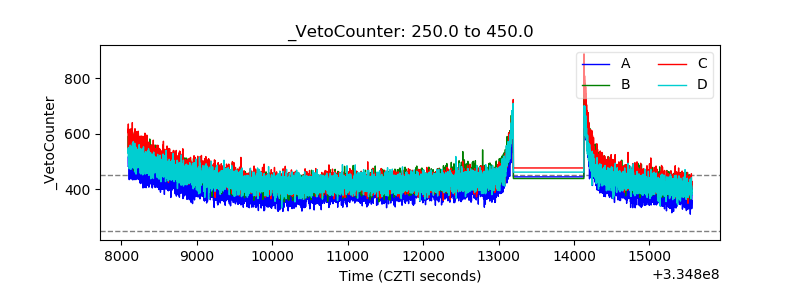 |