| Param | Original file | Final file |
|---|---|---|
| Filename | modeM0/AS1A09_008T02_9000003796_26333cztM0_level2.evt | modeM0/AS1A09_008T02_9000003796_26333cztM0_level2_quad_clean.evt |
| Size (bytes) | 555,243,840 | 100,687,680 |
| Size | 529.5 MB | 96.0 MB |
| Events in quadrant A | 3,055,937 | 668,380 |
| Events in quadrant B | 3,163,098 | 687,034 |
| Events in quadrant C | 3,592,878 | 661,193 |
| Events in quadrant D | 6,555,098 | 571,261 |
| Mode M0 | |||
|---|---|---|---|
| Quadrant | BADHDUFLAG | Total packets | Discarded packets |
| A | 0 | 13501 | 0 |
| B | 0 | 13678 | 0 |
| C | 0 | 14791 | 0 |
| D | 0 | 24044 | 0 |
| Mode M9 | |||
|---|---|---|---|
| Quadrant | BADHDUFLAG | Total packets | Discarded packets |
| A | 0 | 5 | 0 |
| B | 0 | 5 | 0 |
| C | 0 | 5 | 0 |
| D | 0 | 5 | 0 |
| Quadrant | Total seconds | Saturated seconds | Saturation percentage |
|---|---|---|---|
| A | 6611 | 99 | 1.497504% |
| B | 6612 | 107 | 1.618270% |
| C | 6612 | 246 | 3.720508% |
| D | 6612 | 1222 | 18.481549% |
Noise dominated data is calculated using 1-second bins in cleaned event files. If a bin has >2000 counts, and if more than 50% of those come from <1% of pixels, then it is considered to be noise-dominated and hence unusable.
| Quadrant | # 1 sec bins | Bins with >0 counts | Bins with >2000 counts | High rate bins dominated by noise | Noise dominated (total time) | Noise dominated (detector-on time) | Marked lightcurve |
|---|---|---|---|---|---|---|---|
| A | 7086 | 6612 | 0 | 0 | 0.00% | 0.00% | 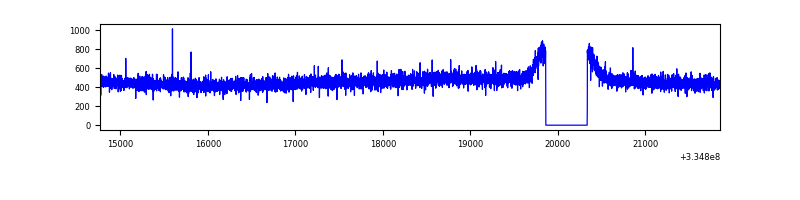 |
| B | 7087 | 6613 | 7 | 7 | 0.10% | 0.11% | 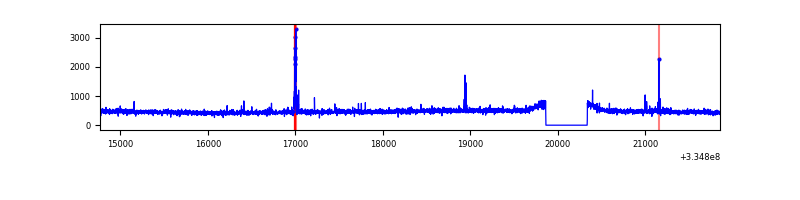 |
| C | 7087 | 6613 | 37 | 37 | 0.52% | 0.56% | 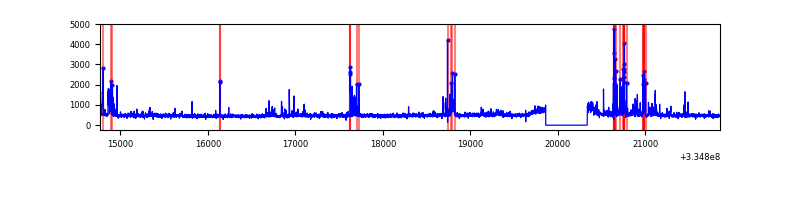 |
| D | 7087 | 6610 | 822 | 822 | 11.60% | 12.44% | 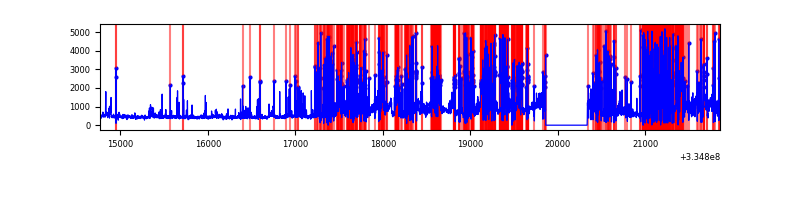 |
Top three noisy pixels from each quadrant. If the there are fewer than three noisy pixels in the level2.evt file, extra rows are filled as -1
| Pixel properties | Quadrant properties | ||||||
|---|---|---|---|---|---|---|---|
| Quadrant | DetID | PixID | Counts | Sigma | Mean | Median | Sigma |
| A | 13 | 254 | 10596 | 61.89 | 792 | 773 | 158.7 |
| A | 3 | 137 | 7357 | 41.48 | 792 | 773 | 158.7 |
| A | 0 | 226 | 6475 | 35.93 | 792 | 773 | 158.7 |
| B | 12 | 16 | 57167 | 375.15 | 789 | 767 | 150.3 |
| B | 12 | 111 | 18336 | 116.86 | 789 | 767 | 150.3 |
| B | 11 | 111 | 16736 | 106.22 | 789 | 767 | 150.3 |
| C | 2 | 16 | 320766 | 1789.91 | 772 | 778 | 178.8 |
| C | 3 | 233 | 139135 | 773.93 | 772 | 778 | 178.8 |
| C | 14 | 238 | 123951 | 688.99 | 772 | 778 | 178.8 |
| D | 1 | 52 | 3821475 | 23255.52 | 696 | 680 | 164.3 |
| D | 11 | 176 | 78970 | 476.52 | 696 | 680 | 164.3 |
| D | 2 | 234 | 27138 | 161.04 | 696 | 680 | 164.3 |
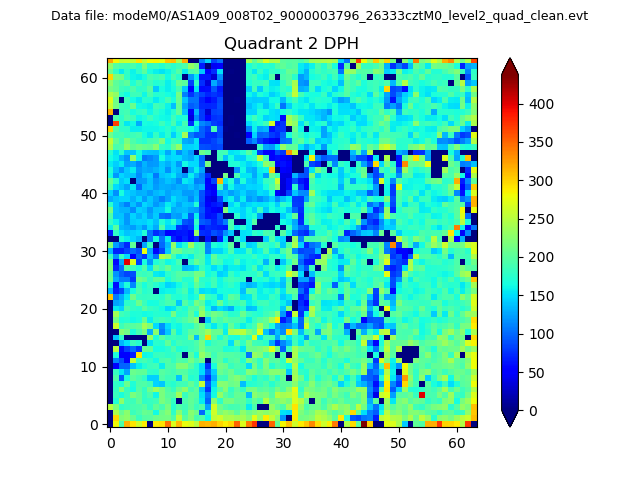
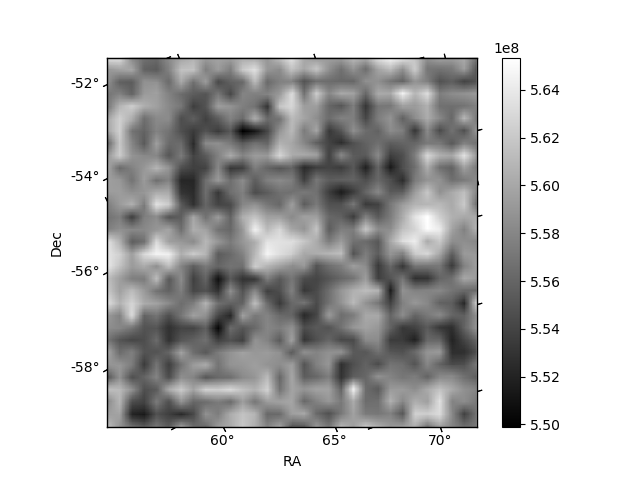
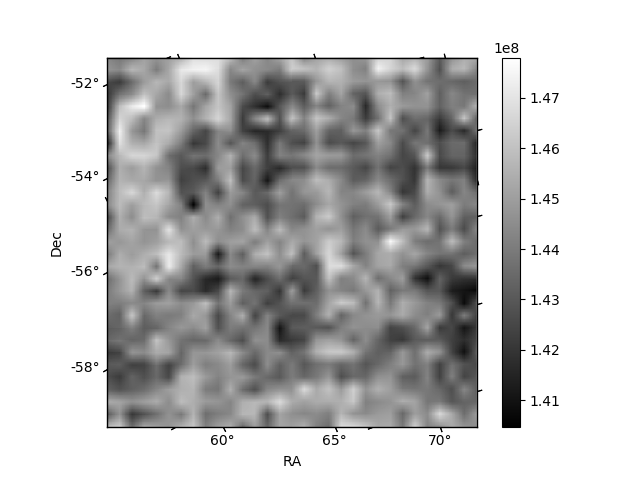
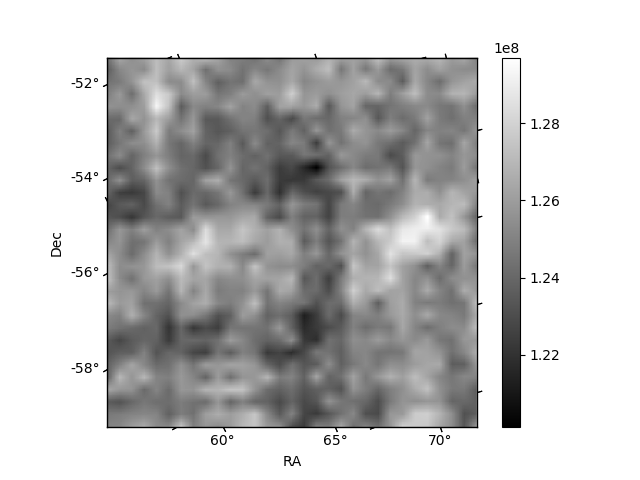
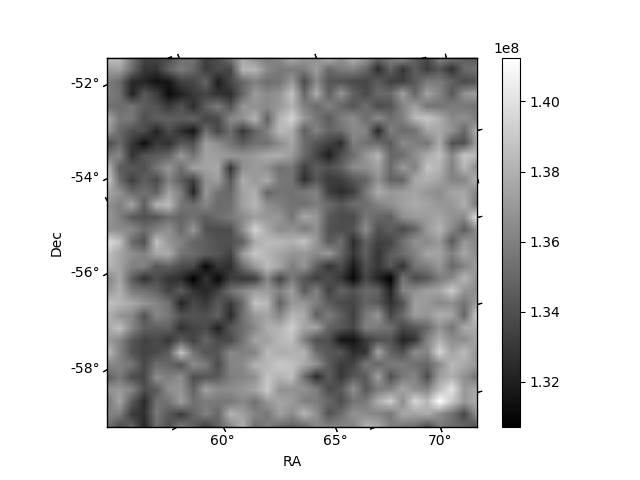
Histogram calculated using DETX and DETY for each event in the final _common_clean file
| Quadrant A | 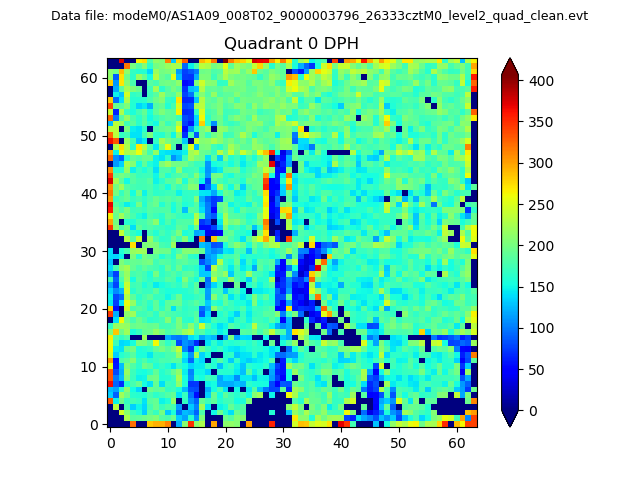 |
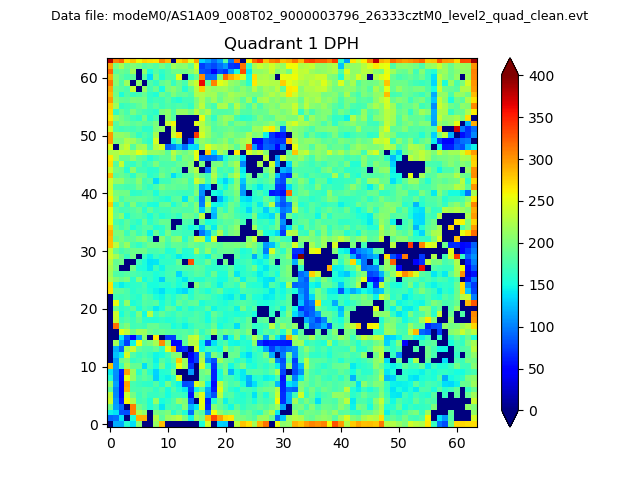 |
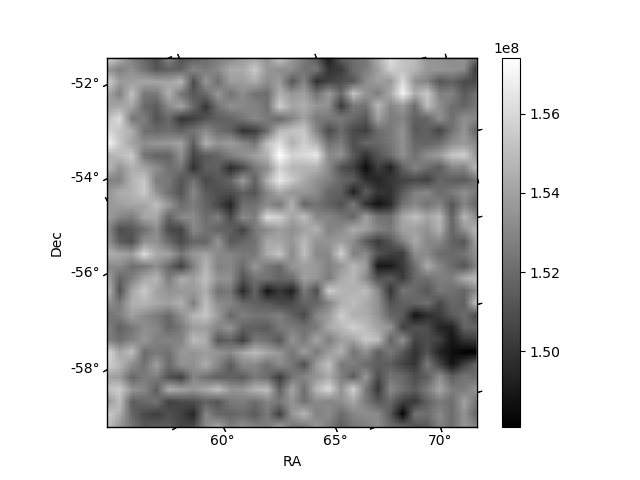
Quadrant B |
|---|---|---|---|
| Quadrant D | 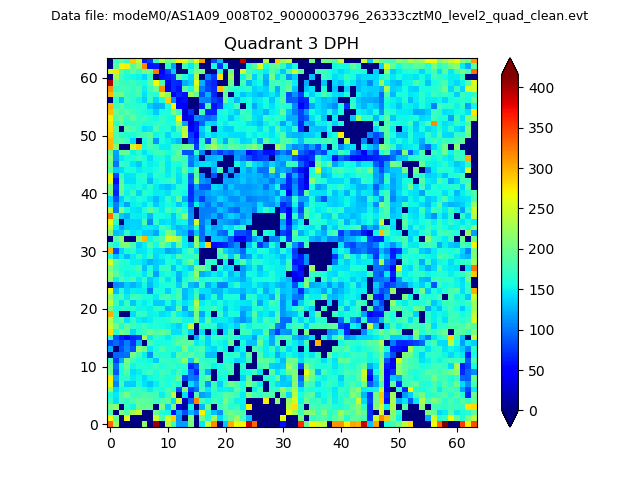 |
 |
Quadrant C |
| Plot type | Count rate plots | Images |
|---|---|---|
| Comparison with Poisson distribution Blue bars denote a histogram of data divided into 1 sec bins. Red curve is a Poisson curve with rate = median count rate of data. |
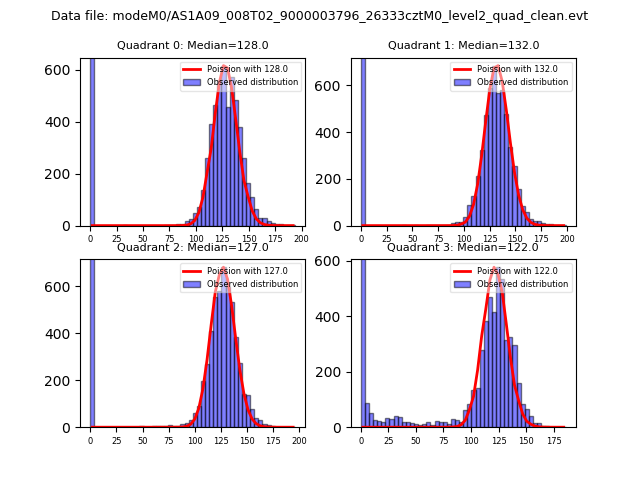 |
 |
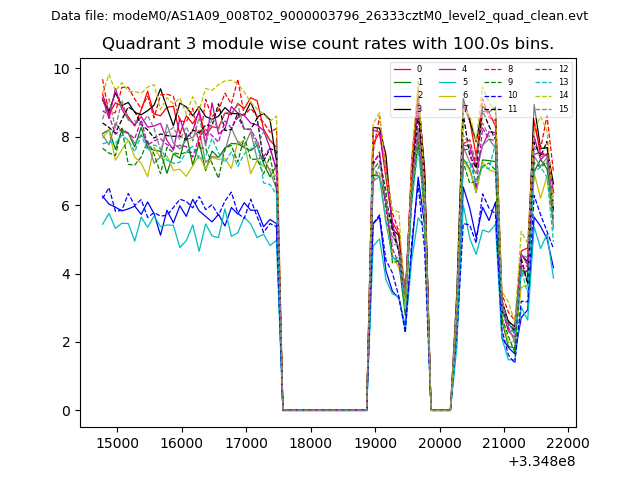
| Quadrant-wise count rates Data is divided into 100 sec bins |
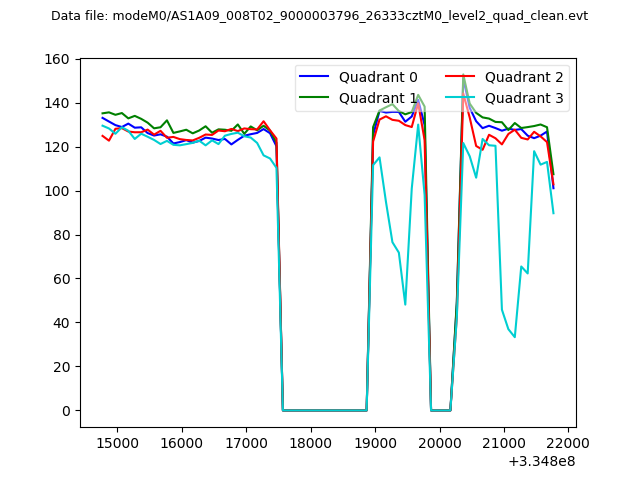 |
|
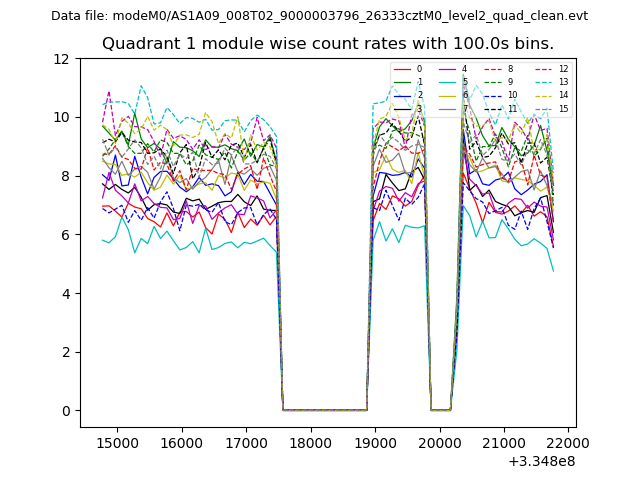
| Module-wise count rates for Quadrant A Data is divided into 100 sec bins |
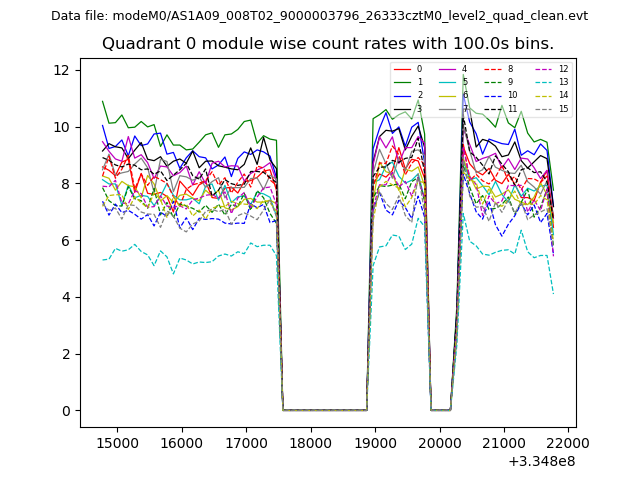 |
 |
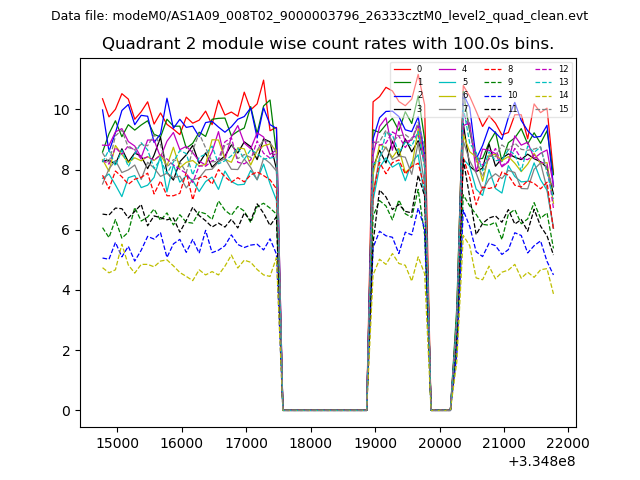
| Module-wise count rates for Quadrant B Data is divided into 100 sec bins |
 |
 |
| Module-wise count rates for Quadrant C Data is divided into 100 sec bins |
 |
 |
| Module-wise count rates for Quadrant D Data is divided into 100 sec bins |
 |
 |
| Parameter | Plot |
|---|---|
| CZT HV Monitor | 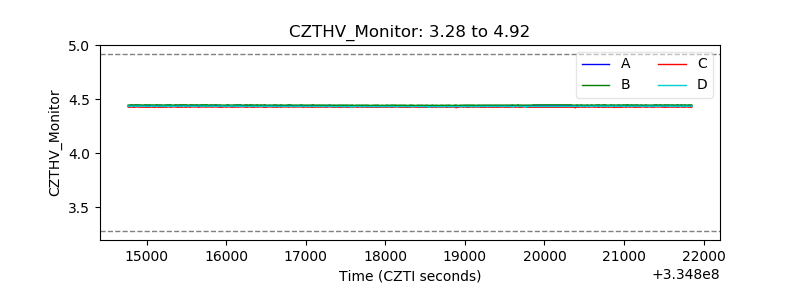 |
| D_VDD | 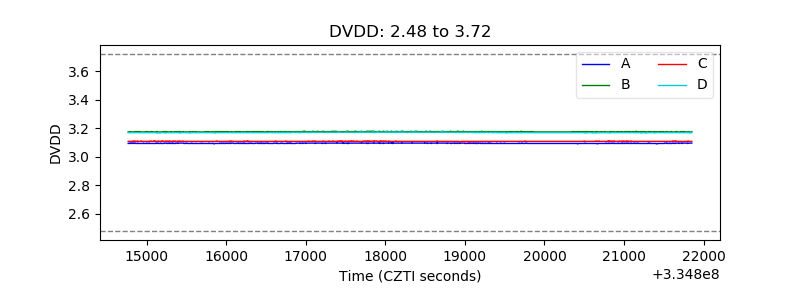 |
| Temperature 1 | 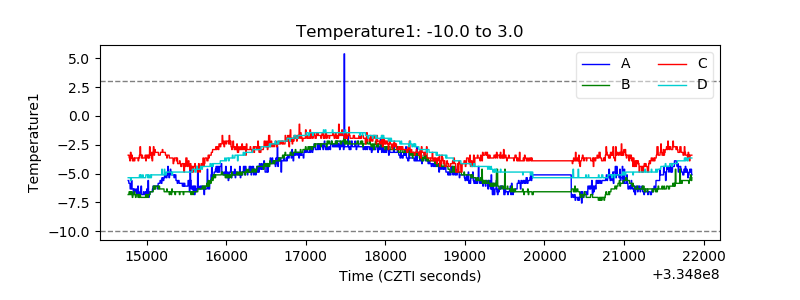 |
| Veto HV Monitor |  |
| Veto LLD | 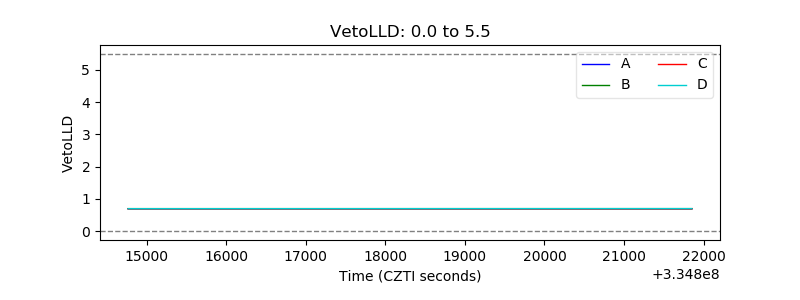 |
| Alpha Counter | 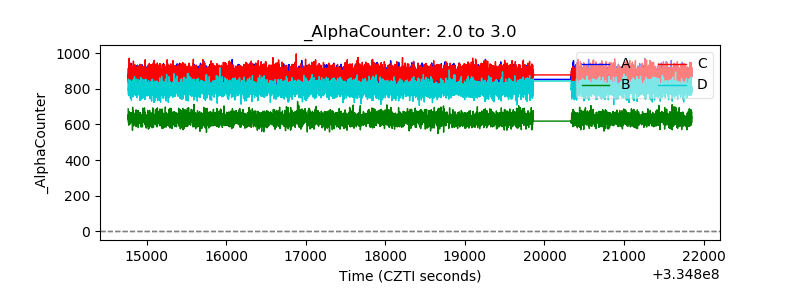 |
| _CPM_Rate |  |
| CZT Counter | 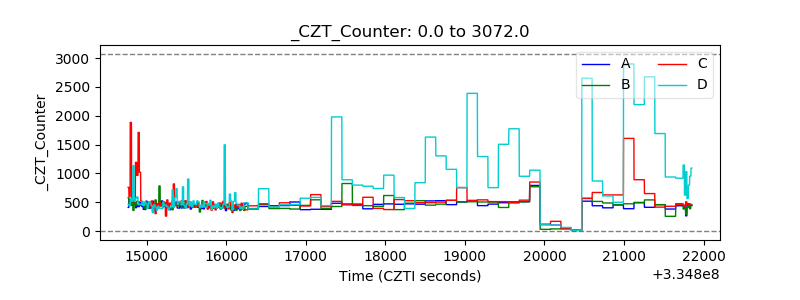 |
| +2.5 Volts monitor |  |
| +5 Volts monitor |  |
| _ROLL_ROT | 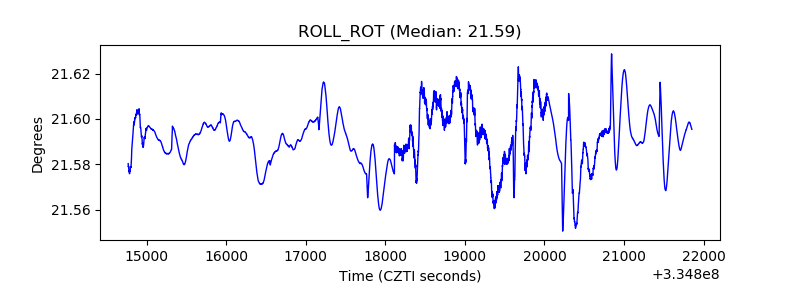 |
| _Roll_DEC | 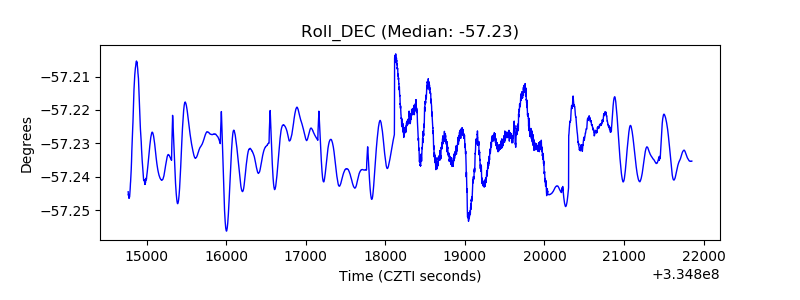 |
| _Roll_RA | 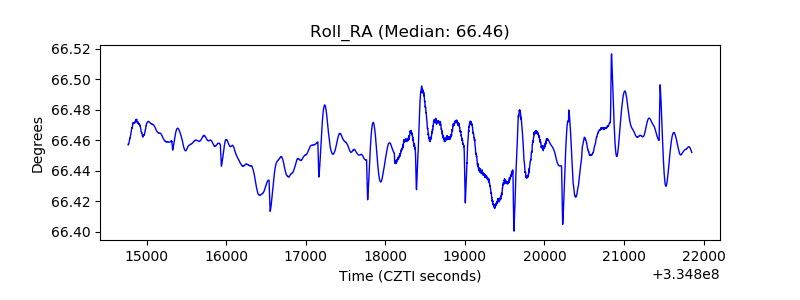 |
| Veto Counter | 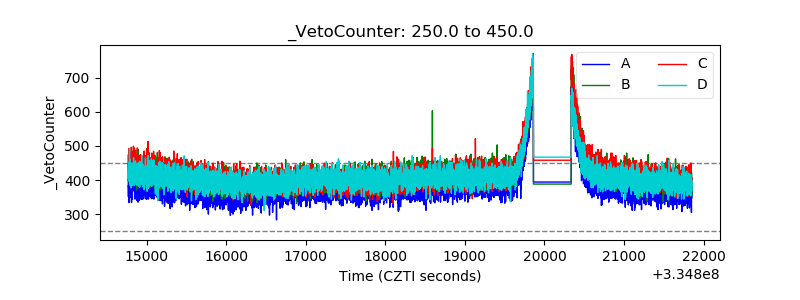 |