| Param | Original file | Final file |
|---|---|---|
| Filename | modeM0/AS1A09_008T02_9000003796_26335cztM0_level2.evt | modeM0/AS1A09_008T02_9000003796_26335cztM0_level2_quad_clean.evt |
| Size (bytes) | 440,052,480 | 82,298,880 |
| Size | 419.7 MB | 78.5 MB |
| Events in quadrant A | 2,619,036 | 539,808 |
| Events in quadrant B | 2,695,687 | 554,415 |
| Events in quadrant C | 3,120,284 | 528,021 |
| Events in quadrant D | 4,507,137 | 474,075 |
| Mode M0 | |||
|---|---|---|---|
| Quadrant | BADHDUFLAG | Total packets | Discarded packets |
| A | 0 | 11594 | 0 |
| B | 0 | 11749 | 0 |
| C | 0 | 12874 | 0 |
| D | 0 | 17153 | 0 |
| Mode M9 | |||
|---|---|---|---|
| Quadrant | BADHDUFLAG | Total packets | Discarded packets |
| A | 0 | 2 | 0 |
| B | 0 | 2 | 0 |
| C | 0 | 2 | 0 |
| D | 0 | 2 | 0 |
| Quadrant | Total seconds | Saturated seconds | Saturation percentage |
|---|---|---|---|
| A | 5657 | 127 | 2.245006% |
| B | 5658 | 145 | 2.562743% |
| C | 5657 | 300 | 5.303164% |
| D | 5657 | 686 | 12.126569% |
Noise dominated data is calculated using 1-second bins in cleaned event files. If a bin has >2000 counts, and if more than 50% of those come from <1% of pixels, then it is considered to be noise-dominated and hence unusable.
| Quadrant | # 1 sec bins | Bins with >0 counts | Bins with >2000 counts | High rate bins dominated by noise | Noise dominated (total time) | Noise dominated (detector-on time) | Marked lightcurve |
|---|---|---|---|---|---|---|---|
| A | 5852 | 5658 | 0 | 0 | 0.00% | 0.00% | 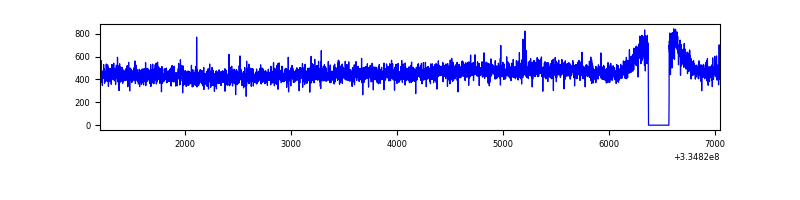 |
| B | 5853 | 5659 | 3 | 3 | 0.05% | 0.05% | 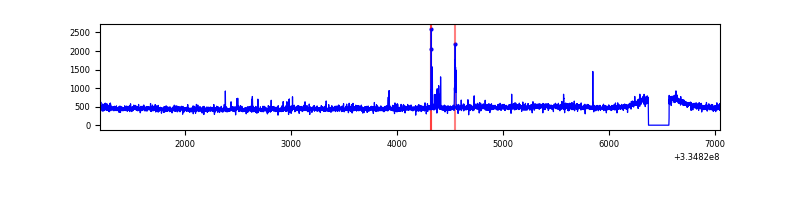 |
| C | 5852 | 5658 | 101 | 101 | 1.73% | 1.79% | 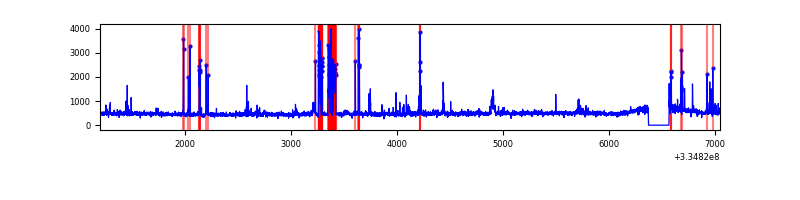 |
| D | 5852 | 5658 | 352 | 352 | 6.02% | 6.22% | 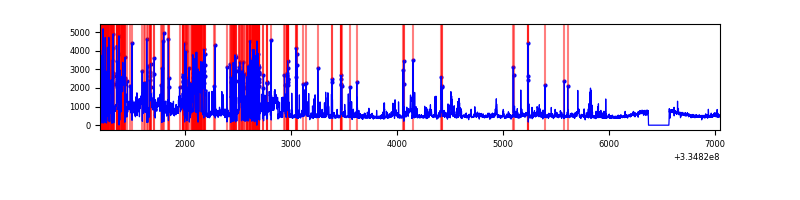 |
Top three noisy pixels from each quadrant. If the there are fewer than three noisy pixels in the level2.evt file, extra rows are filled as -1
| Pixel properties | Quadrant properties | ||||||
|---|---|---|---|---|---|---|---|
| Quadrant | DetID | PixID | Counts | Sigma | Mean | Median | Sigma |
| A | 13 | 254 | 9078 | 61.58 | 678 | 663 | 136.7 |
| A | 3 | 137 | 6395 | 41.94 | 678 | 663 | 136.7 |
| A | 0 | 226 | 5683 | 36.73 | 678 | 663 | 136.7 |
| B | 5 | 172 | 32347 | 244.5 | 674 | 655 | 129.6 |
| B | 12 | 111 | 15852 | 117.24 | 674 | 655 | 129.6 |
| B | 11 | 111 | 14532 | 107.06 | 674 | 655 | 129.6 |
| C | 2 | 16 | 367364 | 2413.92 | 649 | 651 | 151.9 |
| C | 3 | 233 | 118515 | 775.85 | 649 | 651 | 151.9 |
| C | 14 | 238 | 104006 | 680.34 | 649 | 651 | 151.9 |
| D | 1 | 52 | 2033346 | 13740.95 | 620 | 602 | 147.9 |
| D | 12 | 227 | 54555 | 364.71 | 620 | 602 | 147.9 |
| D | 11 | 176 | 48684 | 325.02 | 620 | 602 | 147.9 |
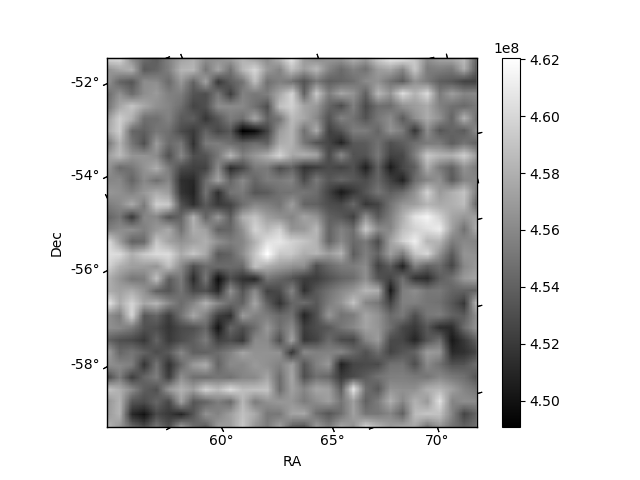
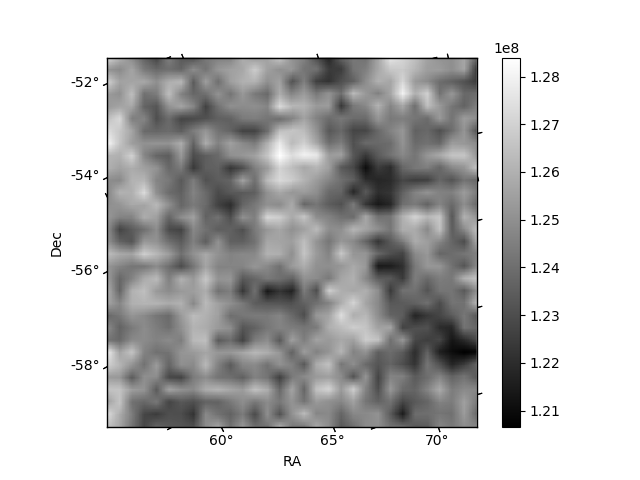
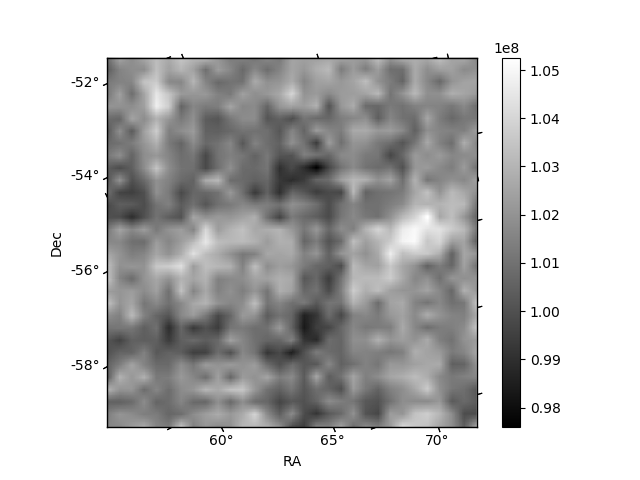
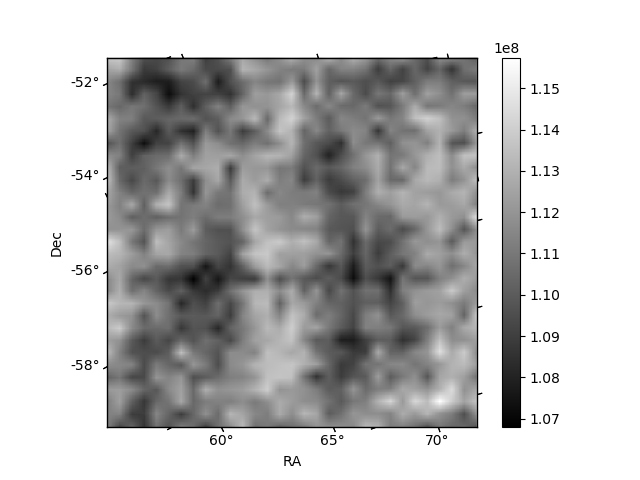
Histogram calculated using DETX and DETY for each event in the final _common_clean file
| Quadrant A | 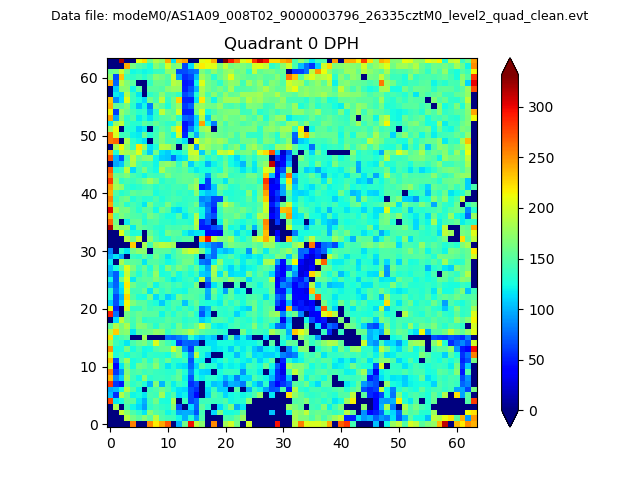 |
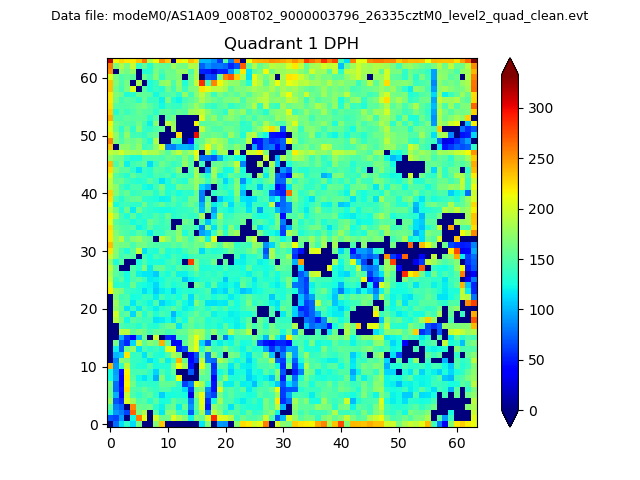 |
Quadrant B |
|---|---|---|---|
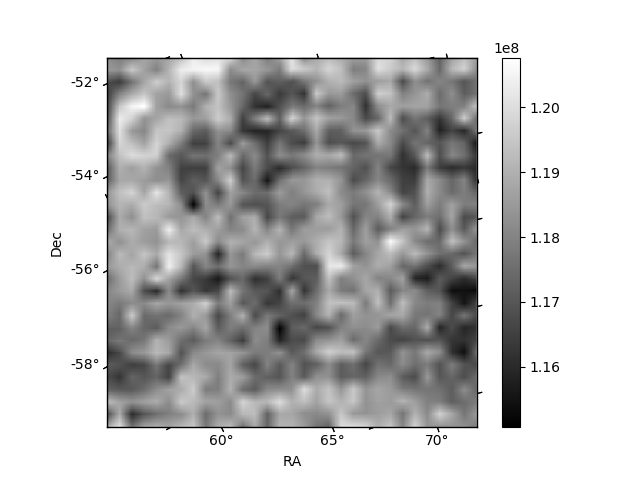
| Quadrant D | 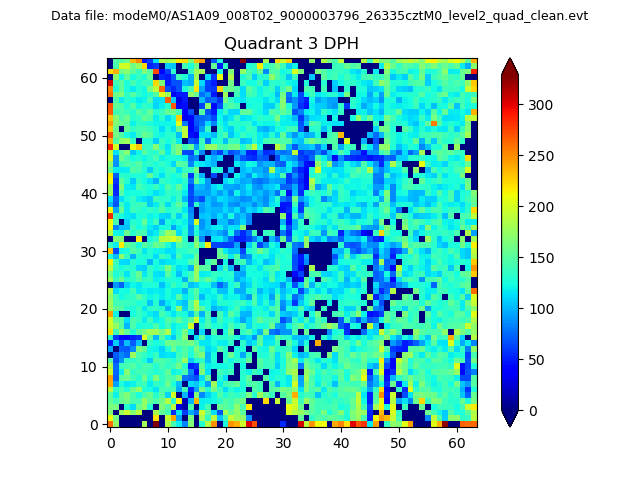 |
 |
Quadrant C |
| Plot type | Count rate plots | Images |
|---|---|---|
| Comparison with Poisson distribution Blue bars denote a histogram of data divided into 1 sec bins. Red curve is a Poisson curve with rate = median count rate of data. |
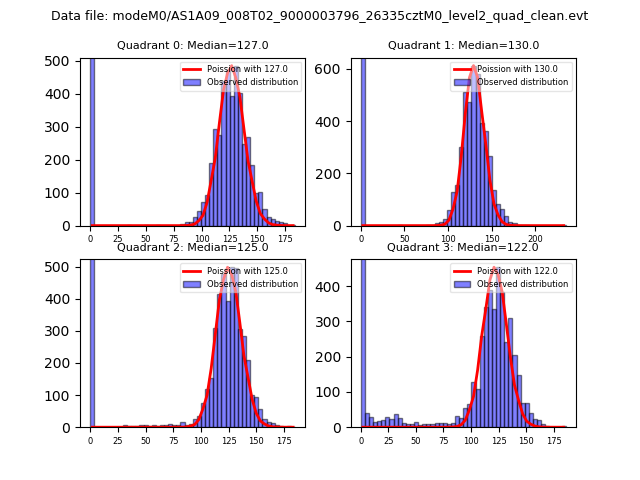 |
 |
| Quadrant-wise count rates Data is divided into 100 sec bins |
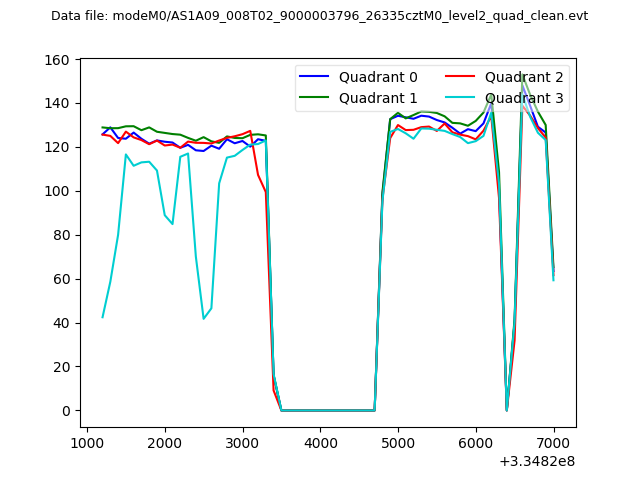 |
|
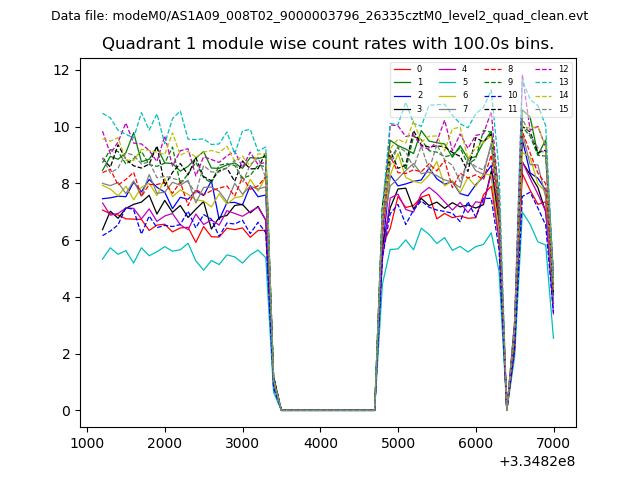
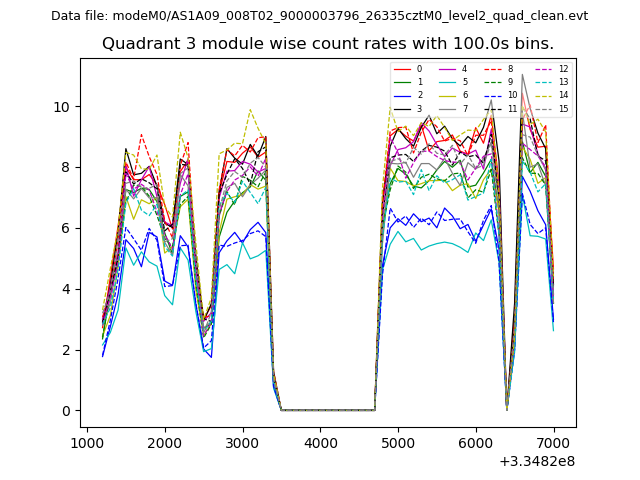
| Module-wise count rates for Quadrant A Data is divided into 100 sec bins |
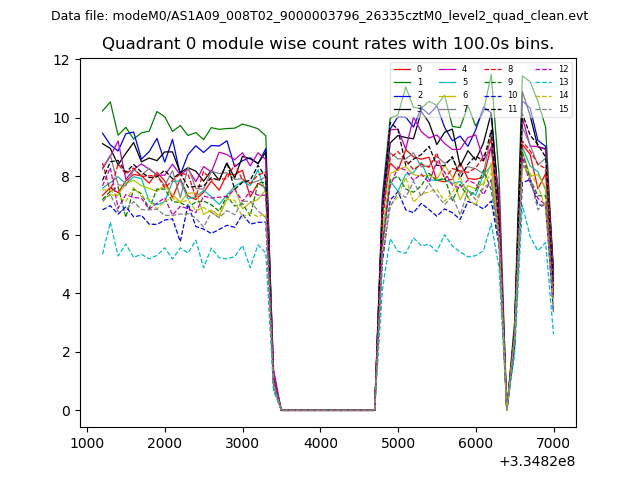 |
 |
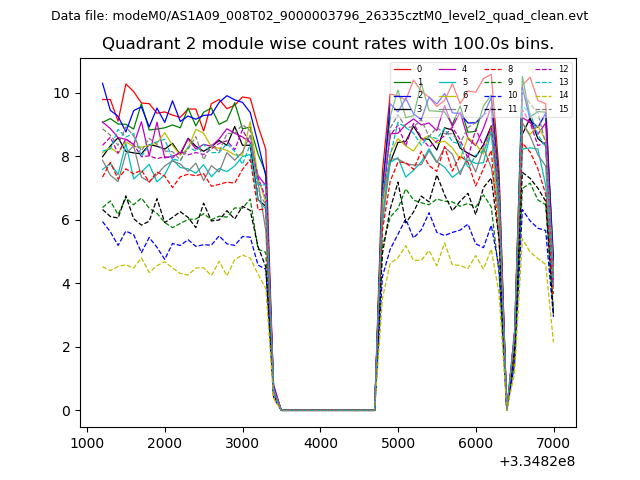
| Module-wise count rates for Quadrant B Data is divided into 100 sec bins |
 |
 |
| Module-wise count rates for Quadrant C Data is divided into 100 sec bins |
 |
 |
| Module-wise count rates for Quadrant D Data is divided into 100 sec bins |
 |
 |
| Parameter | Plot |
|---|---|
| CZT HV Monitor | 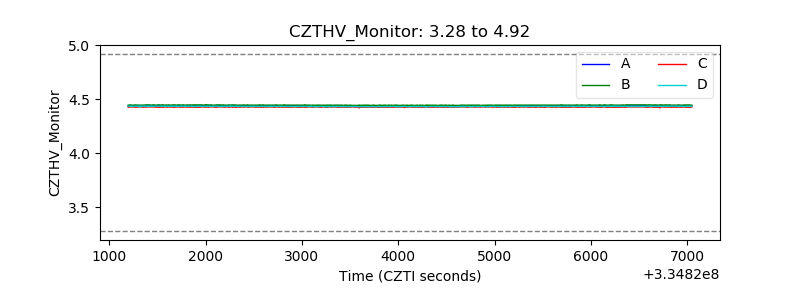 |
| D_VDD | 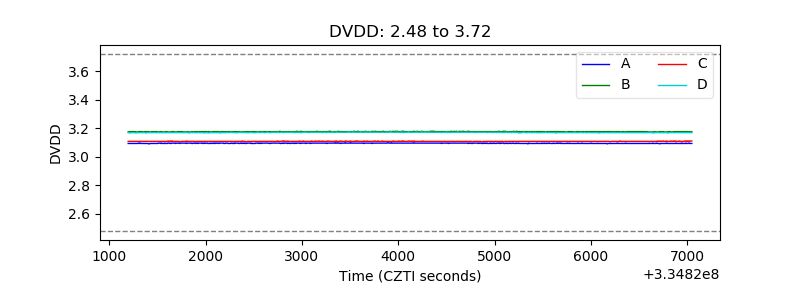 |
| Temperature 1 | 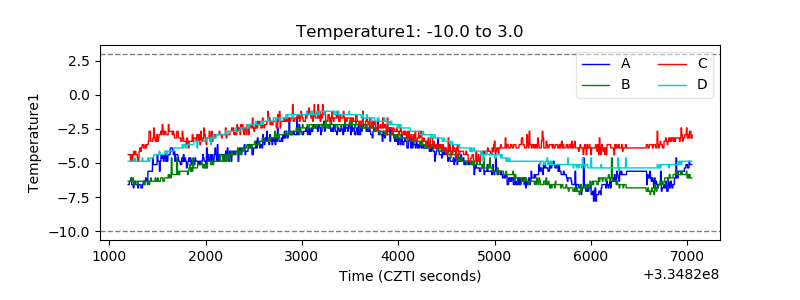 |
| Veto HV Monitor | 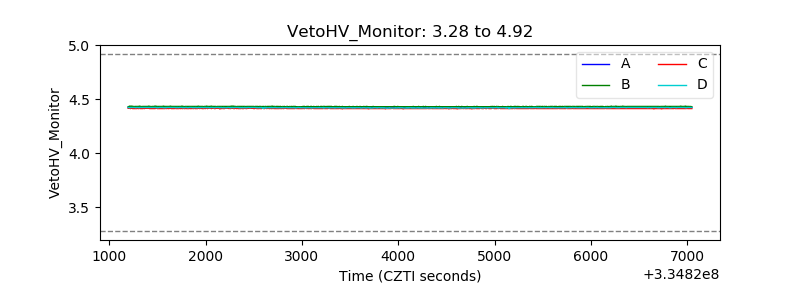 |
| Veto LLD | 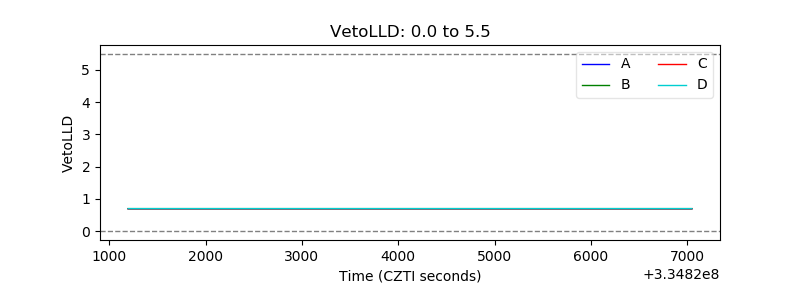 |
| Alpha Counter | 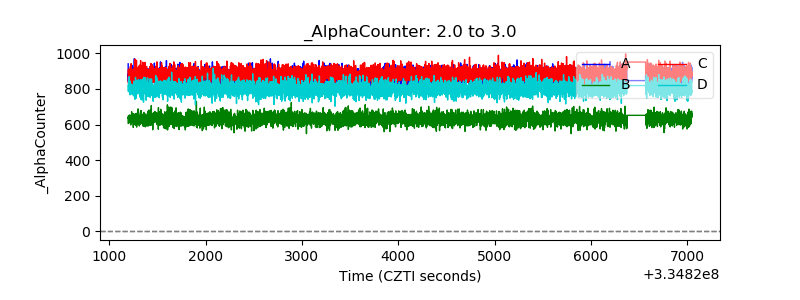 |
| _CPM_Rate | 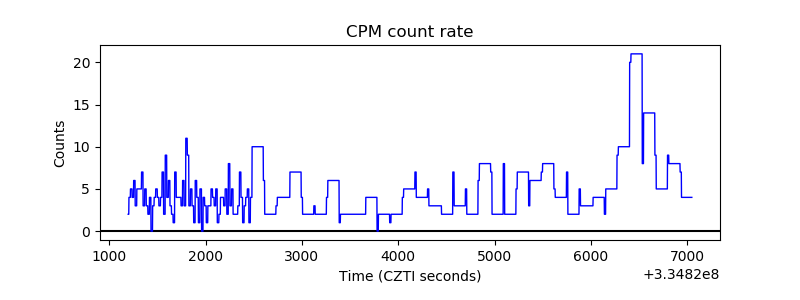 |
| CZT Counter | 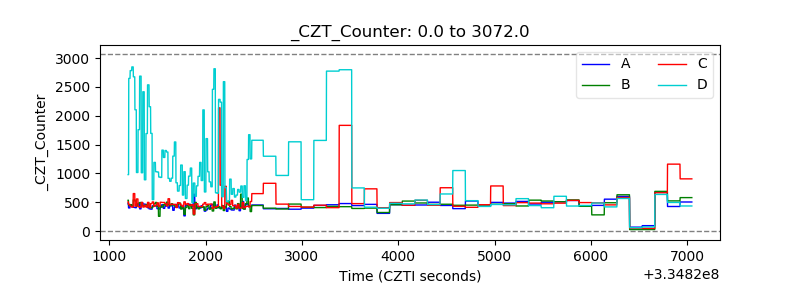 |
| +2.5 Volts monitor |  |
| +5 Volts monitor |  |
| _ROLL_ROT | 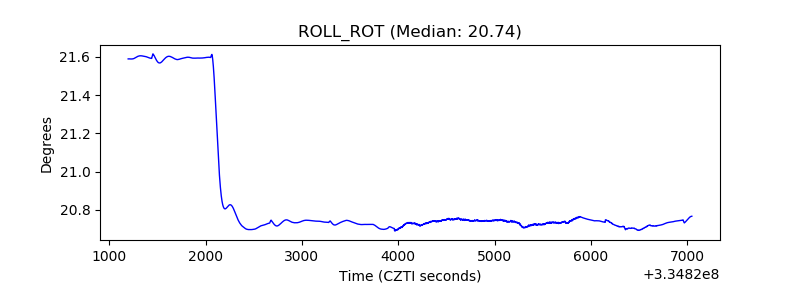 |
| _Roll_DEC | 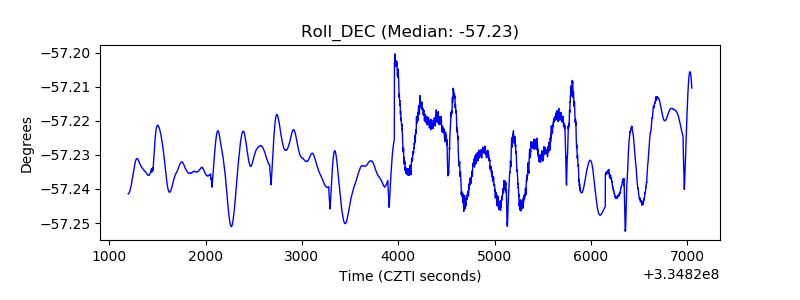 |
| _Roll_RA | 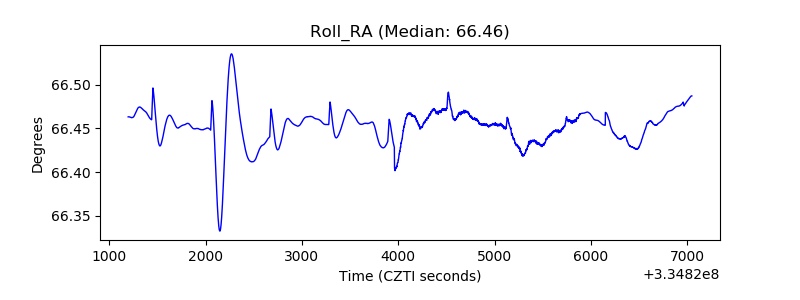 |
| Veto Counter | 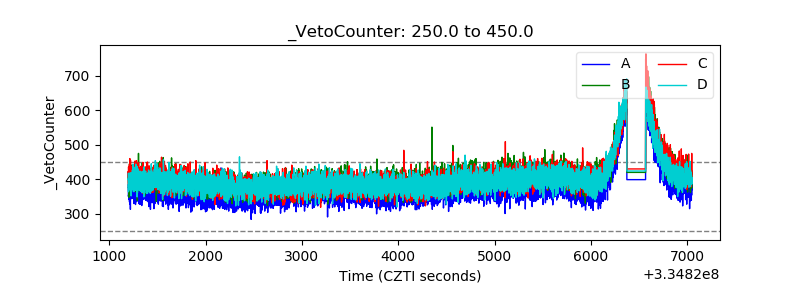 |