| Param | Original file | Final file |
|---|---|---|
| Filename | modeM0/AS1A09_008T02_9000003796_26338cztM0_level2.evt | modeM0/AS1A09_008T02_9000003796_26338cztM0_level2_quad_clean.evt |
| Size (bytes) | 2,021,417,280 | 346,291,200 |
| Size | 1.9 GB | 330.2 MB |
| Events in quadrant A | 11,261,399 | 2,274,397 |
| Events in quadrant B | 11,424,971 | 2,322,809 |
| Events in quadrant C | 13,437,100 | 2,235,546 |
| Events in quadrant D | 23,449,209 | 1,976,516 |
| Mode M0 | |||
|---|---|---|---|
| Quadrant | BADHDUFLAG | Total packets | Discarded packets |
| A | 0 | 49651 | 0 |
| B | 0 | 49814 | 0 |
| C | 0 | 55303 | 0 |
| D | 0 | 86134 | 0 |
| Mode M9 | |||
|---|---|---|---|
| Quadrant | BADHDUFLAG | Total packets | Discarded packets |
| A | 0 | 23 | 0 |
| B | 0 | 23 | 0 |
| C | 0 | 23 | 0 |
| D | 0 | 23 | 0 |
| Quadrant | Total seconds | Saturated seconds | Saturation percentage |
|---|---|---|---|
| A | 24394 | 355 | 1.455276% |
| B | 24395 | 419 | 1.717565% |
| C | 24395 | 680 | 2.787456% |
| D | 24394 | 4722 | 19.357219% |
Noise dominated data is calculated using 1-second bins in cleaned event files. If a bin has >2000 counts, and if more than 50% of those come from <1% of pixels, then it is considered to be noise-dominated and hence unusable.
| Quadrant | # 1 sec bins | Bins with >0 counts | Bins with >2000 counts | High rate bins dominated by noise | Noise dominated (total time) | Noise dominated (detector-on time) | Marked lightcurve |
|---|---|---|---|---|---|---|---|
| A | 26609 | 24397 | 0 | 0 | 0.00% | 0.00% | 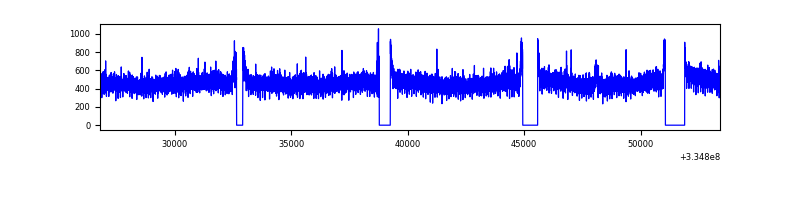 |
| B | 26610 | 24399 | 8 | 8 | 0.03% | 0.03% | 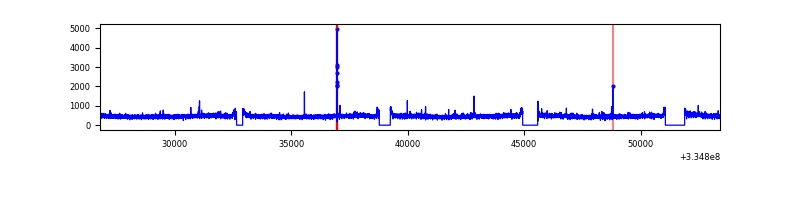 |
| C | 26610 | 24399 | 104 | 104 | 0.39% | 0.43% | 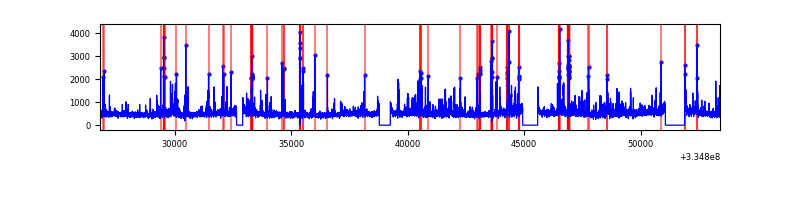 |
| D | 26608 | 24395 | 3685 | 3685 | 13.85% | 15.11% | 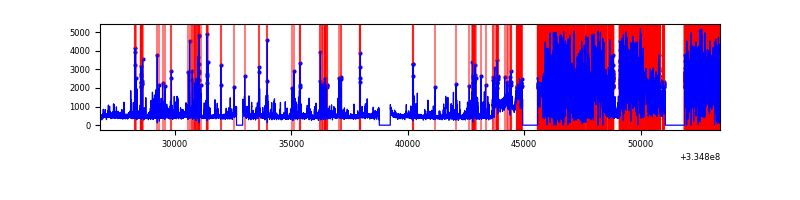 |
Top three noisy pixels from each quadrant. If the there are fewer than three noisy pixels in the level2.evt file, extra rows are filled as -1
| Pixel properties | Quadrant properties | ||||||
|---|---|---|---|---|---|---|---|
| Quadrant | DetID | PixID | Counts | Sigma | Mean | Median | Sigma |
| A | 6 | 16 | 47469 | 77.3 | 2905 | 2837 | 577.4 |
| A | 13 | 254 | 37841 | 60.62 | 2905 | 2837 | 577.4 |
| A | 3 | 137 | 27755 | 43.15 | 2905 | 2837 | 577.4 |
| B | 12 | 111 | 68025 | 117.42 | 2894 | 2810 | 555.4 |
| B | 0 | 230 | 63164 | 108.67 | 2894 | 2810 | 555.4 |
| B | 11 | 111 | 62081 | 106.72 | 2894 | 2810 | 555.4 |
| C | 3 | 233 | 1574992 | 2410.28 | 2804 | 2814 | 652.3 |
| C | 14 | 238 | 447565 | 681.84 | 2804 | 2814 | 652.3 |
| C | 2 | 16 | 263958 | 400.36 | 2804 | 2814 | 652.3 |
| D | 1 | 52 | 13436362 | 22190.58 | 2559 | 2496 | 605.4 |
| D | 11 | 176 | 166608 | 271.09 | 2559 | 2496 | 605.4 |
| D | 2 | 234 | 103142 | 166.25 | 2559 | 2496 | 605.4 |
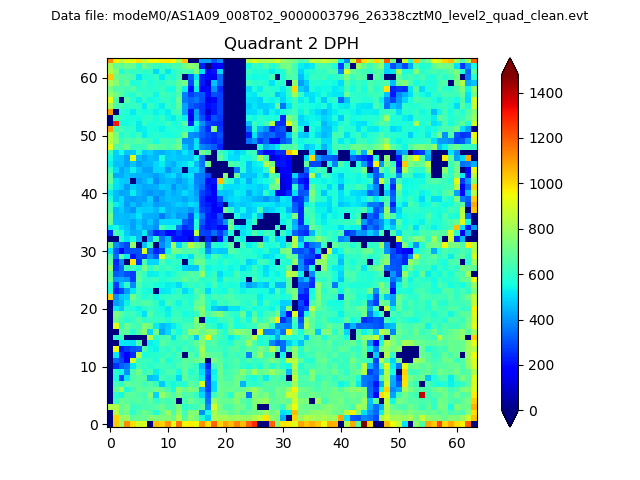
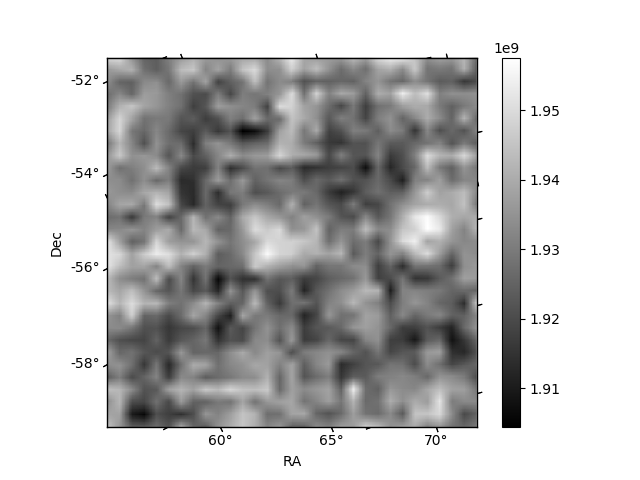
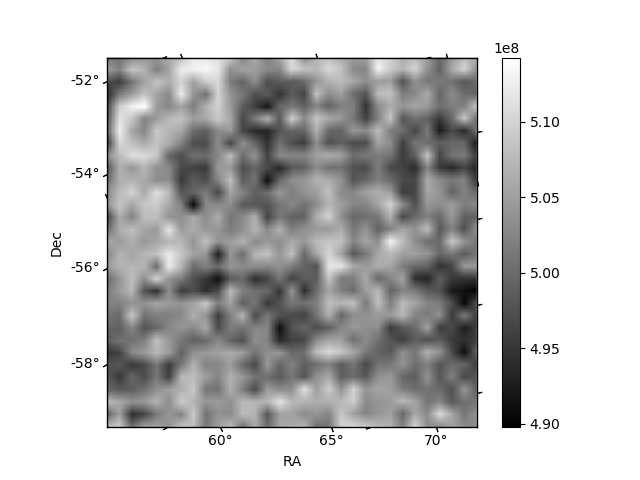
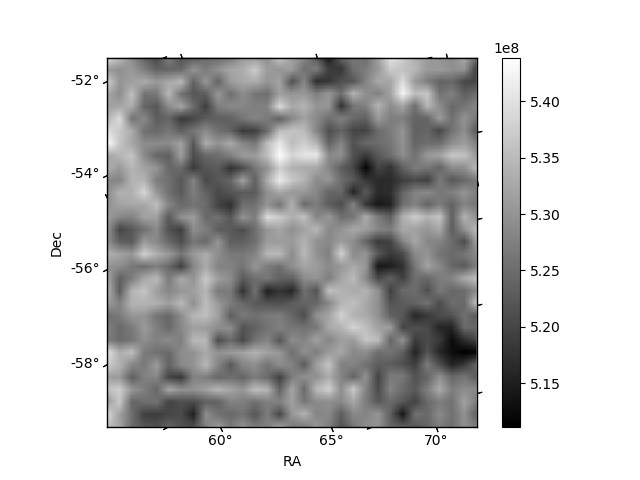
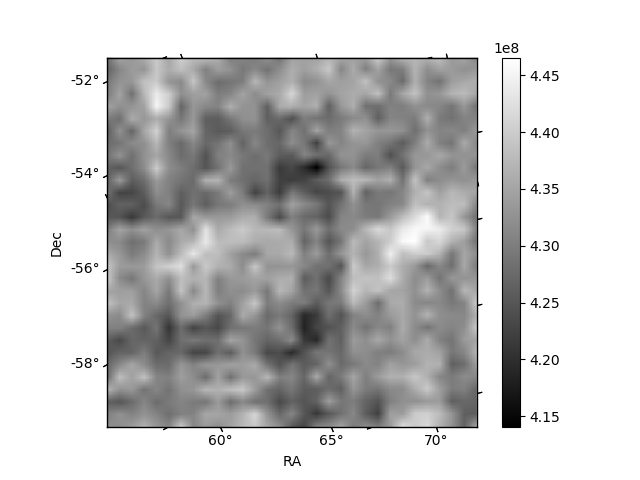
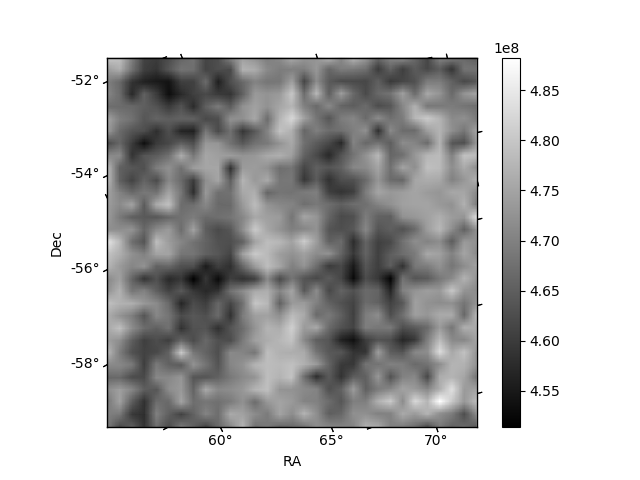
Histogram calculated using DETX and DETY for each event in the final _common_clean file
| Quadrant A | 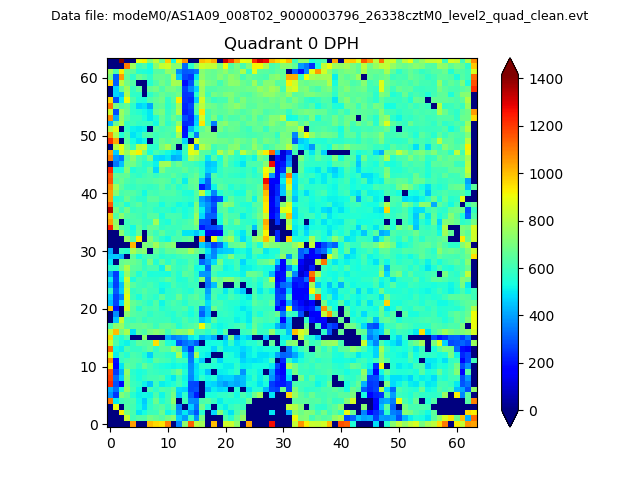 |
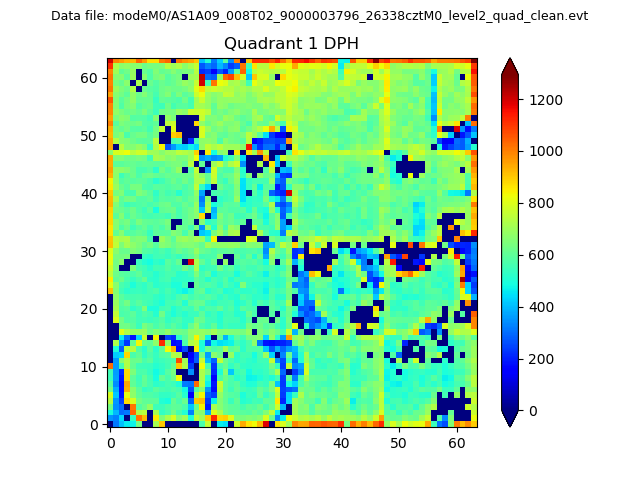 |
Quadrant B |
|---|---|---|---|
| Quadrant D | 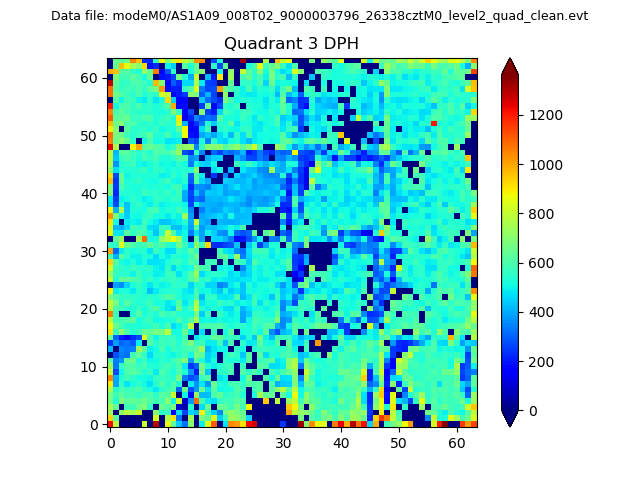 |
 |
Quadrant C |
| Plot type | Count rate plots | Images |
|---|---|---|
| Comparison with Poisson distribution Blue bars denote a histogram of data divided into 1 sec bins. Red curve is a Poisson curve with rate = median count rate of data. |
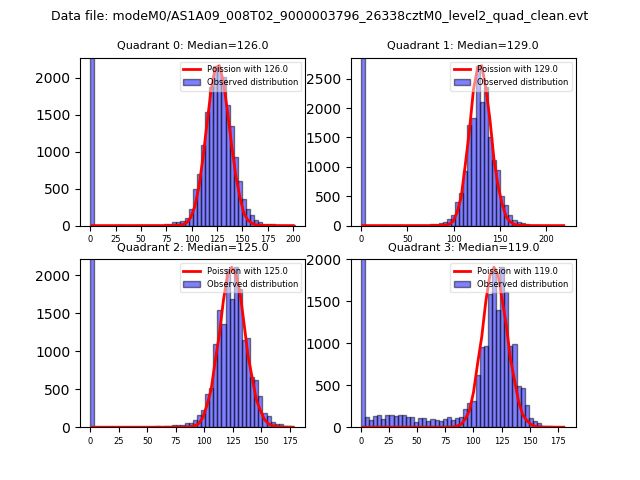 |
 |
| Quadrant-wise count rates Data is divided into 100 sec bins |
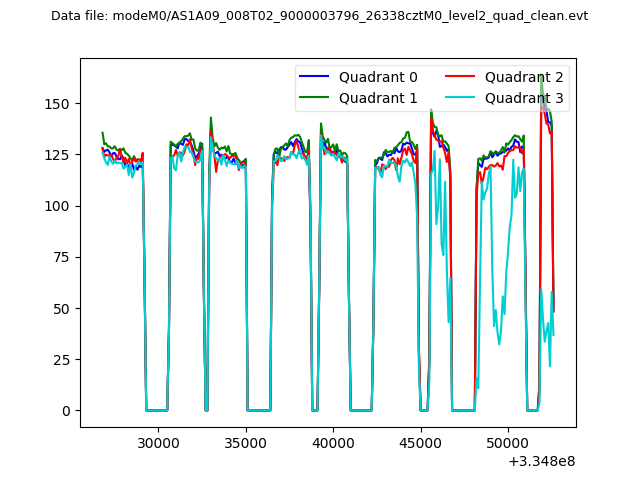 |
|
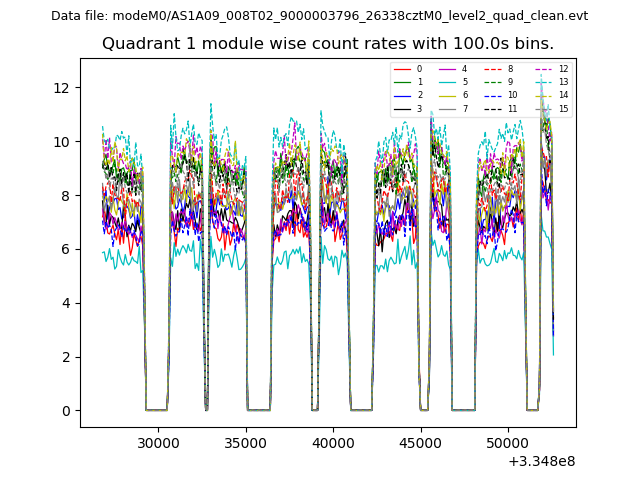
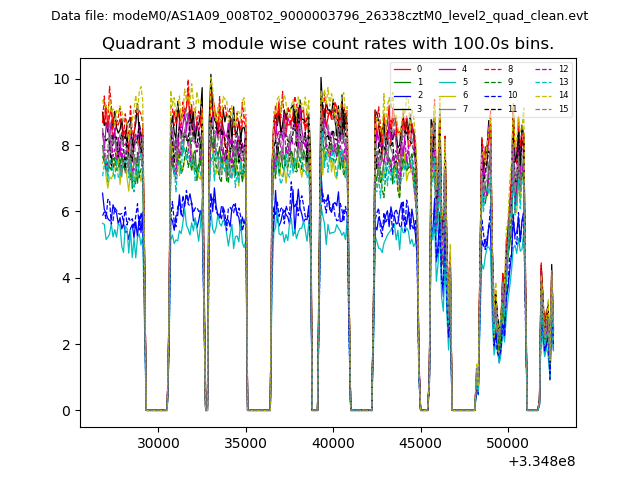
| Module-wise count rates for Quadrant A Data is divided into 100 sec bins |
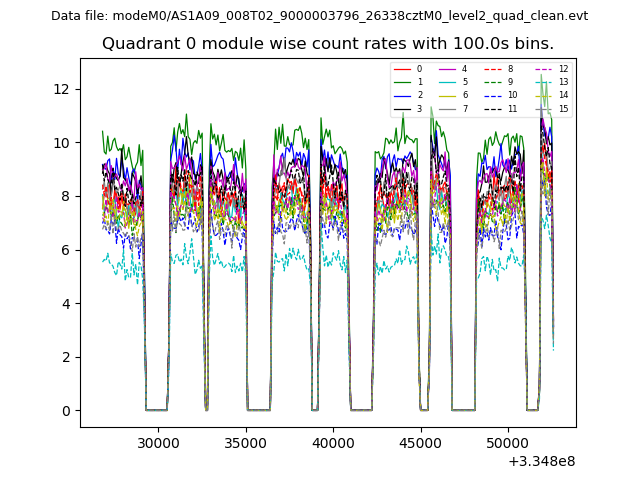 |
 |
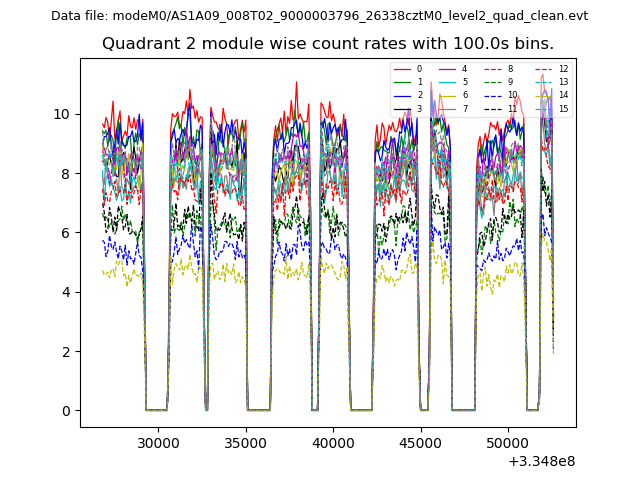
| Module-wise count rates for Quadrant B Data is divided into 100 sec bins |
 |
 |
| Module-wise count rates for Quadrant C Data is divided into 100 sec bins |
 |
 |
| Module-wise count rates for Quadrant D Data is divided into 100 sec bins |
 |
 |
| Parameter | Plot |
|---|---|
| CZT HV Monitor | 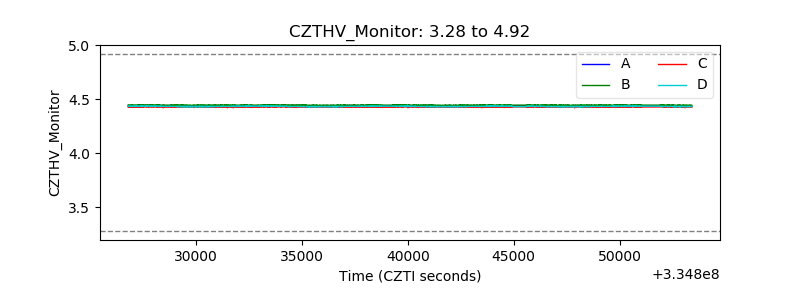 |
| D_VDD | 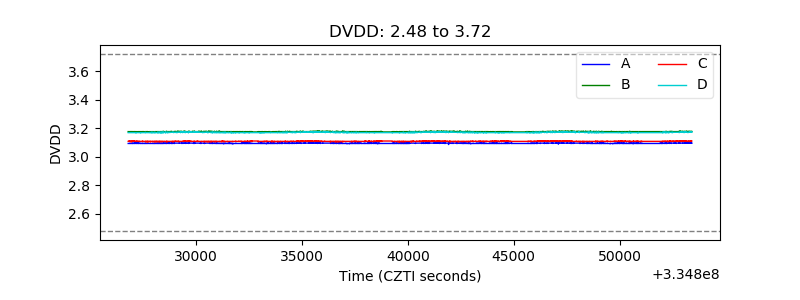 |
| Temperature 1 | 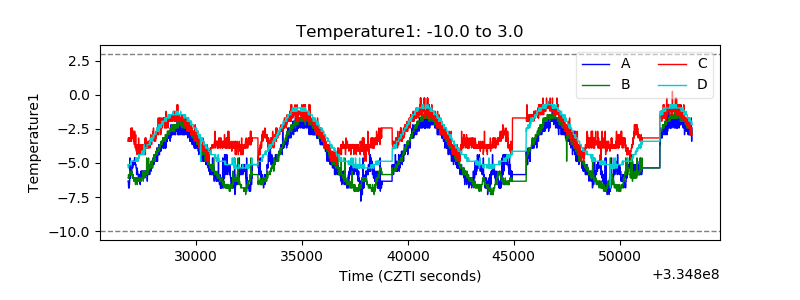 |
| Veto HV Monitor | 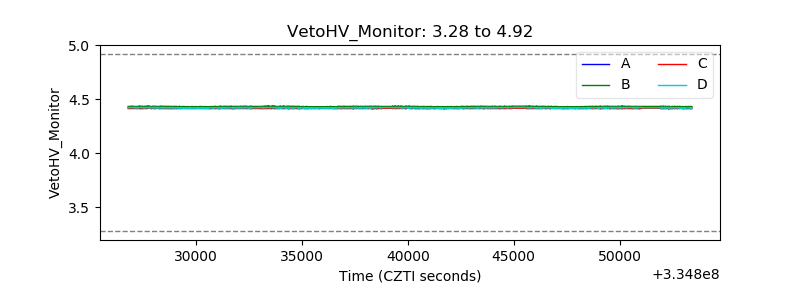 |
| Veto LLD | 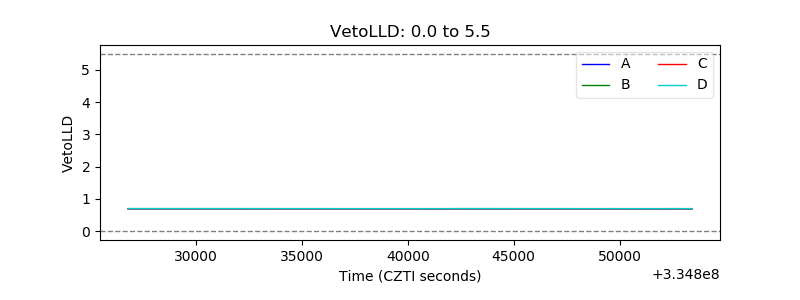 |
| Alpha Counter | 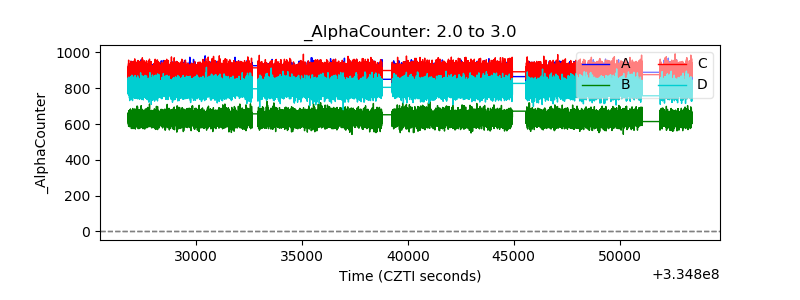 |
| _CPM_Rate | 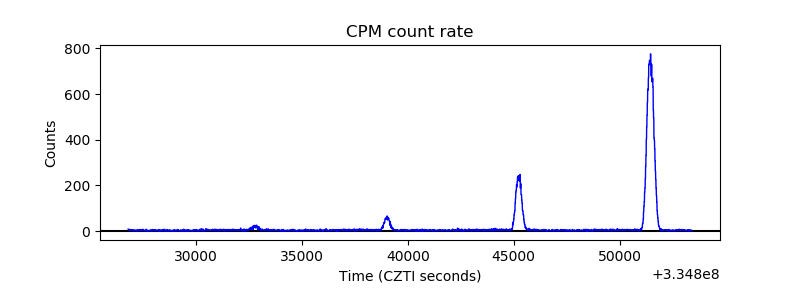 |
| CZT Counter | 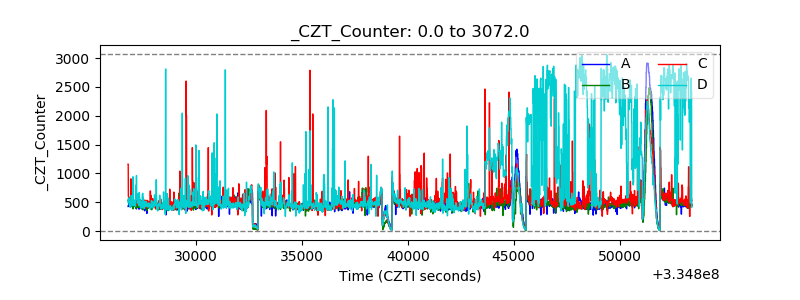 |
| +2.5 Volts monitor |  |
| +5 Volts monitor | 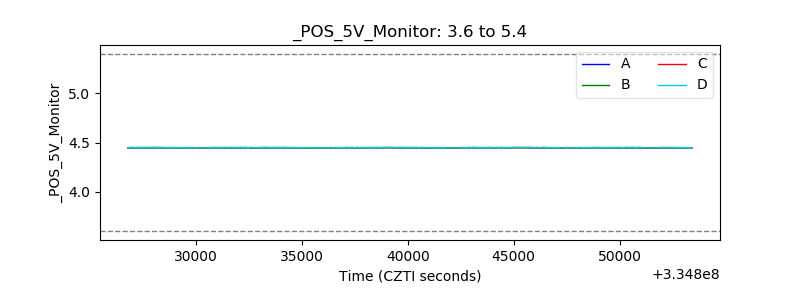 |
| _ROLL_ROT | 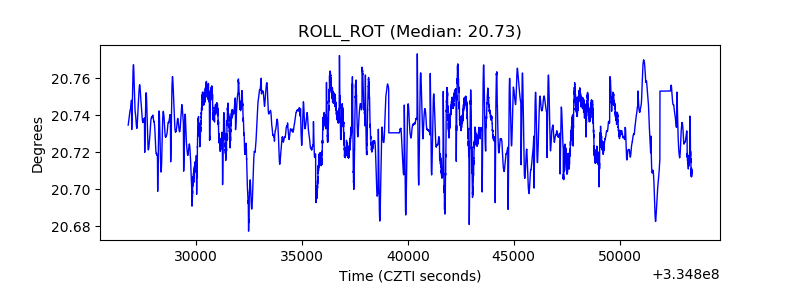 |
| _Roll_DEC | 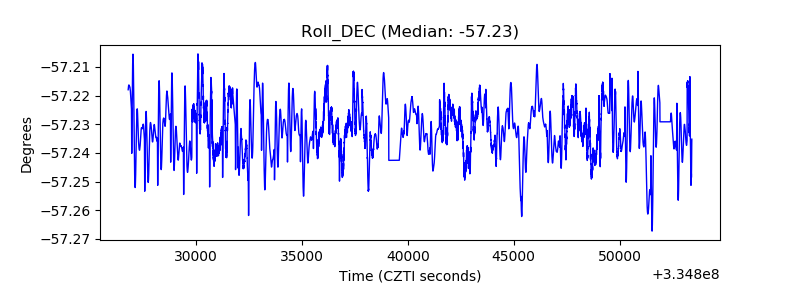 |
| _Roll_RA | 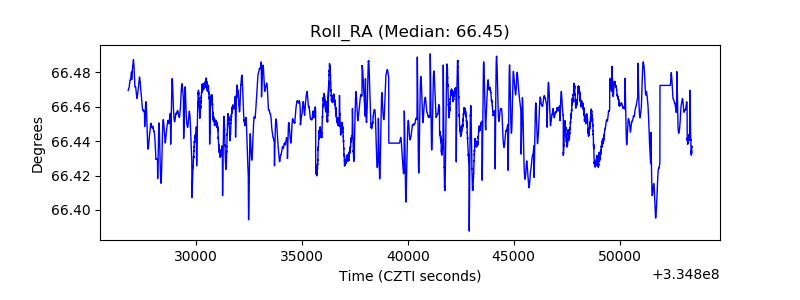 |
| Veto Counter | 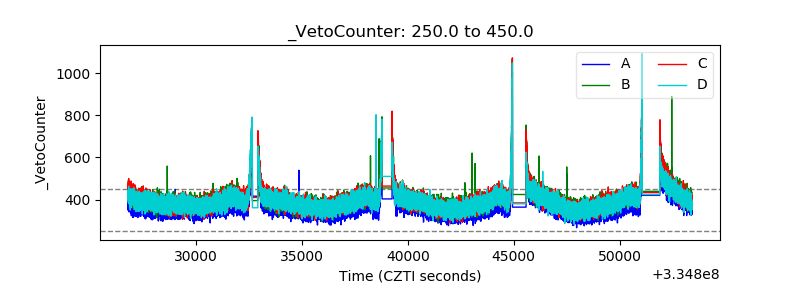 |