| Param | Original file | Final file |
|---|---|---|
| Filename | modeM0/AS1A09_008T02_9000003796_26339cztM0_level2.evt | modeM0/AS1A09_008T02_9000003796_26339cztM0_level2_quad_clean.evt |
| Size (bytes) | 905,235,840 | 66,657,600 |
| Size | 863.3 MB | 63.6 MB |
| Events in quadrant A | 3,034,691 | 504,916 |
| Events in quadrant B | 3,066,977 | 511,173 |
| Events in quadrant C | 6,461,868 | 440,472 |
| Events in quadrant D | 14,424,846 | 118,751 |
| Mode M0 | |||
|---|---|---|---|
| Quadrant | BADHDUFLAG | Total packets | Discarded packets |
| A | 0 | 13084 | 0 |
| B | 0 | 13148 | 0 |
| C | 0 | 23512 | 0 |
| D | 0 | 47076 | 0 |
| Mode M9 | |||
|---|---|---|---|
| Quadrant | BADHDUFLAG | Total packets | Discarded packets |
| A | 0 | 10 | 0 |
| B | 0 | 10 | 0 |
| C | 0 | 10 | 0 |
| D | 0 | 10 | 0 |
| Quadrant | Total seconds | Saturated seconds | Saturation percentage |
|---|---|---|---|
| A | 6316 | 51 | 0.807473% |
| B | 6317 | 68 | 1.076460% |
| C | 6317 | 1345 | 21.291752% |
| D | 6317 | 5277 | 83.536489% |
Noise dominated data is calculated using 1-second bins in cleaned event files. If a bin has >2000 counts, and if more than 50% of those come from <1% of pixels, then it is considered to be noise-dominated and hence unusable.
| Quadrant | # 1 sec bins | Bins with >0 counts | Bins with >2000 counts | High rate bins dominated by noise | Noise dominated (total time) | Noise dominated (detector-on time) | Marked lightcurve |
|---|---|---|---|---|---|---|---|
| A | 7306 | 6317 | 0 | 0 | 0.00% | 0.00% | 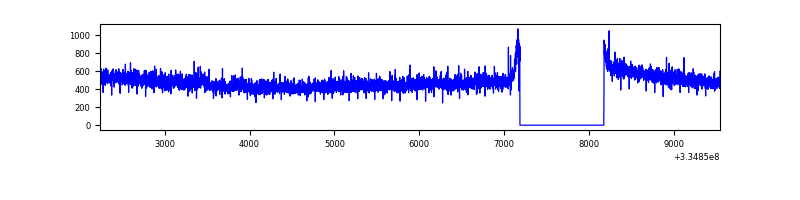 |
| B | 7307 | 6318 | 3 | 3 | 0.04% | 0.05% | 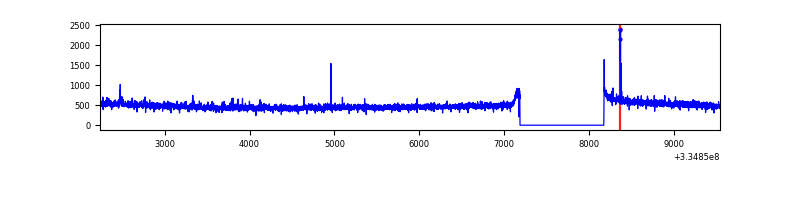 |
| C | 7307 | 6318 | 815 | 815 | 11.15% | 12.90% | 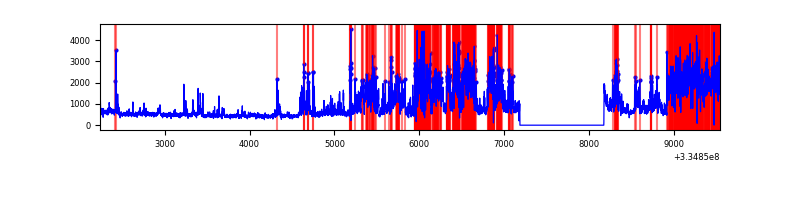 |
| D | 7306 | 6316 | 4716 | 4716 | 64.55% | 74.67% | 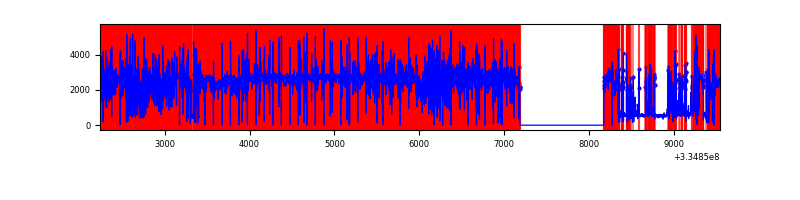 |
Top three noisy pixels from each quadrant. If the there are fewer than three noisy pixels in the level2.evt file, extra rows are filled as -1
| Pixel properties | Quadrant properties | ||||||
|---|---|---|---|---|---|---|---|
| Quadrant | DetID | PixID | Counts | Sigma | Mean | Median | Sigma |
| A | 6 | 16 | 13042 | 78.76 | 778 | 760 | 155.9 |
| A | 13 | 170 | 12284 | 73.9 | 778 | 760 | 155.9 |
| A | 13 | 254 | 9340 | 55.02 | 778 | 760 | 155.9 |
| B | 0 | 230 | 24168 | 159.15 | 773 | 753 | 147.1 |
| B | 12 | 16 | 19995 | 130.78 | 773 | 753 | 147.1 |
| B | 12 | 111 | 17626 | 114.68 | 773 | 753 | 147.1 |
| C | 3 | 233 | 3673997 | 23291.5 | 680 | 683 | 157.7 |
| C | 14 | 238 | 108975 | 686.65 | 680 | 683 | 157.7 |
| C | 2 | 16 | 17441 | 106.26 | 680 | 683 | 157.7 |
| D | 1 | 52 | 13259616 | 183316.85 | 304 | 296 | 72.3 |
| D | 2 | 234 | 12760 | 172.32 | 304 | 296 | 72.3 |
| D | 12 | 233 | 9770 | 130.98 | 304 | 296 | 72.3 |
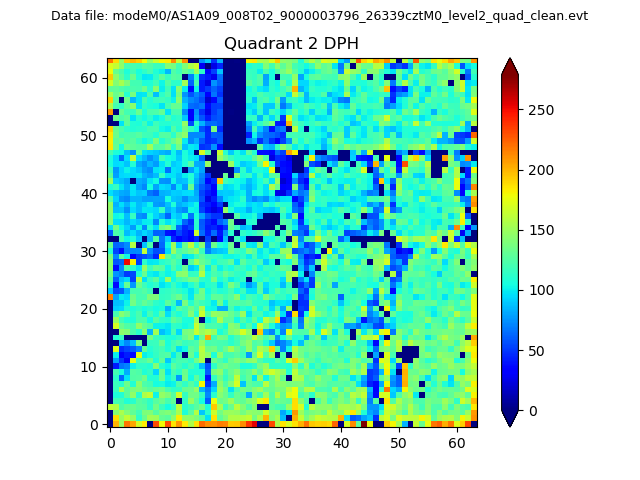
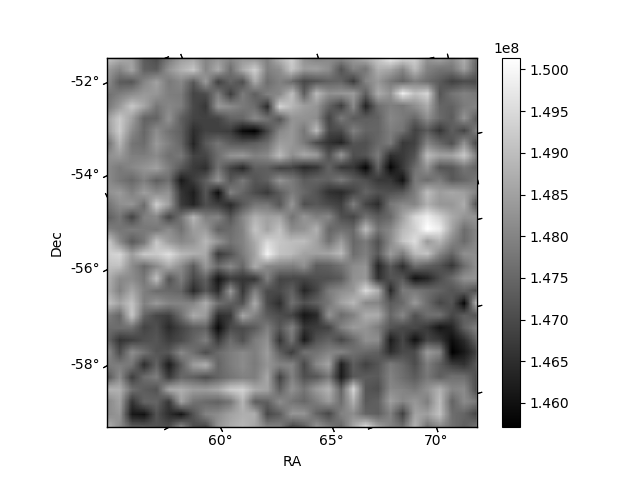
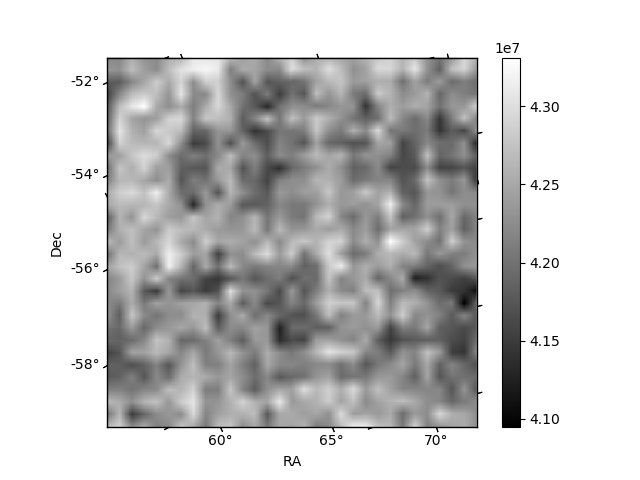
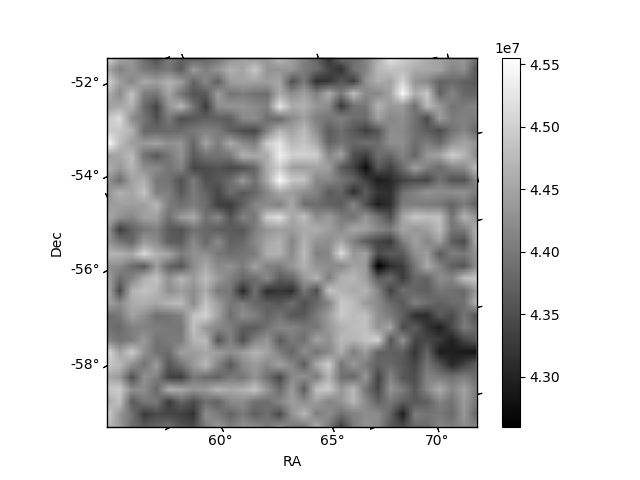
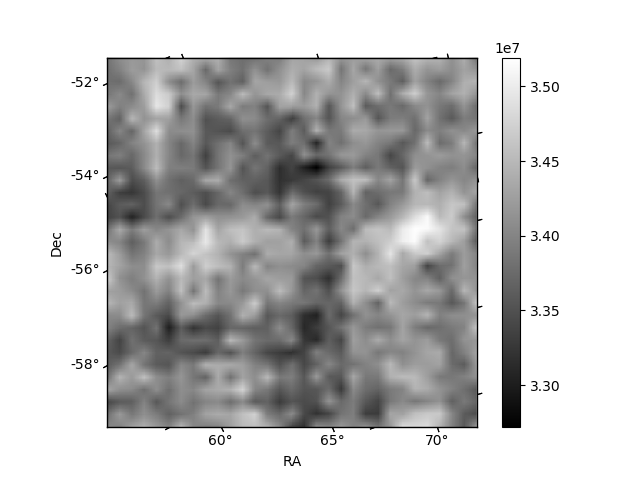
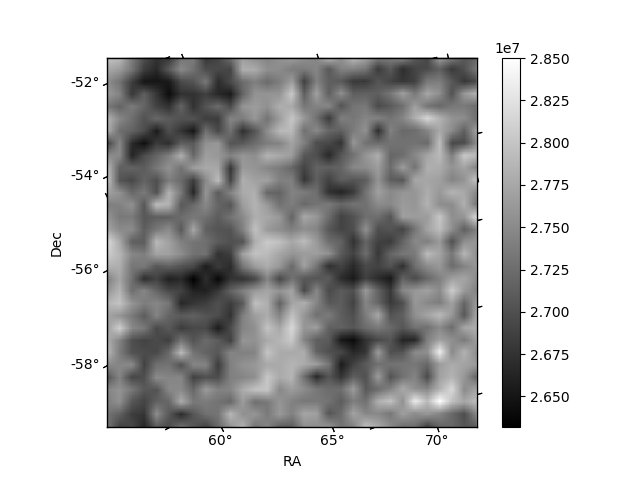
Histogram calculated using DETX and DETY for each event in the final _common_clean file
| Quadrant A | 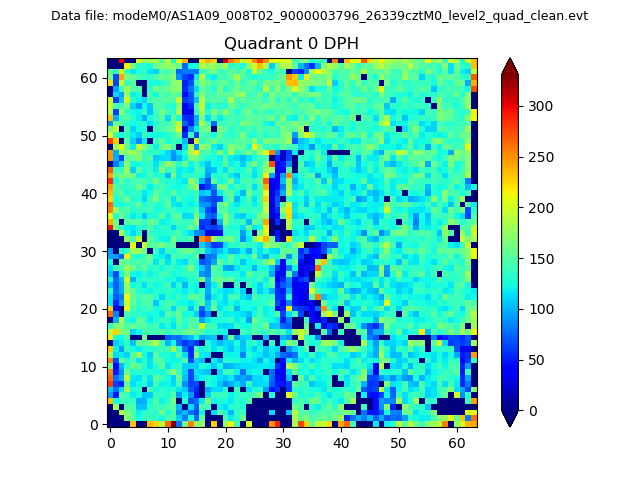 |
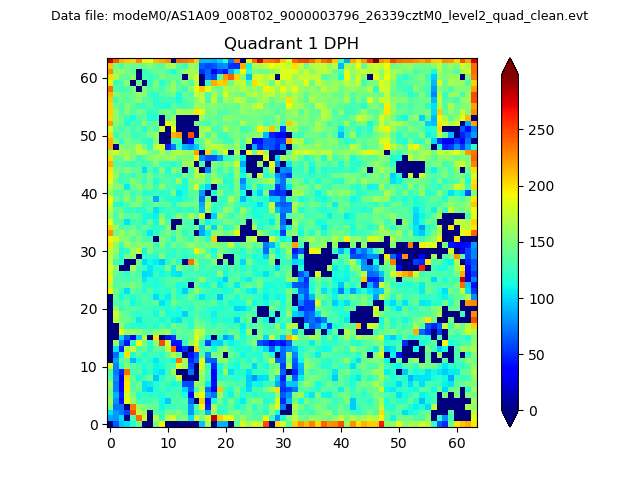 |
Quadrant B |
|---|---|---|---|
| Quadrant D | 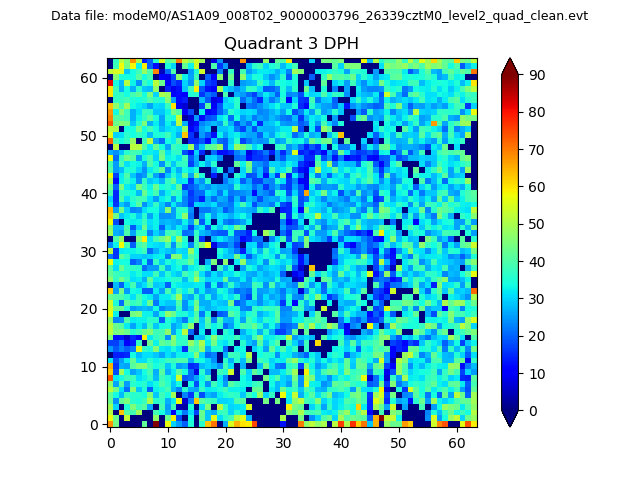 |
 |
Quadrant C |
| Plot type | Count rate plots | Images |
|---|---|---|
| Comparison with Poisson distribution Blue bars denote a histogram of data divided into 1 sec bins. Red curve is a Poisson curve with rate = median count rate of data. |
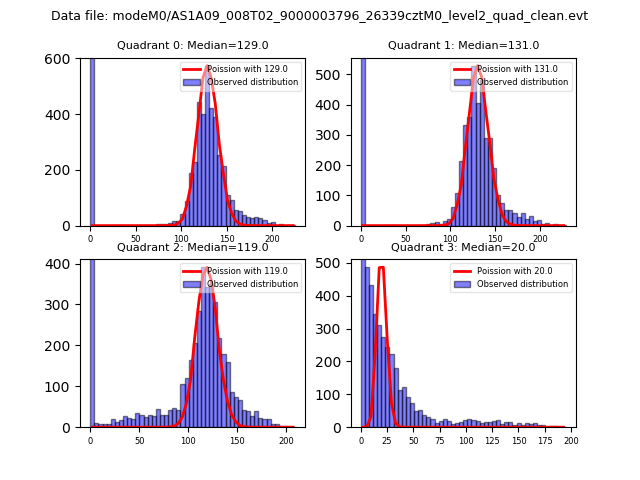 |
 |
| Quadrant-wise count rates Data is divided into 100 sec bins |
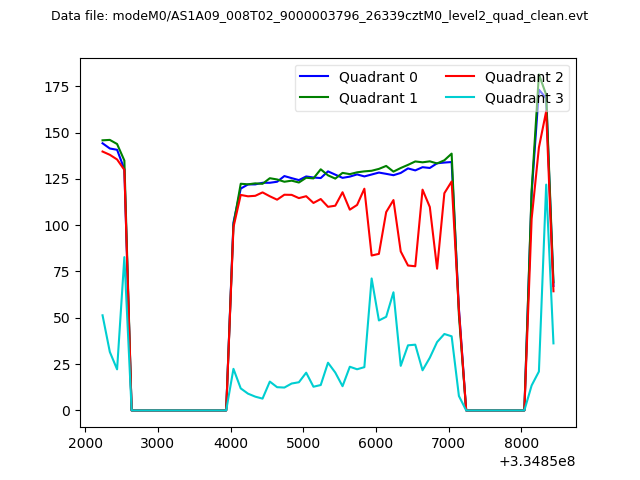 |
|
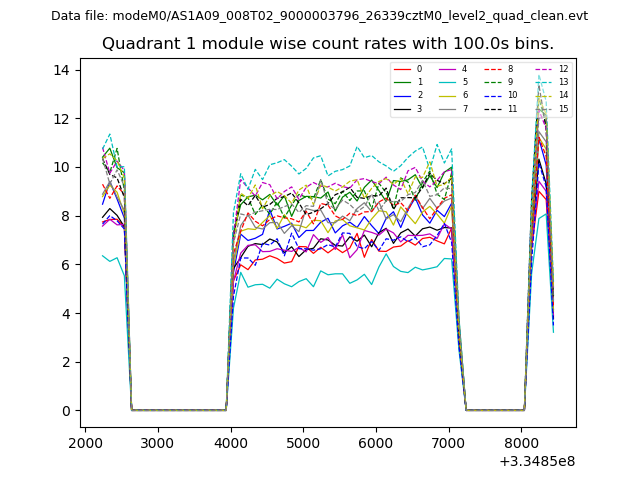
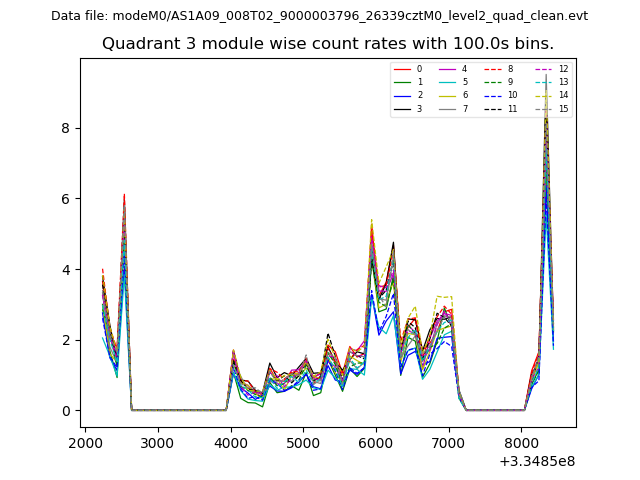
| Module-wise count rates for Quadrant A Data is divided into 100 sec bins |
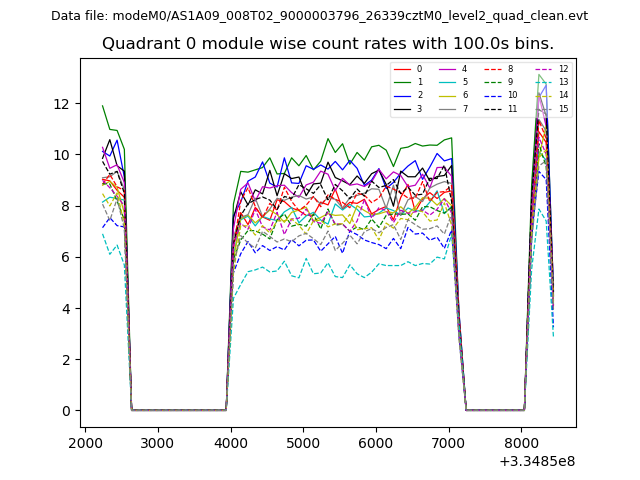 |
 |
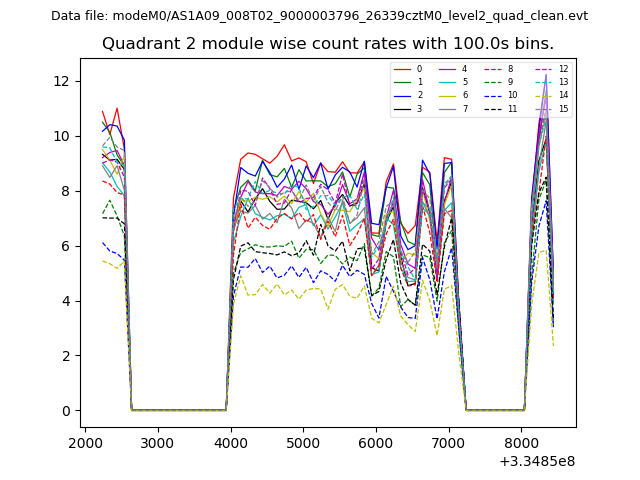
| Module-wise count rates for Quadrant B Data is divided into 100 sec bins |
 |
 |
| Module-wise count rates for Quadrant C Data is divided into 100 sec bins |
 |
 |
| Module-wise count rates for Quadrant D Data is divided into 100 sec bins |
 |
 |
| Parameter | Plot |
|---|---|
| CZT HV Monitor | 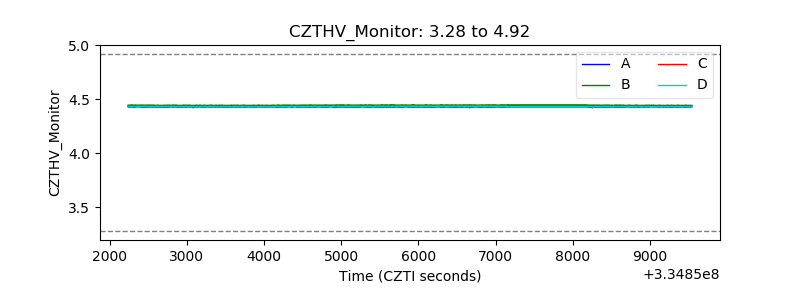 |
| D_VDD | 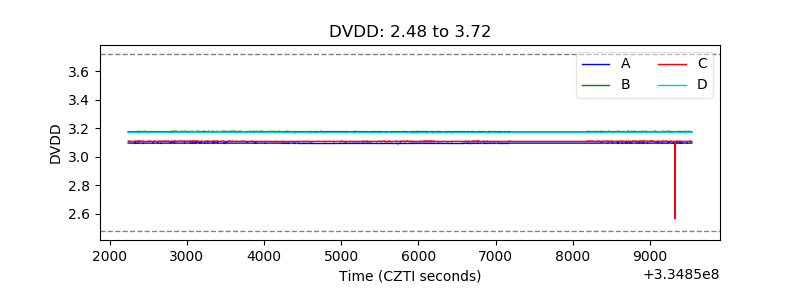 |
| Temperature 1 | 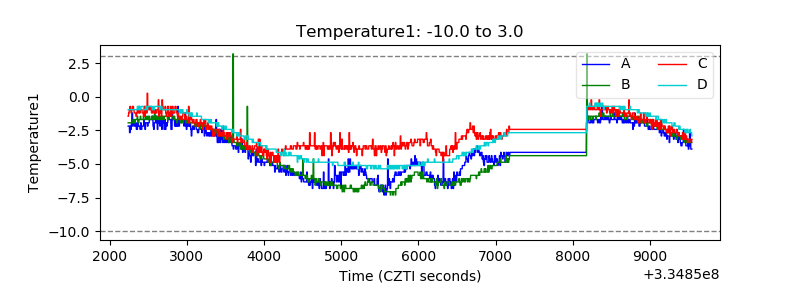 |
| Veto HV Monitor | 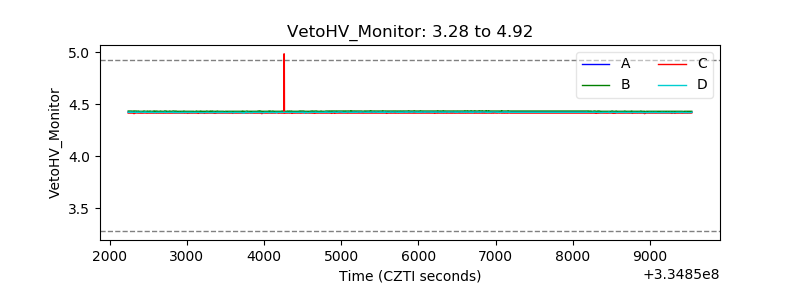 |
| Veto LLD | 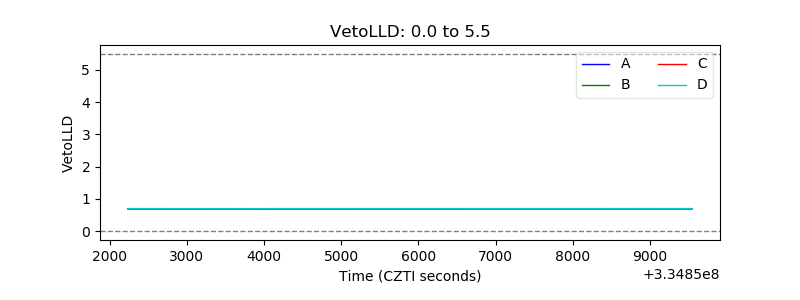 |
| Alpha Counter | 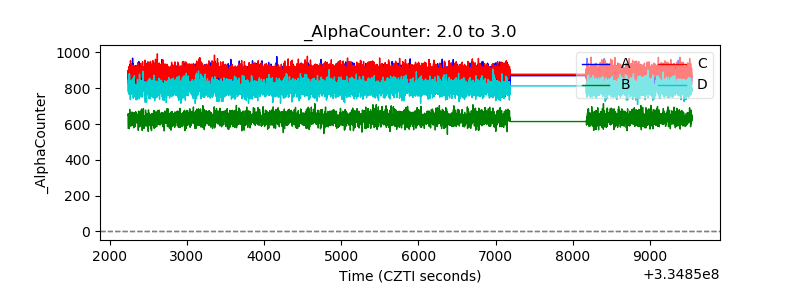 |
| _CPM_Rate | 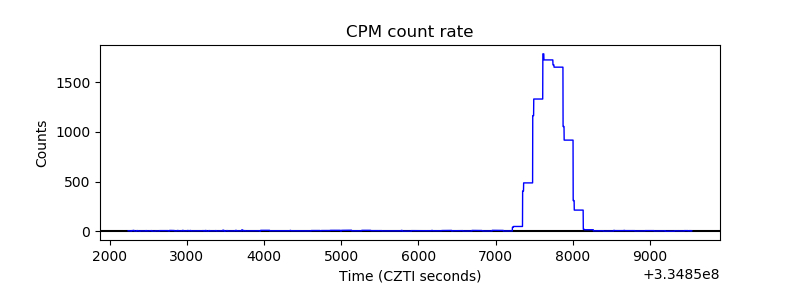 |
| CZT Counter | 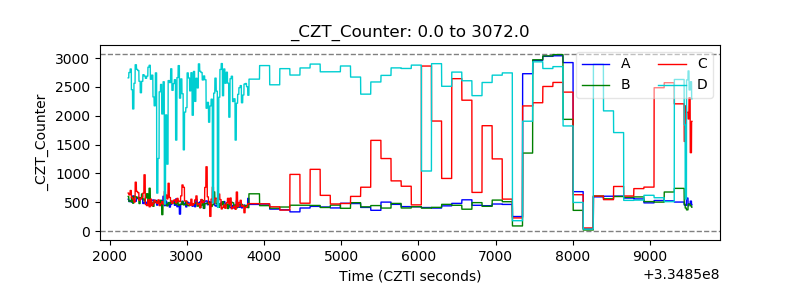 |
| +2.5 Volts monitor | 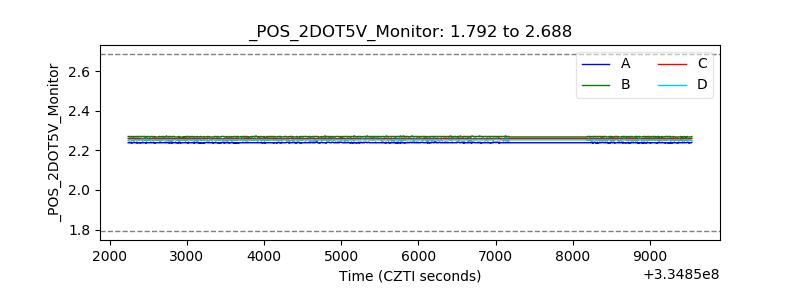 |
| +5 Volts monitor | 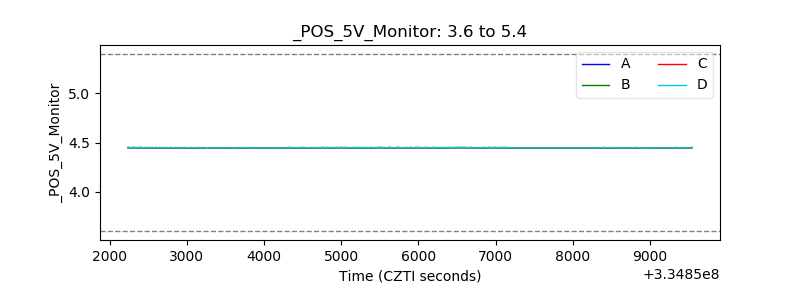 |
| _ROLL_ROT | 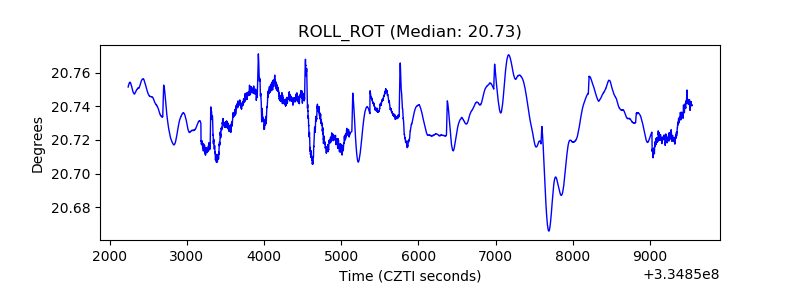 |
| _Roll_DEC | 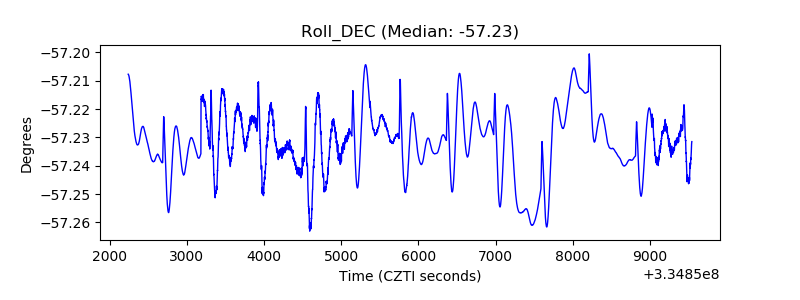 |
| _Roll_RA | 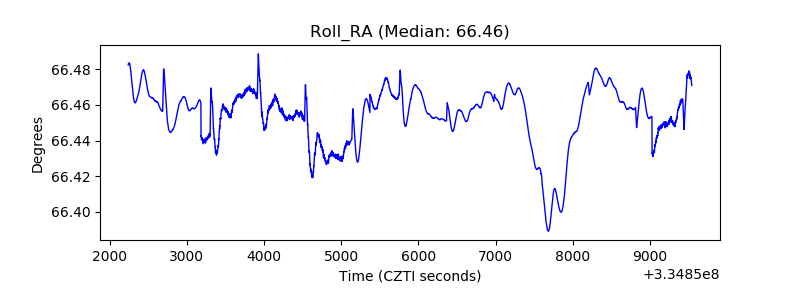 |
| Veto Counter | 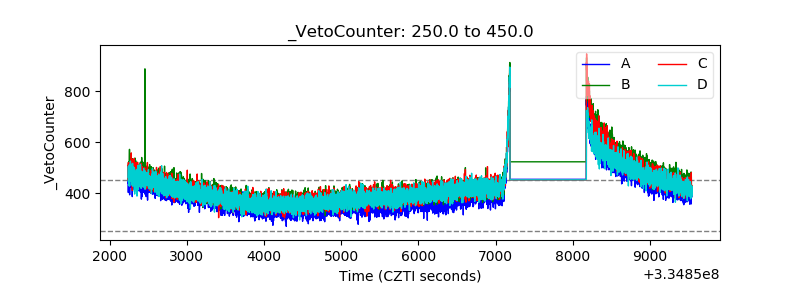 |