| Param | Original file | Final file |
|---|---|---|
| Filename | modeM0/AS1A09_008T02_9000003796_26341cztM0_level2.evt | modeM0/AS1A09_008T02_9000003796_26341cztM0_level2_quad_clean.evt |
| Size (bytes) | 841,760,640 | 70,565,760 |
| Size | 802.8 MB | 67.3 MB |
| Events in quadrant A | 3,207,048 | 497,941 |
| Events in quadrant B | 3,270,460 | 504,465 |
| Events in quadrant C | 5,620,003 | 471,593 |
| Events in quadrant D | 12,960,261 | 212,355 |
| Mode M0 | |||
|---|---|---|---|
| Quadrant | BADHDUFLAG | Total packets | Discarded packets |
| A | 0 | 13781 | 0 |
| B | 0 | 13843 | 0 |
| C | 0 | 20930 | 0 |
| D | 0 | 42846 | 0 |
| Mode M9 | |||
|---|---|---|---|
| Quadrant | BADHDUFLAG | Total packets | Discarded packets |
| A | 0 | 11 | 0 |
| B | 0 | 11 | 0 |
| C | 0 | 11 | 0 |
| D | 0 | 11 | 0 |
| Quadrant | Total seconds | Saturated seconds | Saturation percentage |
|---|---|---|---|
| A | 6431 | 50 | 0.777484% |
| B | 6431 | 51 | 0.793034% |
| C | 6430 | 884 | 13.748056% |
| D | 6430 | 4556 | 70.855365% |
Noise dominated data is calculated using 1-second bins in cleaned event files. If a bin has >2000 counts, and if more than 50% of those come from <1% of pixels, then it is considered to be noise-dominated and hence unusable.
| Quadrant | # 1 sec bins | Bins with >0 counts | Bins with >2000 counts | High rate bins dominated by noise | Noise dominated (total time) | Noise dominated (detector-on time) | Marked lightcurve |
|---|---|---|---|---|---|---|---|
| A | 7566 | 6432 | 0 | 0 | 0.00% | 0.00% | 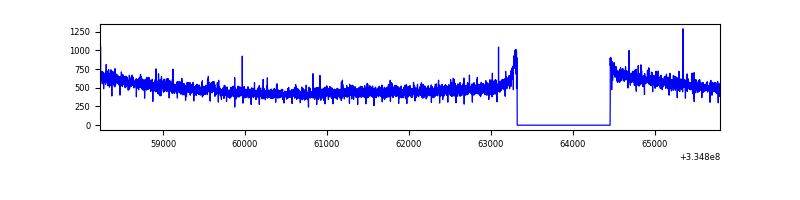 |
| B | 7566 | 6432 | 4 | 4 | 0.05% | 0.06% | 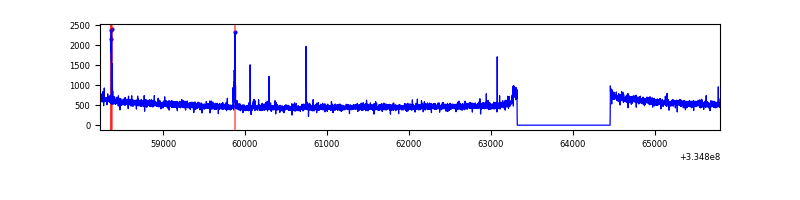 |
| C | 7565 | 6431 | 582 | 582 | 7.69% | 9.05% | 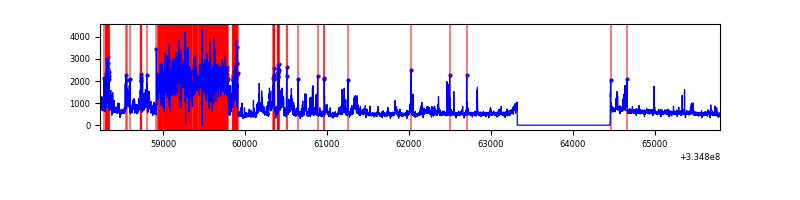 |
| D | 7564 | 6429 | 3944 | 3944 | 52.14% | 61.35% | 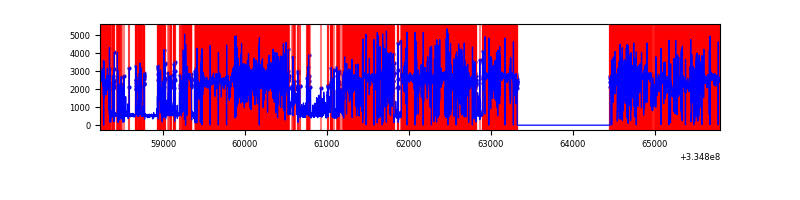 |
Top three noisy pixels from each quadrant. If the there are fewer than three noisy pixels in the level2.evt file, extra rows are filled as -1
| Pixel properties | Quadrant properties | ||||||
|---|---|---|---|---|---|---|---|
| Quadrant | DetID | PixID | Counts | Sigma | Mean | Median | Sigma |
| A | 6 | 16 | 24801 | 145.76 | 825 | 811 | 164.6 |
| A | 13 | 254 | 10113 | 56.52 | 825 | 811 | 164.6 |
| A | 3 | 137 | 7427 | 40.2 | 825 | 811 | 164.6 |
| B | 0 | 230 | 22981 | 143.59 | 821 | 803 | 154.5 |
| B | 3 | 64 | 21904 | 136.62 | 821 | 803 | 154.5 |
| B | 12 | 16 | 21011 | 130.84 | 821 | 803 | 154.5 |
| C | 3 | 233 | 2573673 | 14949.65 | 745 | 750 | 172.1 |
| C | 14 | 238 | 121028 | 698.86 | 745 | 750 | 172.1 |
| C | 2 | 16 | 16823 | 93.39 | 745 | 750 | 172.1 |
| D | 1 | 52 | 11529120 | 131817.42 | 368 | 359 | 87.5 |
| D | 11 | 176 | 24454 | 275.5 | 368 | 359 | 87.5 |
| D | 2 | 234 | 14537 | 162.11 | 368 | 359 | 87.5 |
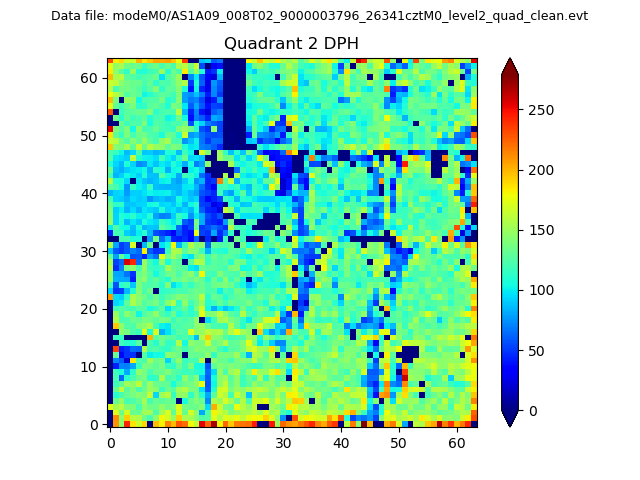
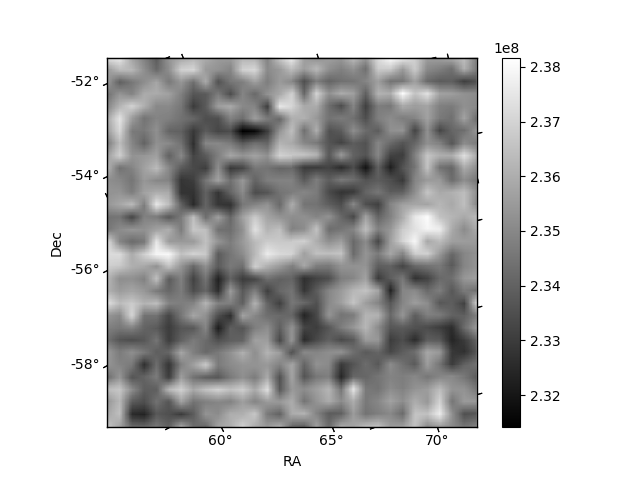
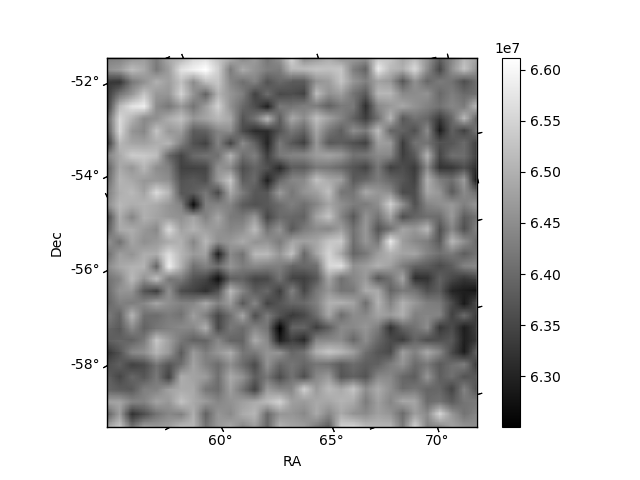
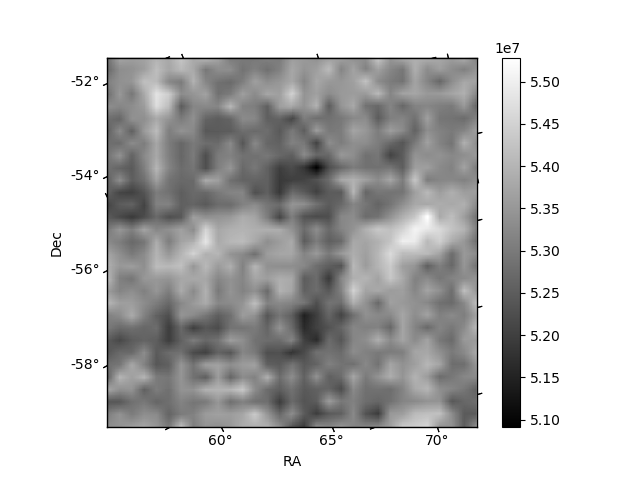
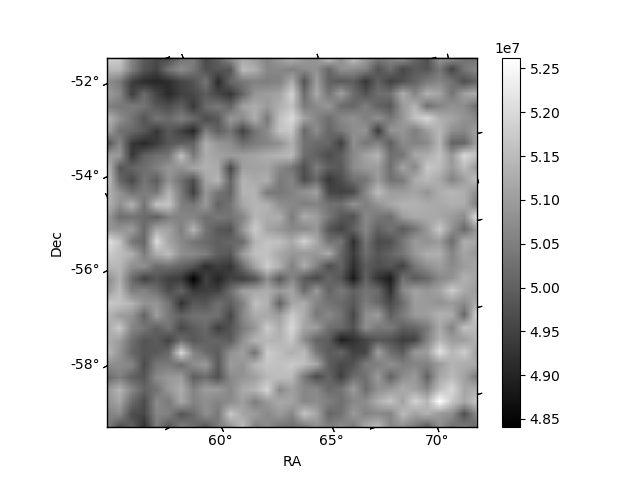
Histogram calculated using DETX and DETY for each event in the final _common_clean file
| Quadrant A | 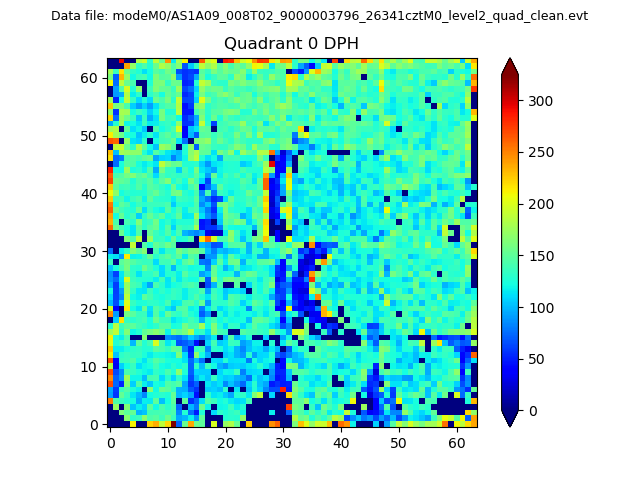 |
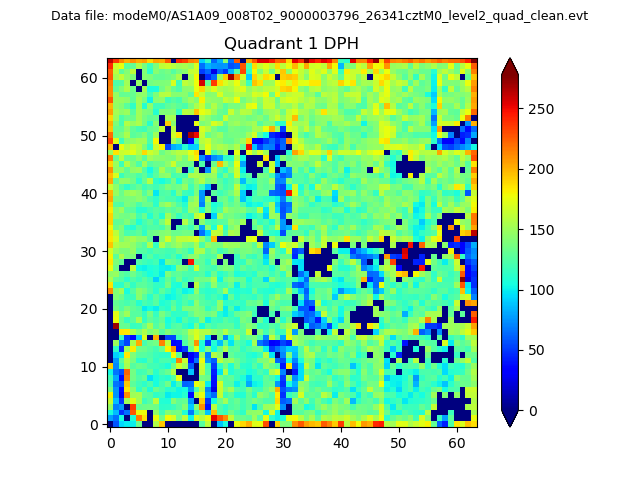 |
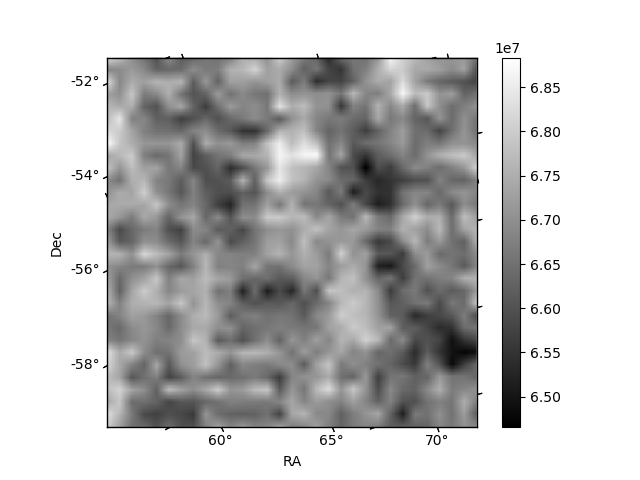
Quadrant B |
|---|---|---|---|
| Quadrant D | 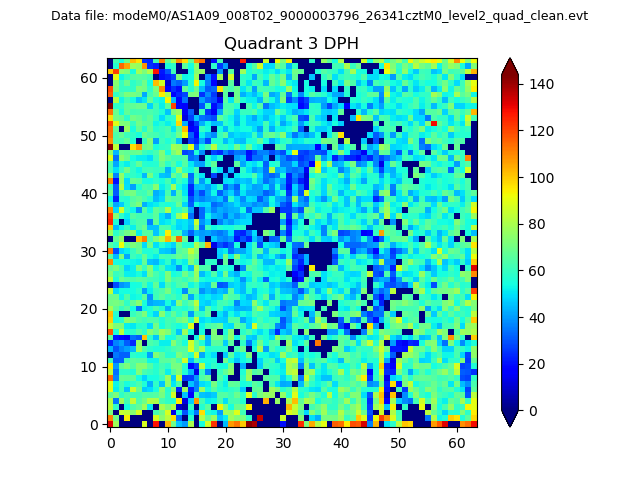 |
 |
Quadrant C |
| Plot type | Count rate plots | Images |
|---|---|---|
| Comparison with Poisson distribution Blue bars denote a histogram of data divided into 1 sec bins. Red curve is a Poisson curve with rate = median count rate of data. |
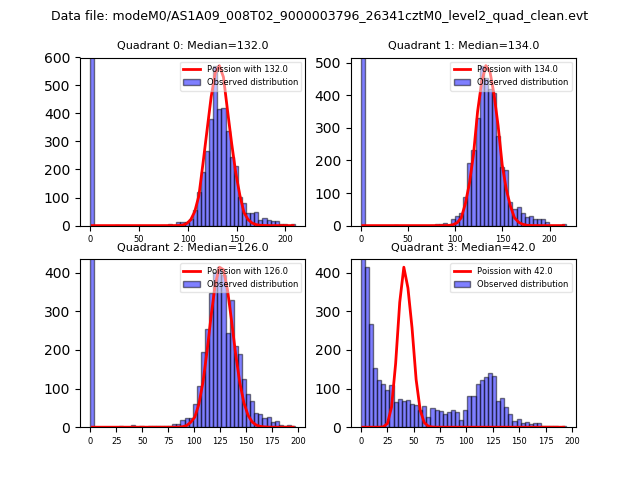 |
 |
| Quadrant-wise count rates Data is divided into 100 sec bins |
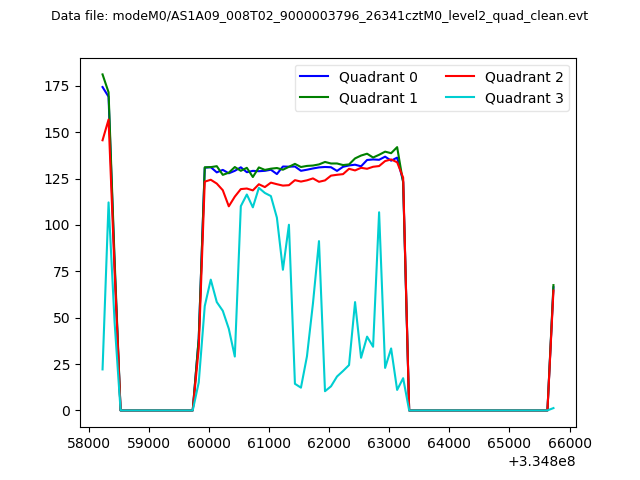 |
|
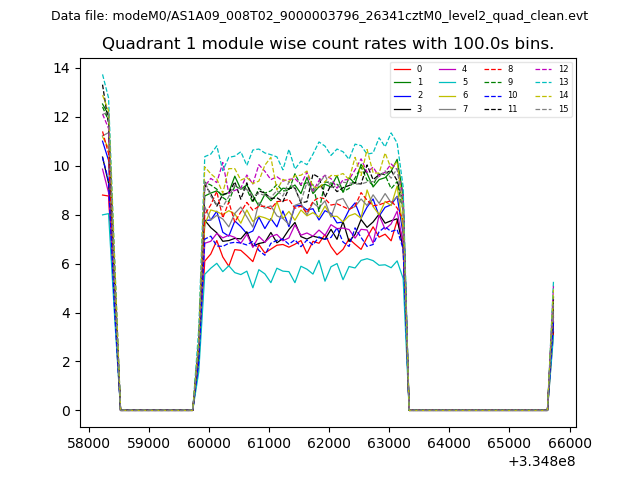
| Module-wise count rates for Quadrant A Data is divided into 100 sec bins |
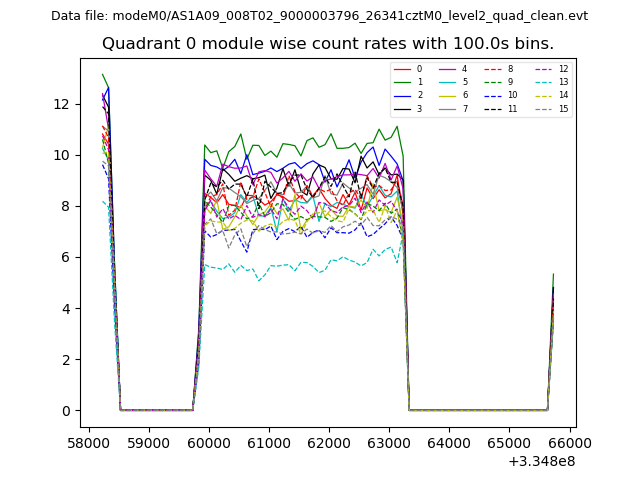 |
 |
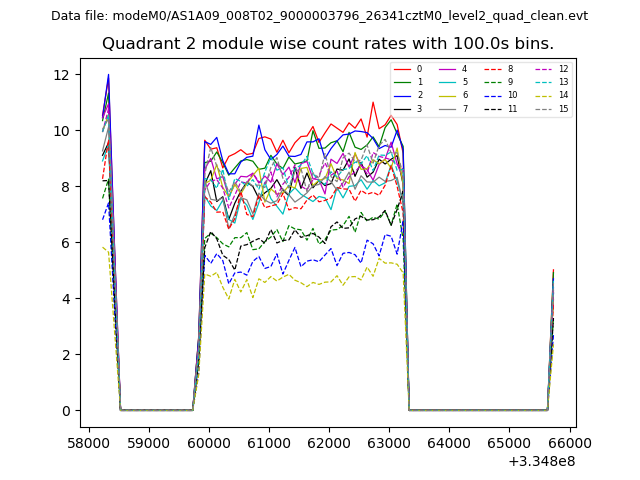
| Module-wise count rates for Quadrant B Data is divided into 100 sec bins |
 |
 |
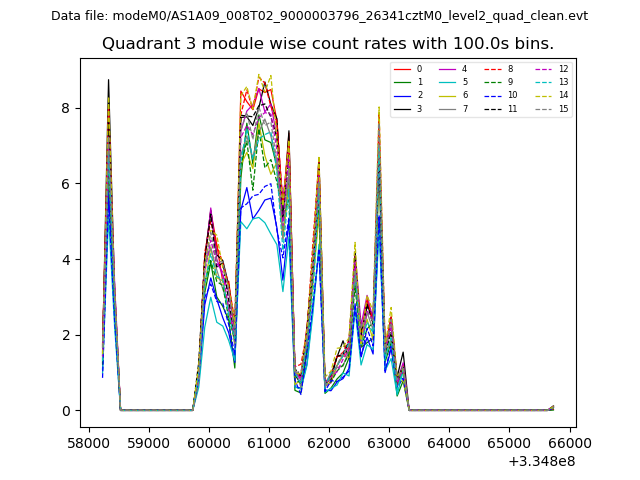
| Module-wise count rates for Quadrant C Data is divided into 100 sec bins |
 |
 |
| Module-wise count rates for Quadrant D Data is divided into 100 sec bins |
 |
 |
| Parameter | Plot |
|---|---|
| CZT HV Monitor | 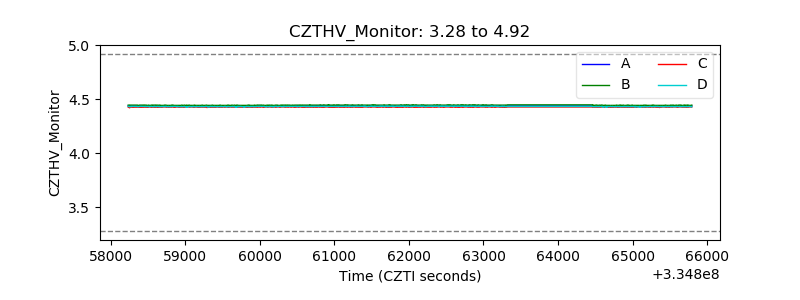 |
| D_VDD | 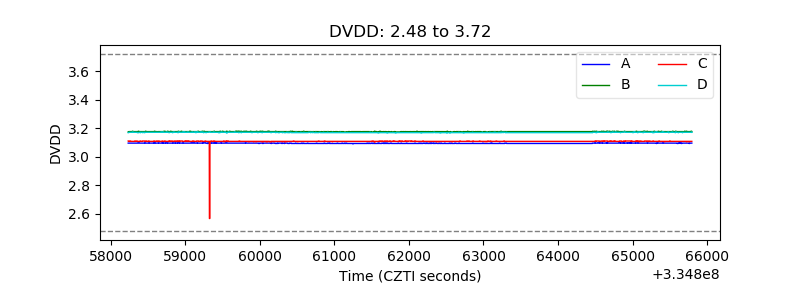 |
| Temperature 1 | 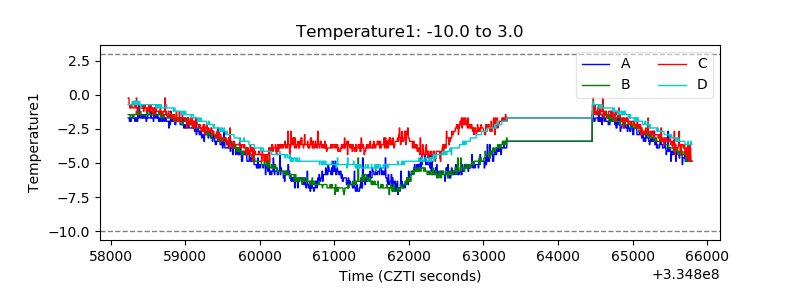 |
| Veto HV Monitor |  |
| Veto LLD |  |
| Alpha Counter | 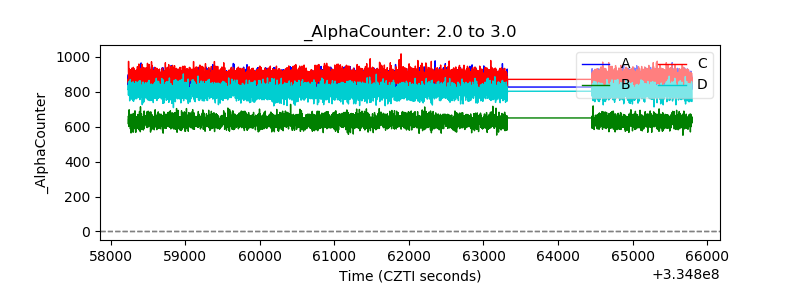 |
| _CPM_Rate | 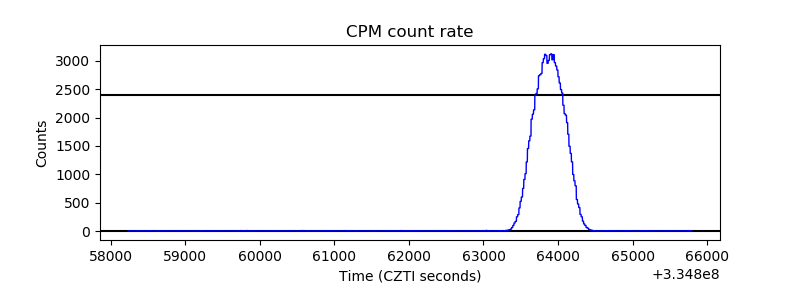 |
| CZT Counter | 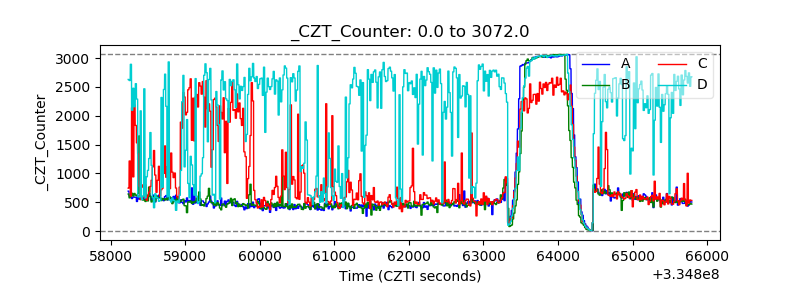 |
| +2.5 Volts monitor |  |
| +5 Volts monitor |  |
| _ROLL_ROT | 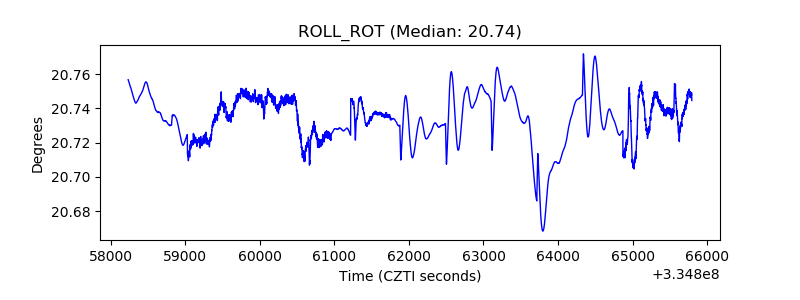 |
| _Roll_DEC | 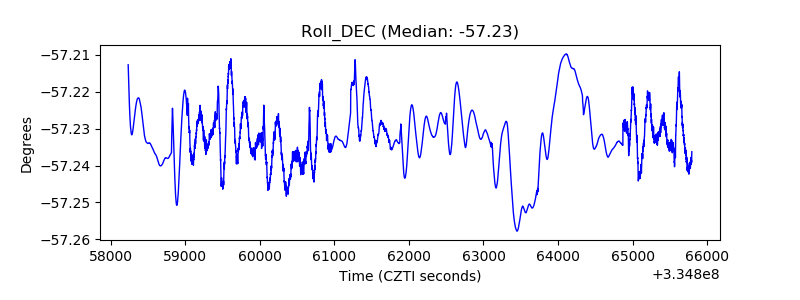 |
| _Roll_RA | 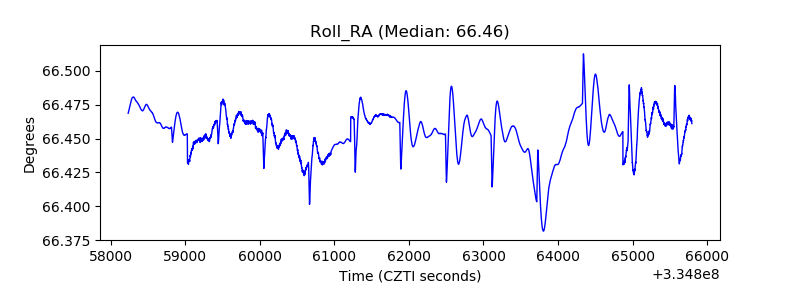 |
| Veto Counter | 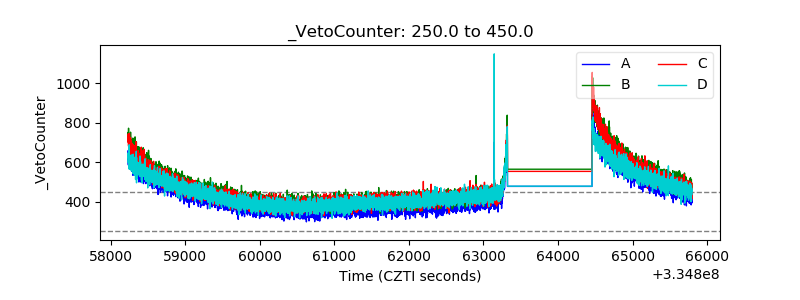 |