| Param | Original file | Final file |
|---|---|---|
| Filename | modeM0/AS1A09_008T02_9000003796_26342cztM0_level2.evt | modeM0/AS1A09_008T02_9000003796_26342cztM0_level2_quad_clean.evt |
| Size (bytes) | 741,392,640 | 79,493,760 |
| Size | 707.0 MB | 75.8 MB |
| Events in quadrant A | 3,218,100 | 566,595 |
| Events in quadrant B | 3,363,771 | 576,466 |
| Events in quadrant C | 3,457,327 | 543,315 |
| Events in quadrant D | 11,994,059 | 286,804 |
| Mode M0 | |||
|---|---|---|---|
| Quadrant | BADHDUFLAG | Total packets | Discarded packets |
| A | 0 | 13644 | 0 |
| B | 0 | 13990 | 0 |
| C | 0 | 14273 | 0 |
| D | 0 | 39876 | 0 |
| Mode M9 | |||
|---|---|---|---|
| Quadrant | BADHDUFLAG | Total packets | Discarded packets |
| A | 0 | 13 | 0 |
| B | 0 | 14 | 0 |
| C | 0 | 14 | 0 |
| D | 0 | 14 | 0 |
| Quadrant | Total seconds | Saturated seconds | Saturation percentage |
|---|---|---|---|
| A | 6200 | 33 | 0.532258% |
| B | 6200 | 93 | 1.500000% |
| C | 6200 | 83 | 1.338710% |
| D | 6200 | 4135 | 66.693548% |
Noise dominated data is calculated using 1-second bins in cleaned event files. If a bin has >2000 counts, and if more than 50% of those come from <1% of pixels, then it is considered to be noise-dominated and hence unusable.
| Quadrant | # 1 sec bins | Bins with >0 counts | Bins with >2000 counts | High rate bins dominated by noise | Noise dominated (total time) | Noise dominated (detector-on time) | Marked lightcurve |
|---|---|---|---|---|---|---|---|
| A | 7460 | 6201 | 0 | 0 | 0.00% | 0.00% | 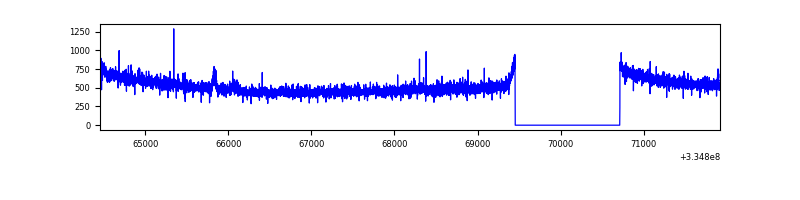 |
| B | 7460 | 6201 | 31 | 31 | 0.42% | 0.50% | 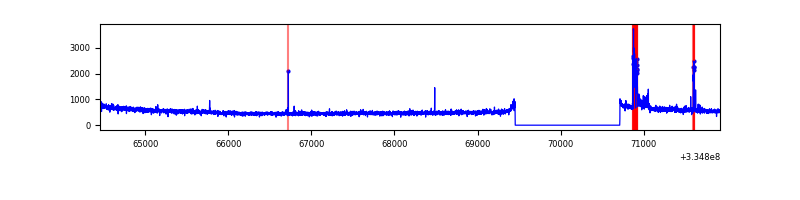 |
| C | 7460 | 6201 | 6 | 6 | 0.08% | 0.10% | 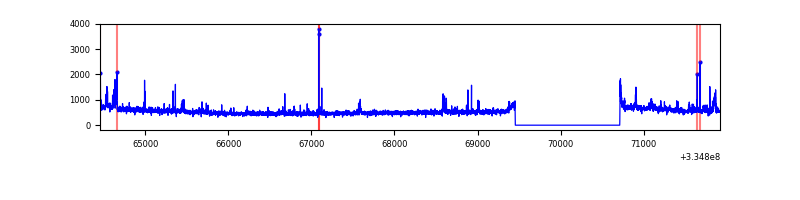 |
| D | 7460 | 6201 | 3374 | 3374 | 45.23% | 54.41% | 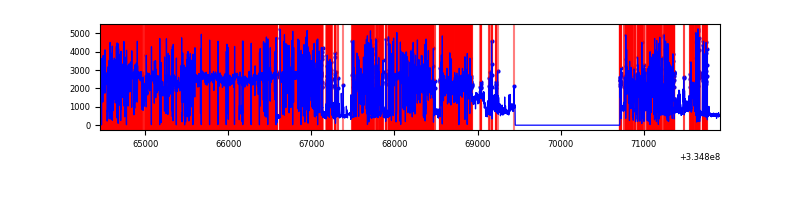 |
Top three noisy pixels from each quadrant. If the there are fewer than three noisy pixels in the level2.evt file, extra rows are filled as -1
| Pixel properties | Quadrant properties | ||||||
|---|---|---|---|---|---|---|---|
| Quadrant | DetID | PixID | Counts | Sigma | Mean | Median | Sigma |
| A | 6 | 16 | 25074 | 148.97 | 827 | 813 | 162.9 |
| A | 13 | 254 | 10101 | 57.03 | 827 | 813 | 162.9 |
| A | 3 | 137 | 7185 | 39.13 | 827 | 813 | 162.9 |
| B | 3 | 64 | 141420 | 932.99 | 820 | 803 | 150.7 |
| B | 0 | 230 | 20815 | 132.78 | 820 | 803 | 150.7 |
| B | 12 | 111 | 17673 | 111.93 | 820 | 803 | 150.7 |
| C | 3 | 233 | 250773 | 1393.9 | 784 | 792 | 179.3 |
| C | 14 | 238 | 130092 | 720.98 | 784 | 792 | 179.3 |
| C | 2 | 16 | 15674 | 82.98 | 784 | 792 | 179.3 |
| D | 1 | 52 | 10444542 | 108374.47 | 407 | 397 | 96.4 |
| D | 2 | 234 | 13909 | 140.21 | 407 | 397 | 96.4 |
| D | 2 | 120 | 4912 | 46.85 | 407 | 397 | 96.4 |
Histogram calculated using DETX and DETY for each event in the final _common_clean file
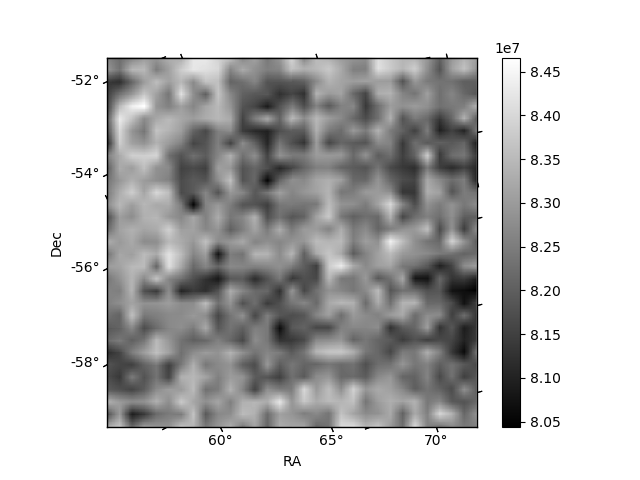
| Quadrant A | 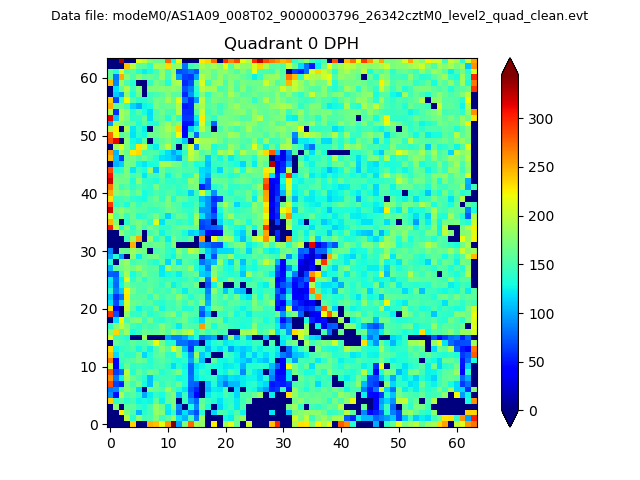 |
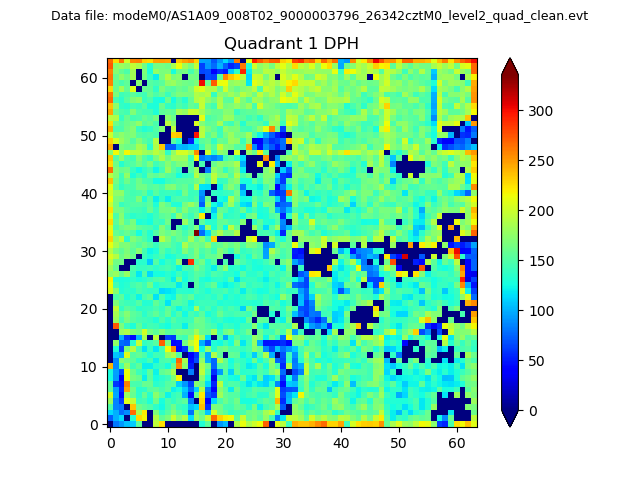 |
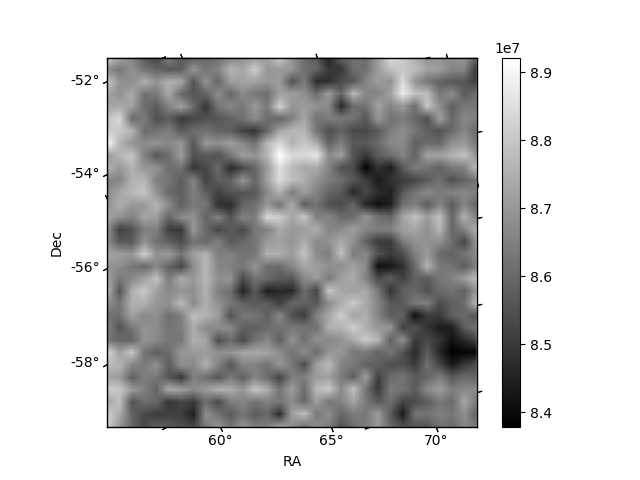
Quadrant B |
|---|---|---|---|
| Quadrant D |  |
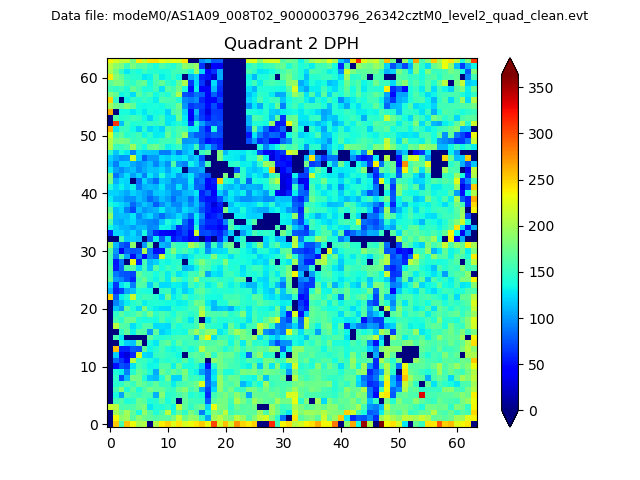 |
Quadrant C |
| Plot type | Count rate plots | Images |
|---|---|---|
| Comparison with Poisson distribution Blue bars denote a histogram of data divided into 1 sec bins. Red curve is a Poisson curve with rate = median count rate of data. |
 |
 |
| Quadrant-wise count rates Data is divided into 100 sec bins |
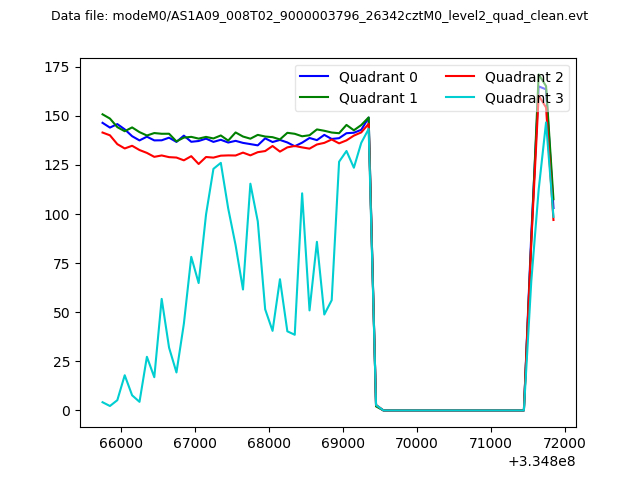 |
|
| Module-wise count rates for Quadrant A Data is divided into 100 sec bins |
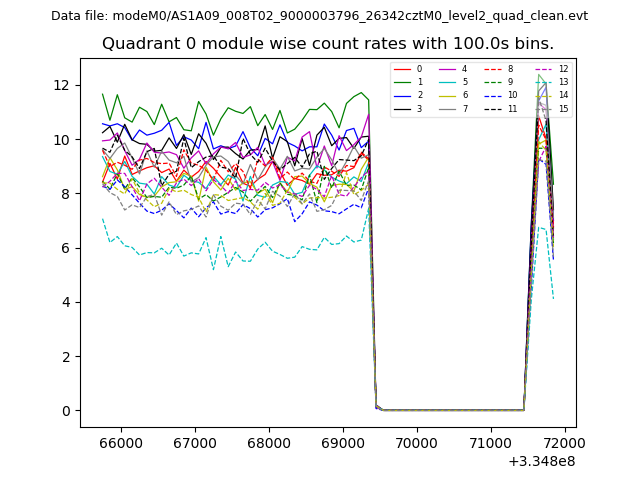 |
 |
| Module-wise count rates for Quadrant B Data is divided into 100 sec bins |
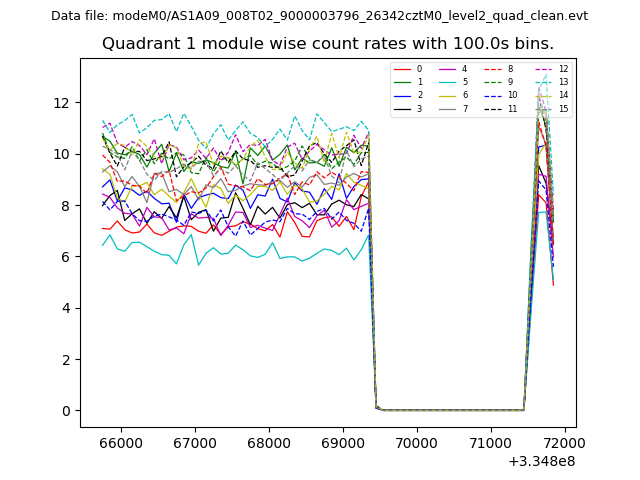 |
 |
| Module-wise count rates for Quadrant C Data is divided into 100 sec bins |
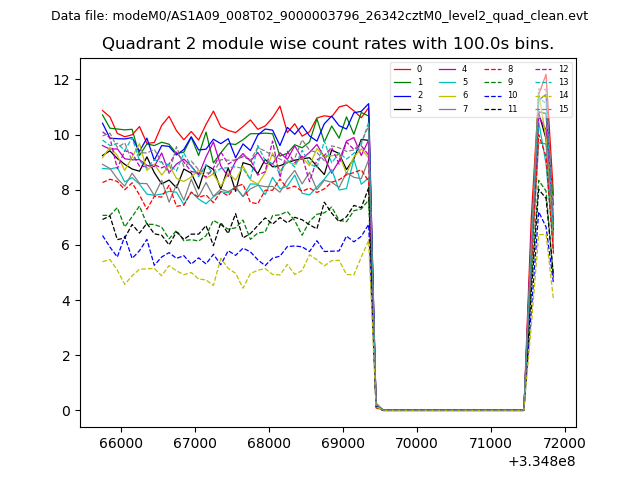 |
 |
| Module-wise count rates for Quadrant D Data is divided into 100 sec bins |
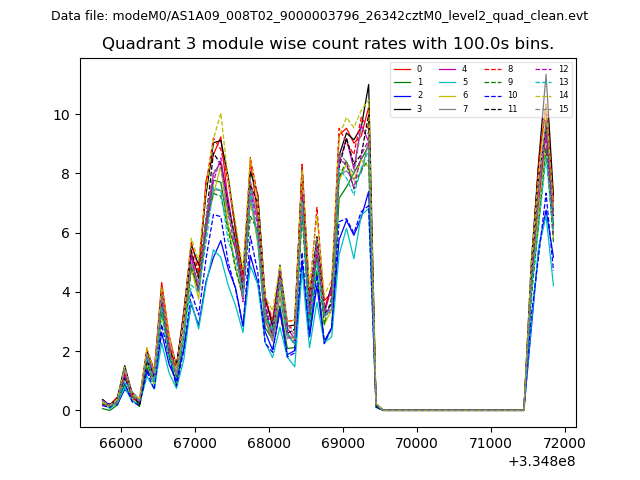 |
 |
| Parameter | Plot |
|---|---|
| CZT HV Monitor | 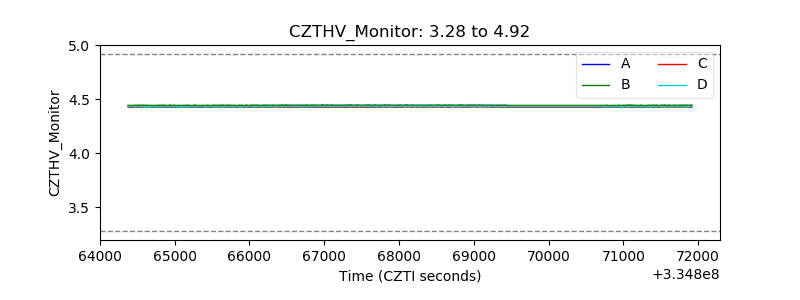 |
| D_VDD | 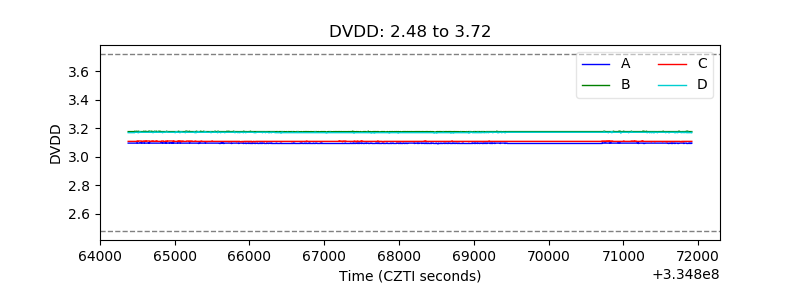 |
| Temperature 1 | 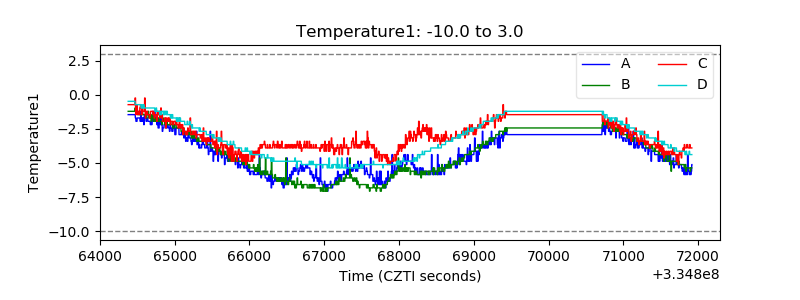 |
| Veto HV Monitor |  |
| Veto LLD | 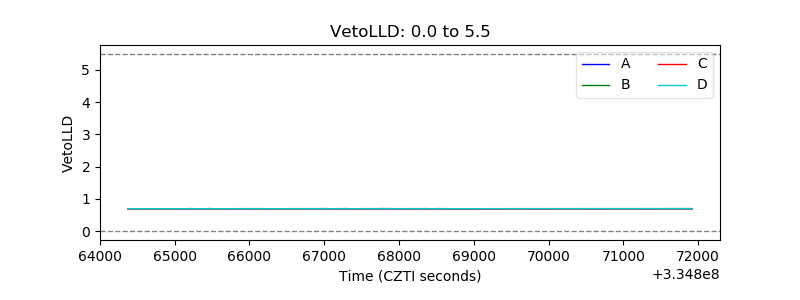 |
| Alpha Counter | 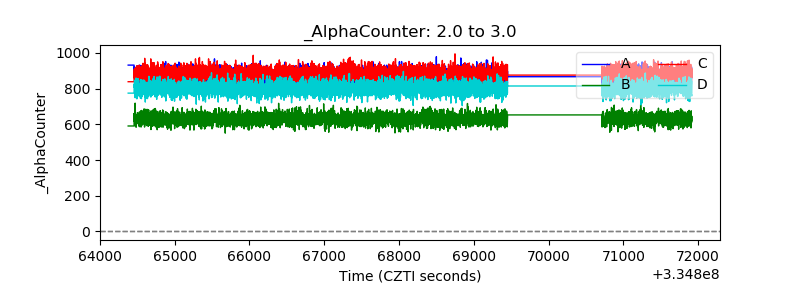 |
| _CPM_Rate | 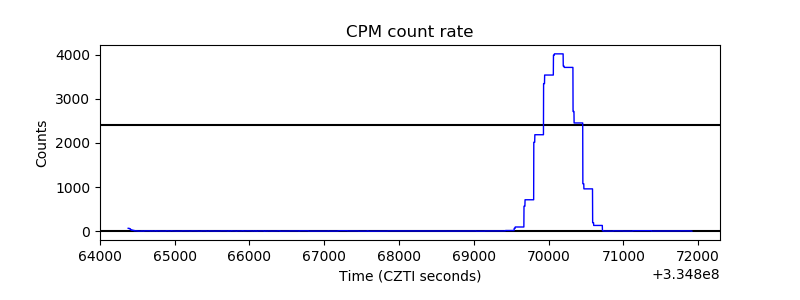 |
| CZT Counter | 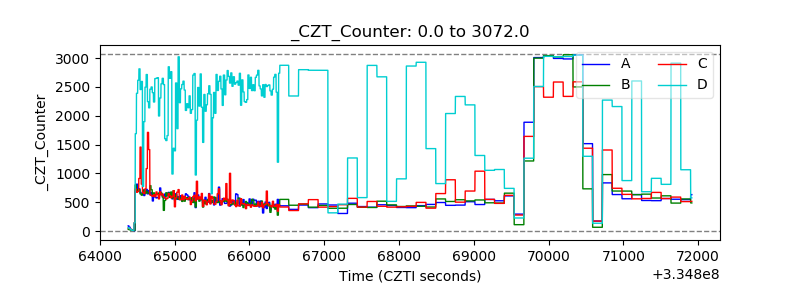 |
| +2.5 Volts monitor | 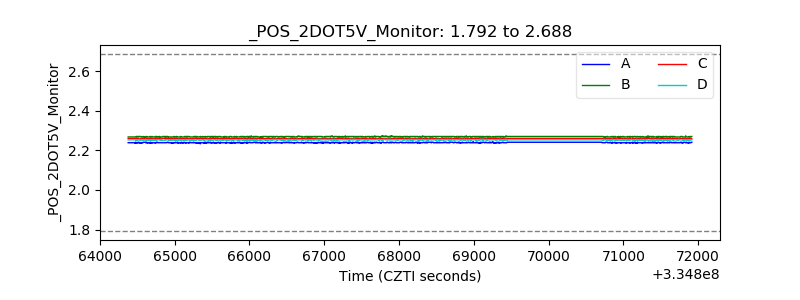 |
| +5 Volts monitor |  |
| _ROLL_ROT | 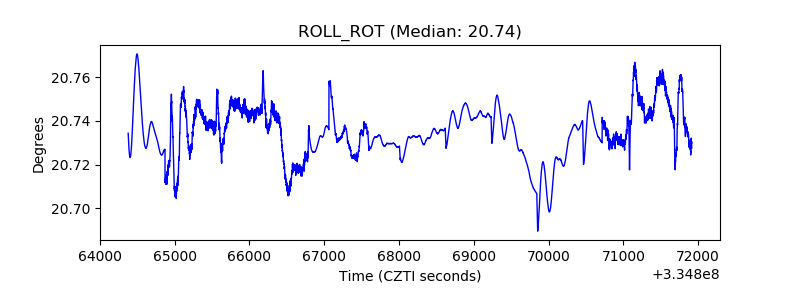 |
| _Roll_DEC | 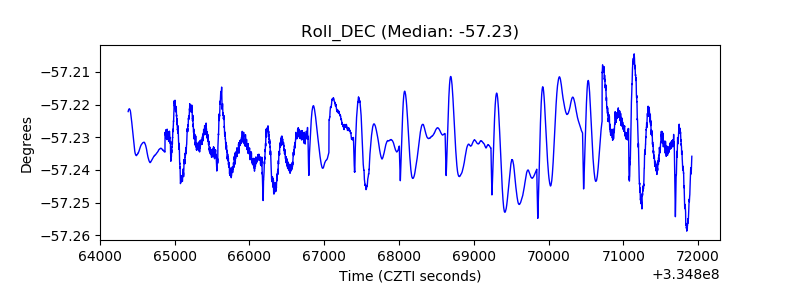 |
| _Roll_RA | 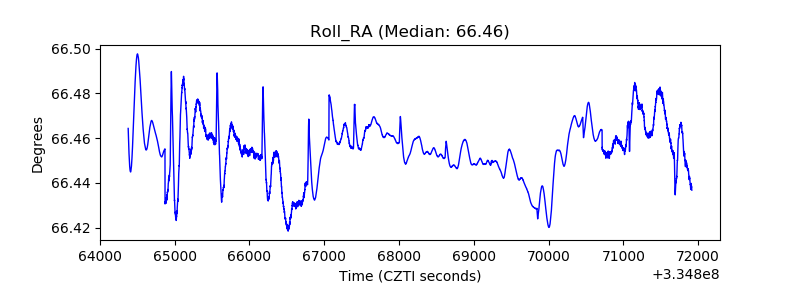 |
| Veto Counter | 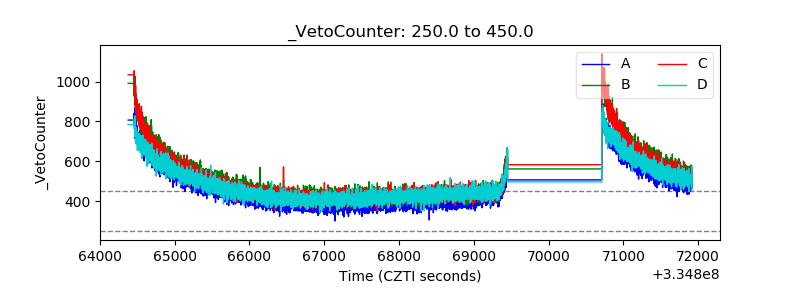 |