| Param | Original file | Final file |
|---|---|---|
| Filename | modeM0/AS1A09_008T02_9000003796_26343cztM0_level2.evt | modeM0/AS1A09_008T02_9000003796_26343cztM0_level2_quad_clean.evt |
| Size (bytes) | 537,773,760 | 106,295,040 |
| Size | 512.9 MB | 101.4 MB |
| Events in quadrant A | 3,245,414 | 713,177 |
| Events in quadrant B | 3,467,990 | 729,854 |
| Events in quadrant C | 3,515,657 | 689,192 |
| Events in quadrant D | 5,641,942 | 659,359 |
| Mode M0 | |||
|---|---|---|---|
| Quadrant | BADHDUFLAG | Total packets | Discarded packets |
| A | 0 | 13506 | 0 |
| B | 0 | 14171 | 0 |
| C | 0 | 14290 | 0 |
| D | 0 | 20717 | 0 |
| Mode M9 | |||
|---|---|---|---|
| Quadrant | BADHDUFLAG | Total packets | Discarded packets |
| A | 0 | 13 | 0 |
| B | 0 | 14 | 0 |
| C | 0 | 14 | 0 |
| D | 0 | 14 | 0 |
| Quadrant | Total seconds | Saturated seconds | Saturation percentage |
|---|---|---|---|
| A | 6129 | 64 | 1.044216% |
| B | 6129 | 140 | 2.284223% |
| C | 6129 | 117 | 1.908957% |
| D | 6128 | 893 | 14.572454% |
Noise dominated data is calculated using 1-second bins in cleaned event files. If a bin has >2000 counts, and if more than 50% of those come from <1% of pixels, then it is considered to be noise-dominated and hence unusable.
| Quadrant | # 1 sec bins | Bins with >0 counts | Bins with >2000 counts | High rate bins dominated by noise | Noise dominated (total time) | Noise dominated (detector-on time) | Marked lightcurve |
|---|---|---|---|---|---|---|---|
| A | 7439 | 6130 | 0 | 0 | 0.00% | 0.00% | 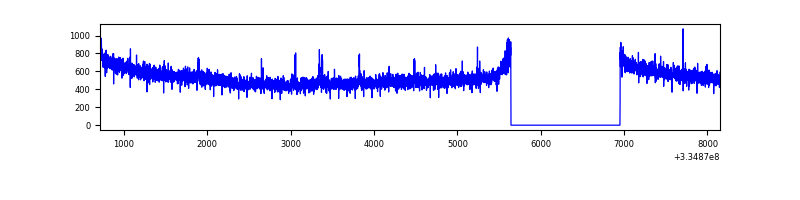 |
| B | 7439 | 6130 | 40 | 40 | 0.54% | 0.65% | 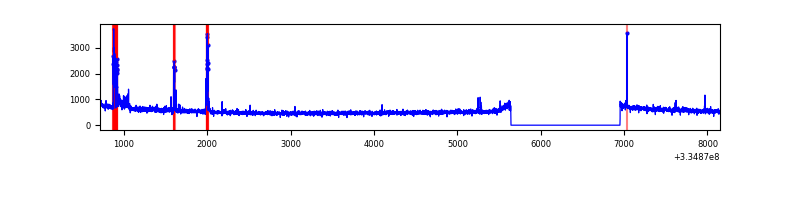 |
| C | 7439 | 6130 | 12 | 12 | 0.16% | 0.20% | 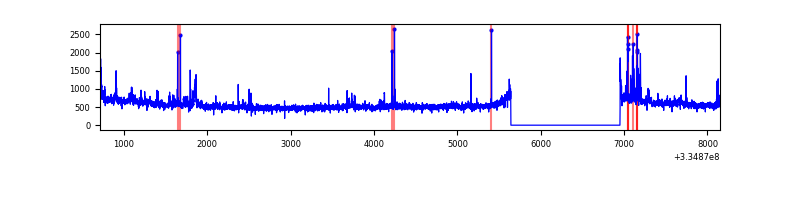 |
| D | 7438 | 6129 | 611 | 611 | 8.21% | 9.97% | 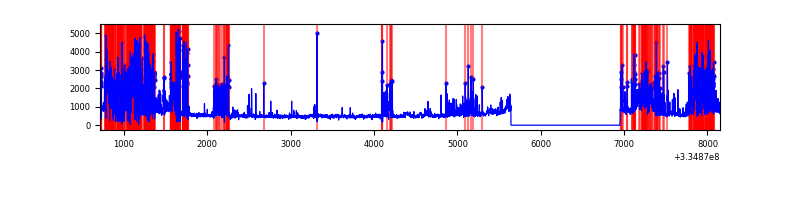 |
Top three noisy pixels from each quadrant. If the there are fewer than three noisy pixels in the level2.evt file, extra rows are filled as -1
| Pixel properties | Quadrant properties | ||||||
|---|---|---|---|---|---|---|---|
| Quadrant | DetID | PixID | Counts | Sigma | Mean | Median | Sigma |
| A | 12 | 16 | 18673 | 108.09 | 836 | 822 | 165.1 |
| A | 13 | 254 | 10348 | 57.68 | 836 | 822 | 165.1 |
| A | 12 | 194 | 8774 | 48.15 | 836 | 822 | 165.1 |
| B | 3 | 64 | 193162 | 1266.13 | 832 | 815 | 151.9 |
| B | 12 | 111 | 17569 | 110.28 | 832 | 815 | 151.9 |
| B | 0 | 230 | 16654 | 104.26 | 832 | 815 | 151.9 |
| C | 3 | 233 | 244483 | 1332.12 | 801 | 809 | 182.9 |
| C | 14 | 238 | 132764 | 721.37 | 801 | 809 | 182.9 |
| C | 2 | 16 | 13900 | 71.57 | 801 | 809 | 182.9 |
| D | 1 | 52 | 2862246 | 16572.07 | 728 | 712 | 172.7 |
| D | 2 | 234 | 24891 | 140.03 | 728 | 712 | 172.7 |
| D | 11 | 176 | 16195 | 89.67 | 728 | 712 | 172.7 |
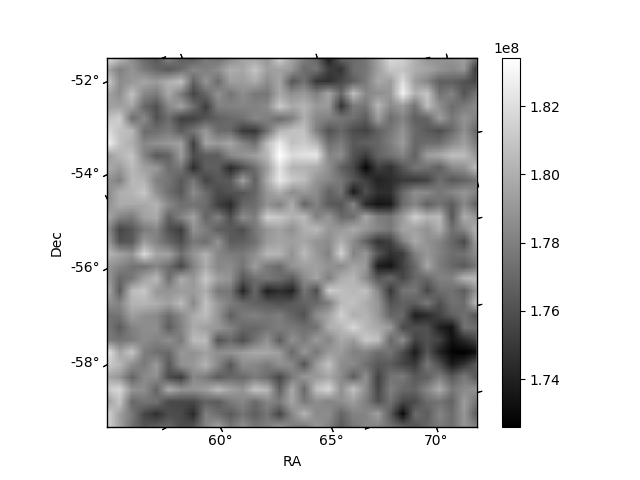
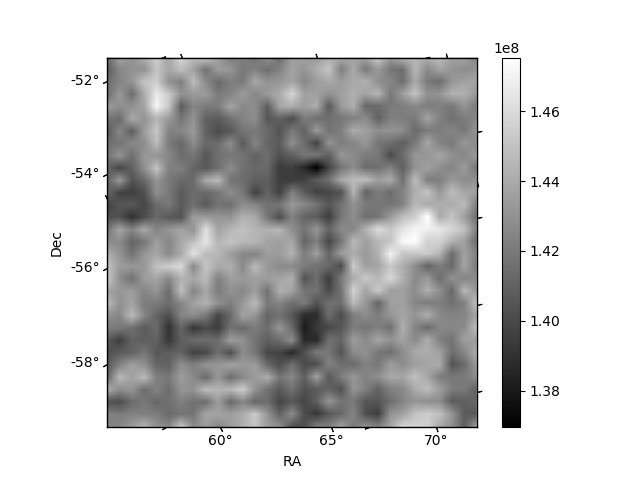
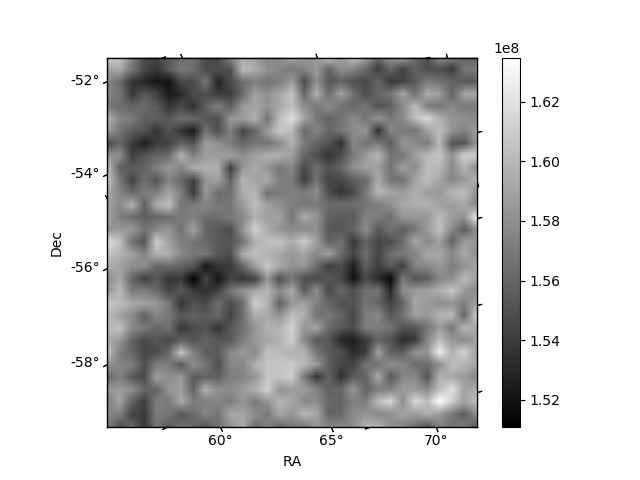
Histogram calculated using DETX and DETY for each event in the final _common_clean file
| Quadrant A | 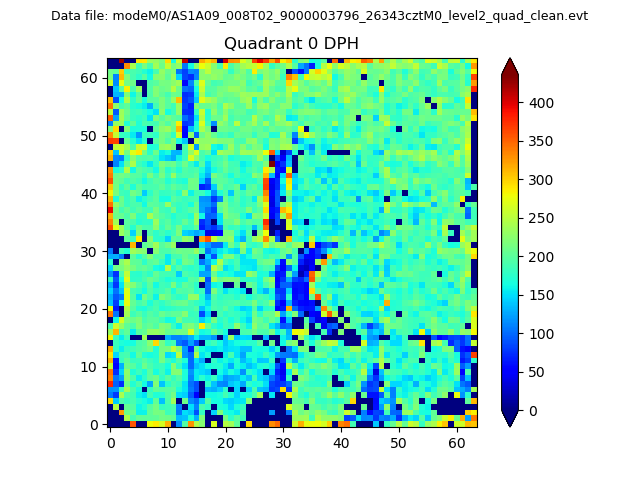 |
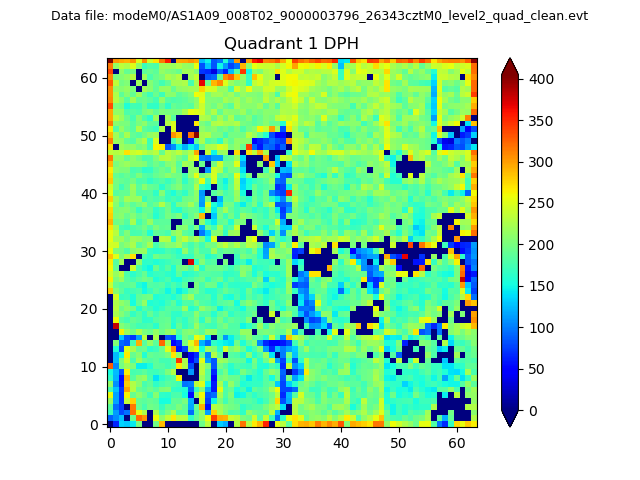 |
Quadrant B |
|---|---|---|---|
| Quadrant D |  |
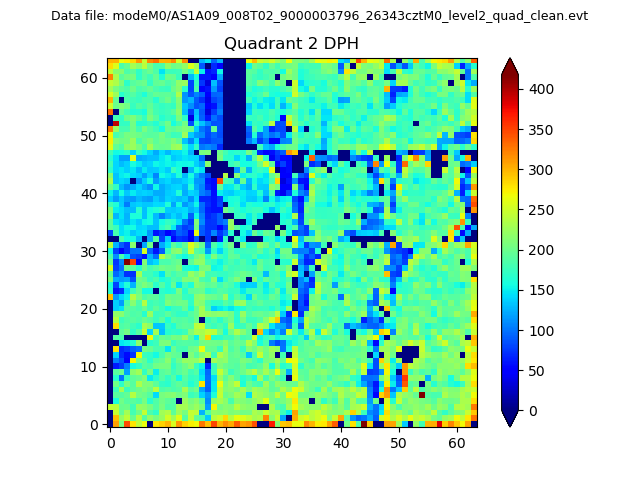 |
Quadrant C |
| Plot type | Count rate plots | Images |
|---|---|---|
| Comparison with Poisson distribution Blue bars denote a histogram of data divided into 1 sec bins. Red curve is a Poisson curve with rate = median count rate of data. |
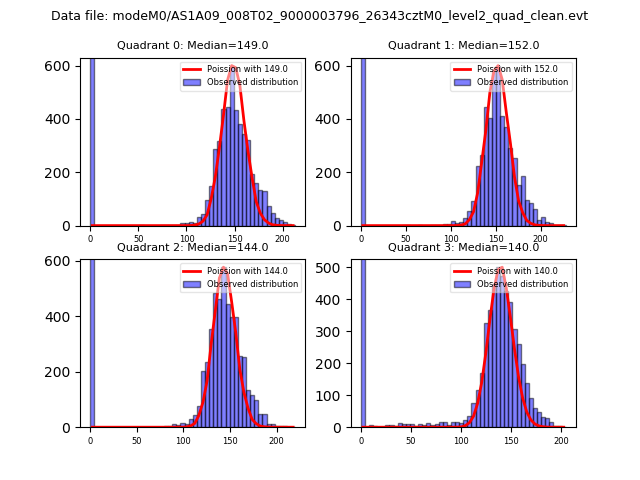 |
 |
| Quadrant-wise count rates Data is divided into 100 sec bins |
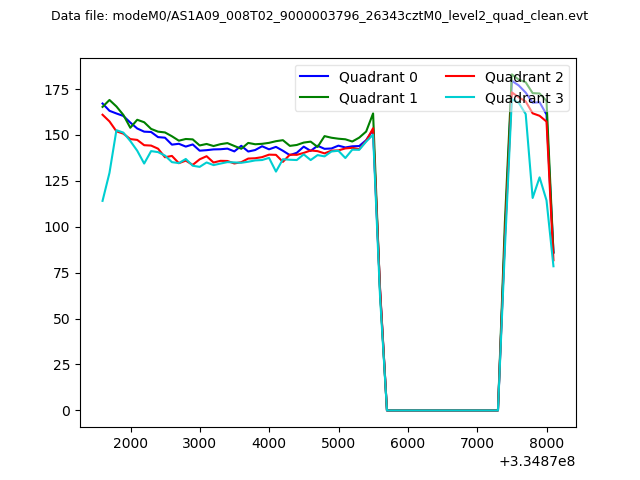 |
|
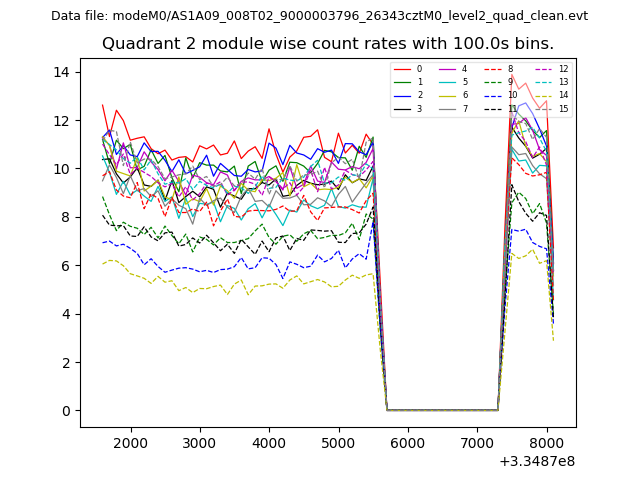
| Module-wise count rates for Quadrant A Data is divided into 100 sec bins |
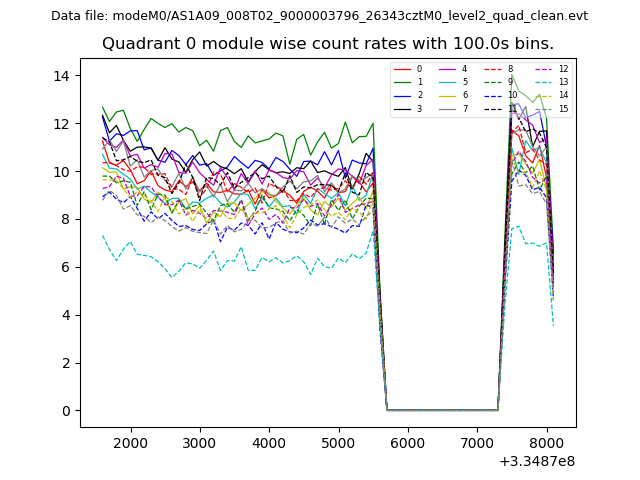 |
 |
| Module-wise count rates for Quadrant B Data is divided into 100 sec bins |
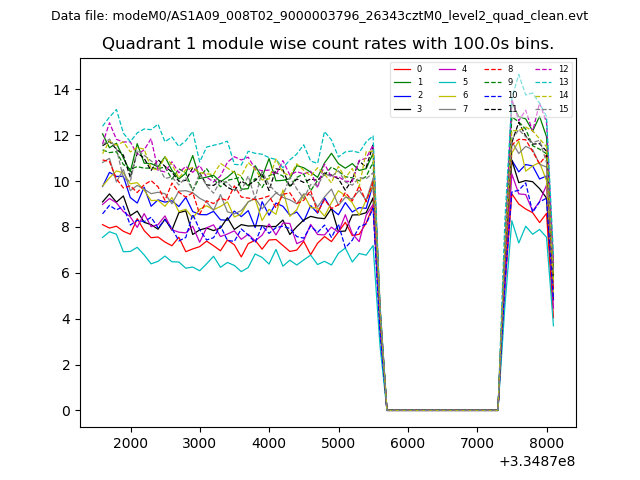 |
 |
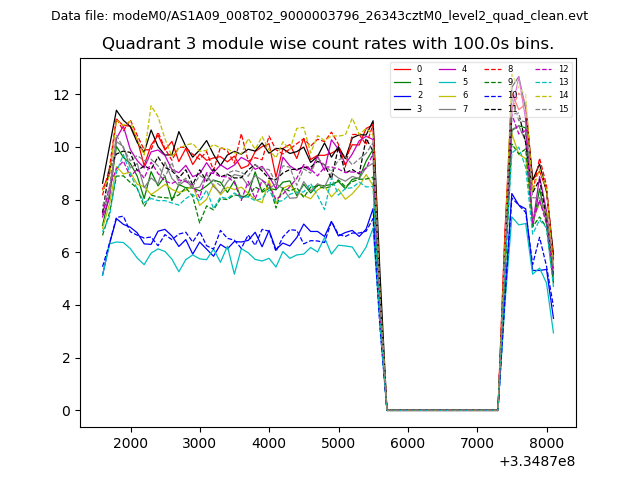
| Module-wise count rates for Quadrant C Data is divided into 100 sec bins |
 |
 |
| Module-wise count rates for Quadrant D Data is divided into 100 sec bins |
 |
 |
| Parameter | Plot |
|---|---|
| CZT HV Monitor | 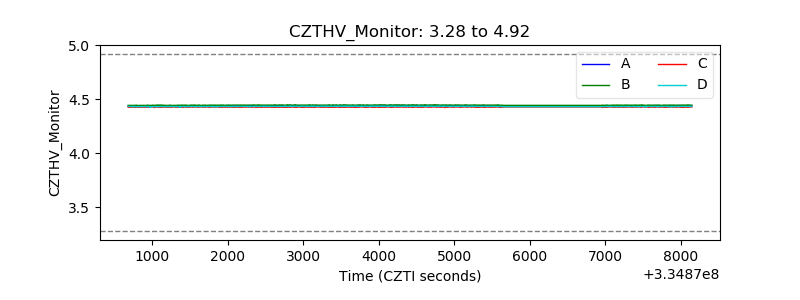 |
| D_VDD | 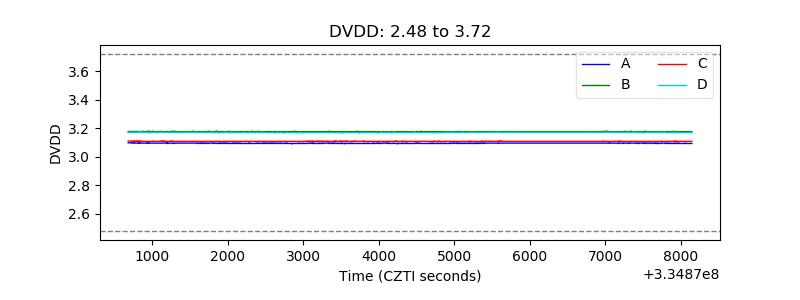 |
| Temperature 1 | 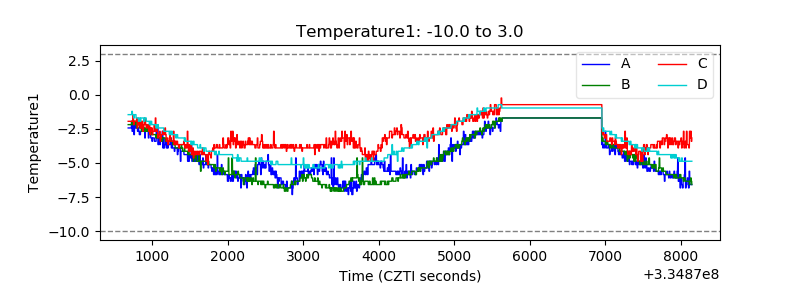 |
| Veto HV Monitor | 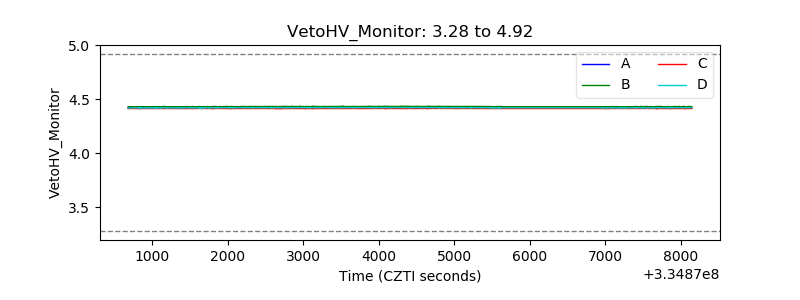 |
| Veto LLD | 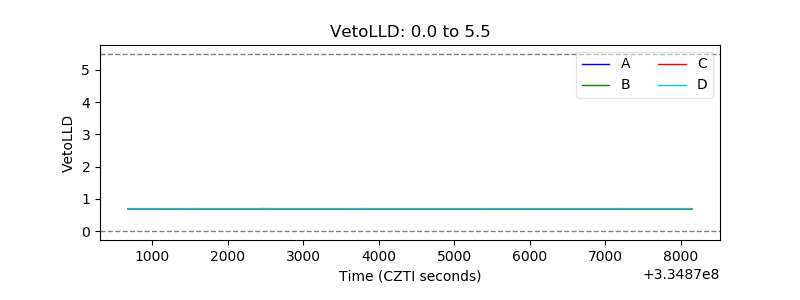 |
| Alpha Counter |  |
| _CPM_Rate | 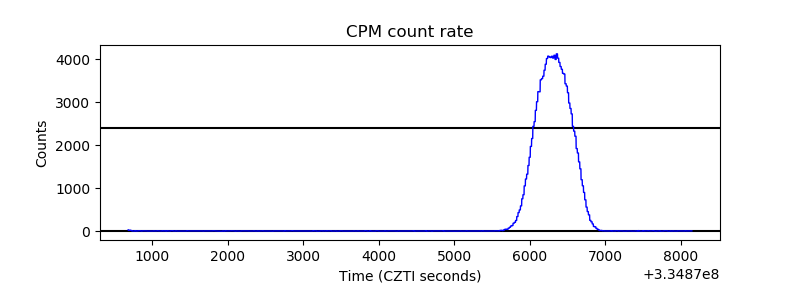 |
| CZT Counter |  |
| +2.5 Volts monitor | 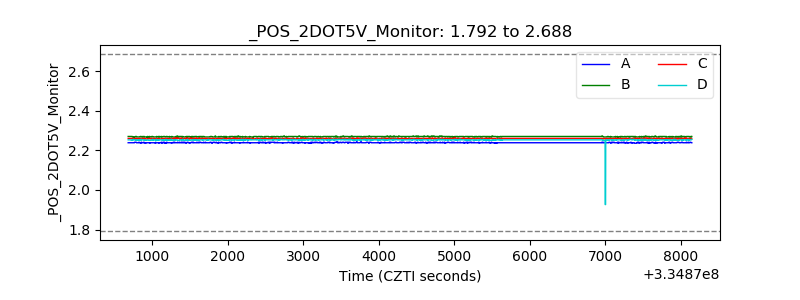 |
| +5 Volts monitor |  |
| _ROLL_ROT | 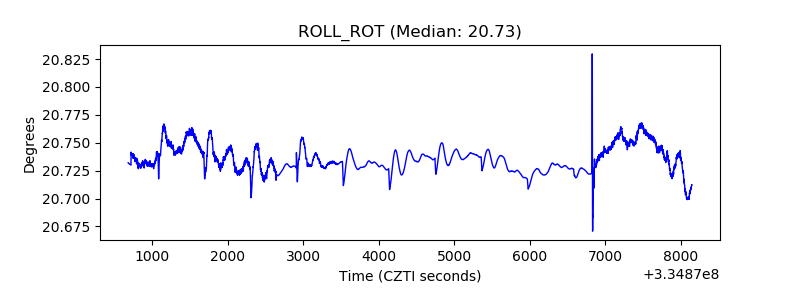 |
| _Roll_DEC | 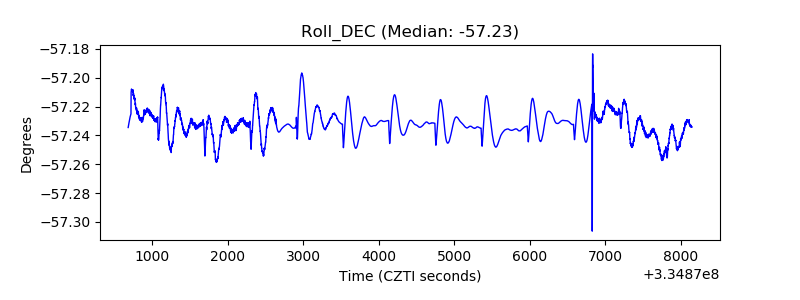 |
| _Roll_RA |  |
| Veto Counter | 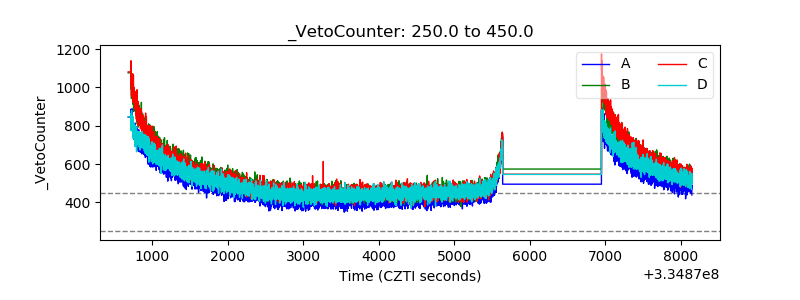 |