| Param | Original file | Final file |
|---|---|---|
| Filename | modeM0/AS1A09_008T02_9000003796_26344cztM0_level2.evt | modeM0/AS1A09_008T02_9000003796_26344cztM0_level2_quad_clean.evt |
| Size (bytes) | 662,345,280 | 121,579,200 |
| Size | 631.7 MB | 115.9 MB |
| Events in quadrant A | 3,221,178 | 866,636 |
| Events in quadrant B | 3,329,912 | 893,574 |
| Events in quadrant C | 3,565,971 | 846,840 |
| Events in quadrant D | 9,522,139 | 641,275 |
| Mode M0 | |||
|---|---|---|---|
| Quadrant | BADHDUFLAG | Total packets | Discarded packets |
| A | 0 | 13369 | 0 |
| B | 0 | 13690 | 0 |
| C | 0 | 14363 | 0 |
| D | 0 | 32469 | 0 |
| Mode M9 | |||
|---|---|---|---|
| Quadrant | BADHDUFLAG | Total packets | Discarded packets |
| A | 0 | 18 | 0 |
| B | 0 | 19 | 0 |
| C | 0 | 19 | 0 |
| D | 0 | 19 | 0 |
| Quadrant | Total seconds | Saturated seconds | Saturation percentage |
|---|---|---|---|
| A | 6207 | 63 | 1.014983% |
| B | 6207 | 93 | 1.498308% |
| C | 6206 | 137 | 2.207541% |
| D | 6206 | 2275 | 36.658073% |
Noise dominated data is calculated using 1-second bins in cleaned event files. If a bin has >2000 counts, and if more than 50% of those come from <1% of pixels, then it is considered to be noise-dominated and hence unusable.
| Quadrant | # 1 sec bins | Bins with >0 counts | Bins with >2000 counts | High rate bins dominated by noise | Noise dominated (total time) | Noise dominated (detector-on time) | Marked lightcurve |
|---|---|---|---|---|---|---|---|
| A | 7547 | 6208 | 0 | 0 | 0.00% | 0.00% | 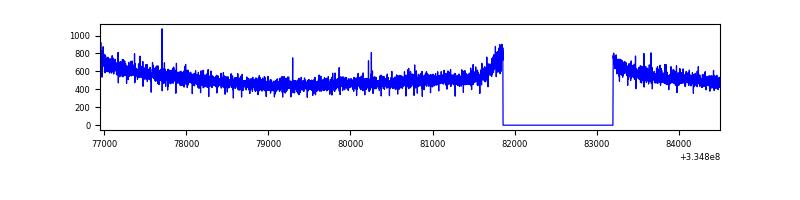 |
| B | 7547 | 6208 | 1 | 1 | 0.01% | 0.02% | 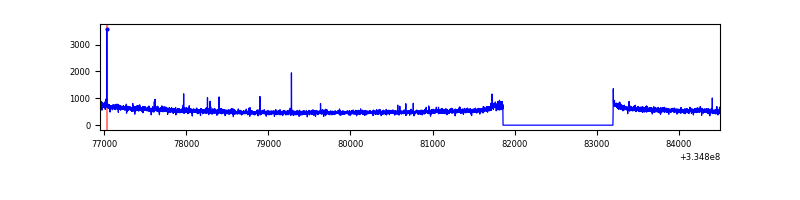 |
| C | 7546 | 6207 | 7 | 7 | 0.09% | 0.11% | 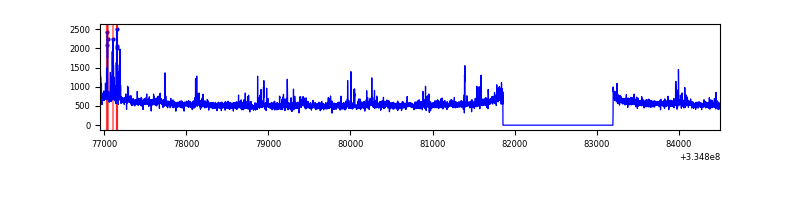 |
| D | 7546 | 6206 | 2043 | 2043 | 27.07% | 32.92% | 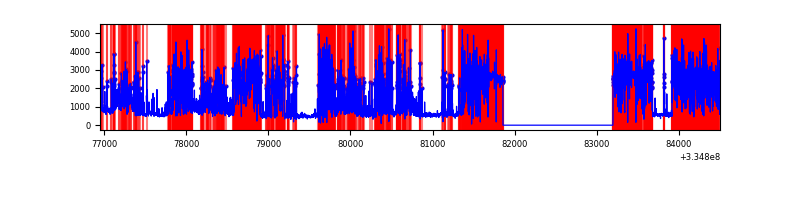 |
Top three noisy pixels from each quadrant. If the there are fewer than three noisy pixels in the level2.evt file, extra rows are filled as -1
| Pixel properties | Quadrant properties | ||||||
|---|---|---|---|---|---|---|---|
| Quadrant | DetID | PixID | Counts | Sigma | Mean | Median | Sigma |
| A | 13 | 254 | 10271 | 58.17 | 834 | 819 | 162.5 |
| A | 3 | 137 | 7183 | 39.16 | 834 | 819 | 162.5 |
| A | 0 | 226 | 7039 | 38.28 | 834 | 819 | 162.5 |
| B | 0 | 230 | 21588 | 134.56 | 840 | 822 | 154.3 |
| B | 0 | 219 | 21497 | 133.97 | 840 | 822 | 154.3 |
| B | 12 | 111 | 17534 | 108.29 | 840 | 822 | 154.3 |
| C | 3 | 233 | 250068 | 1332.25 | 813 | 822 | 187.1 |
| C | 14 | 238 | 134817 | 716.22 | 813 | 822 | 187.1 |
| C | 2 | 16 | 14961 | 75.57 | 813 | 822 | 187.1 |
| D | 1 | 52 | 6971520 | 44710.33 | 661 | 648 | 155.9 |
| D | 11 | 176 | 22532 | 140.36 | 661 | 648 | 155.9 |
| D | 2 | 234 | 21792 | 135.62 | 661 | 648 | 155.9 |
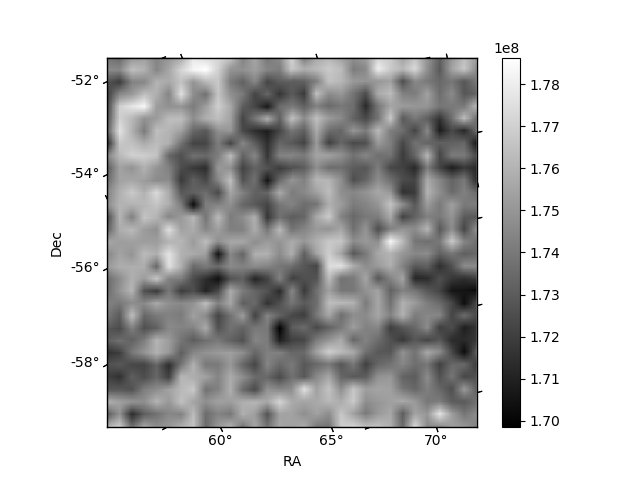
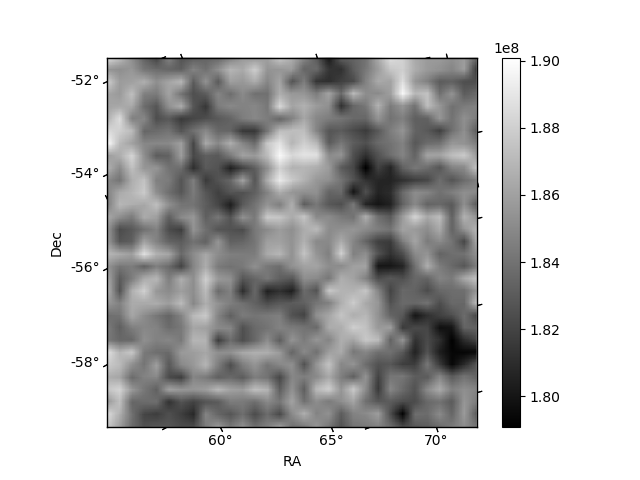
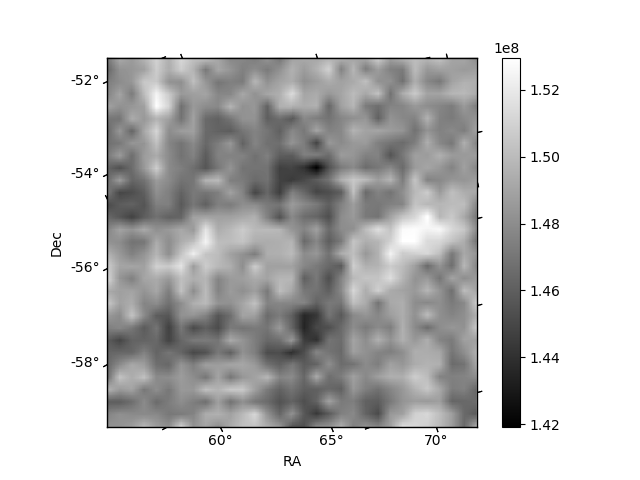
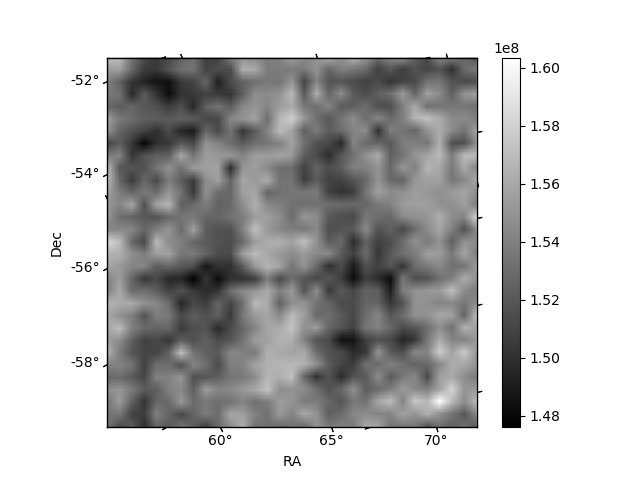
Histogram calculated using DETX and DETY for each event in the final _common_clean file
| Quadrant A | 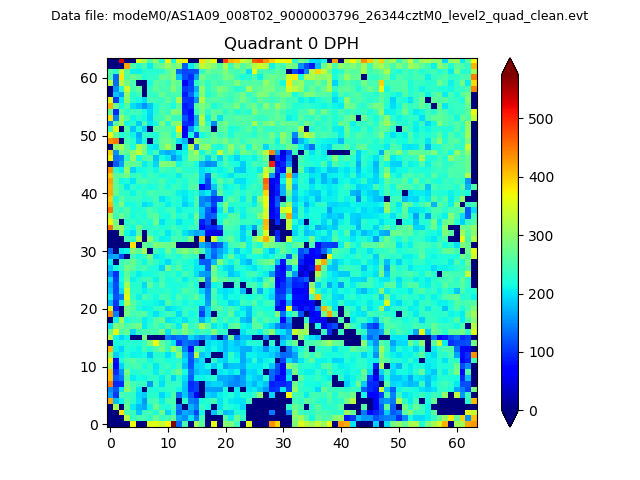 |
 |
Quadrant B |
|---|---|---|---|
| Quadrant D | 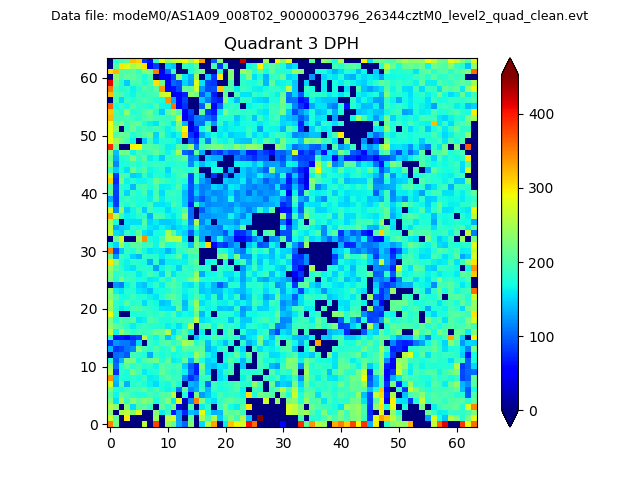 |
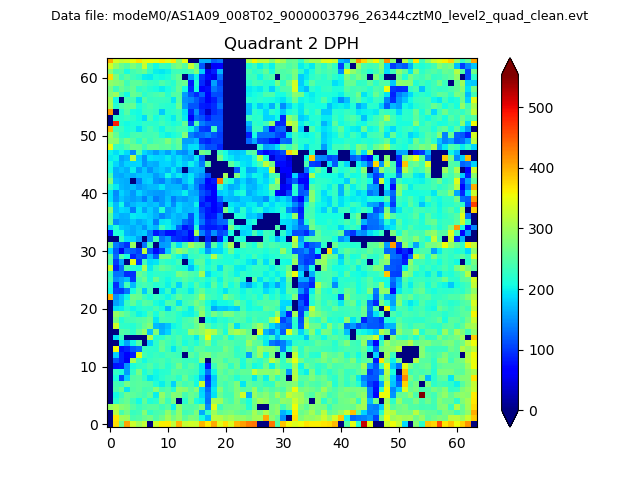 |
Quadrant C |
| Plot type | Count rate plots | Images |
|---|---|---|
| Comparison with Poisson distribution Blue bars denote a histogram of data divided into 1 sec bins. Red curve is a Poisson curve with rate = median count rate of data. |
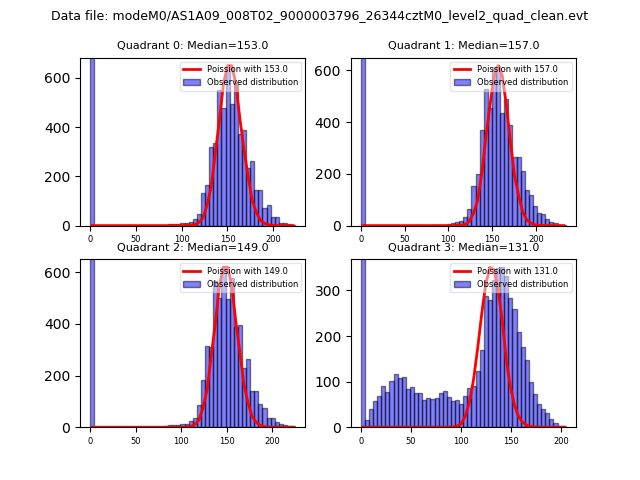 |
 |
| Quadrant-wise count rates Data is divided into 100 sec bins |
 |
|
| Module-wise count rates for Quadrant A Data is divided into 100 sec bins |
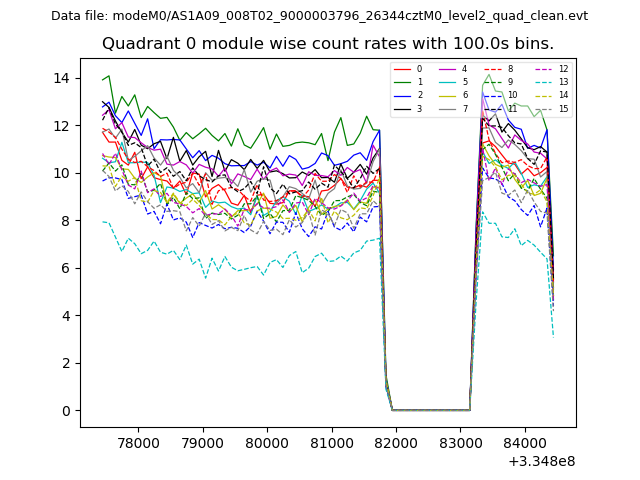 |
 |
| Module-wise count rates for Quadrant B Data is divided into 100 sec bins |
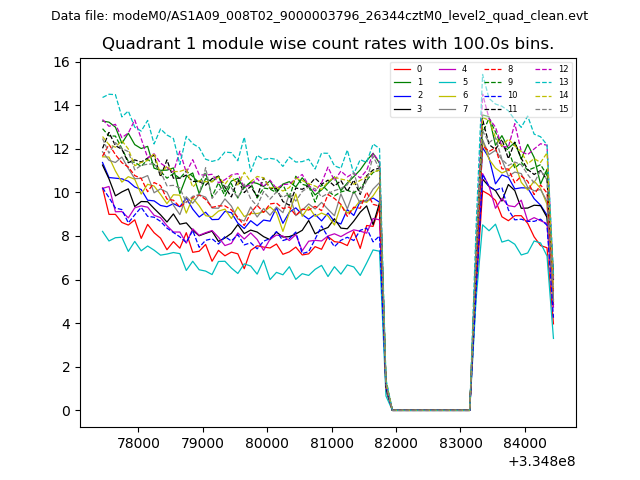 |
 |
| Module-wise count rates for Quadrant C Data is divided into 100 sec bins |
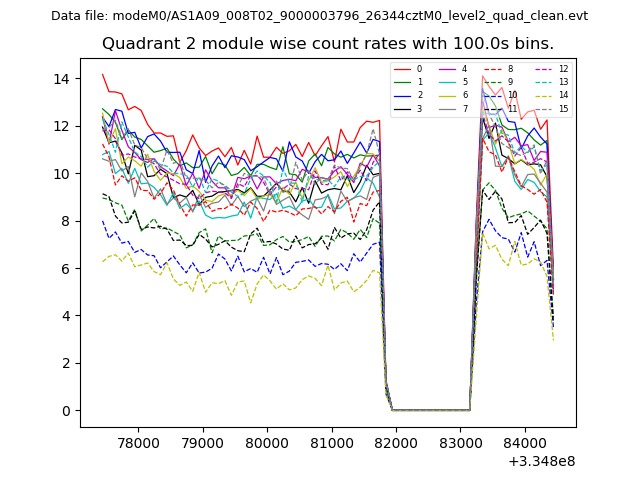 |
 |
| Module-wise count rates for Quadrant D Data is divided into 100 sec bins |
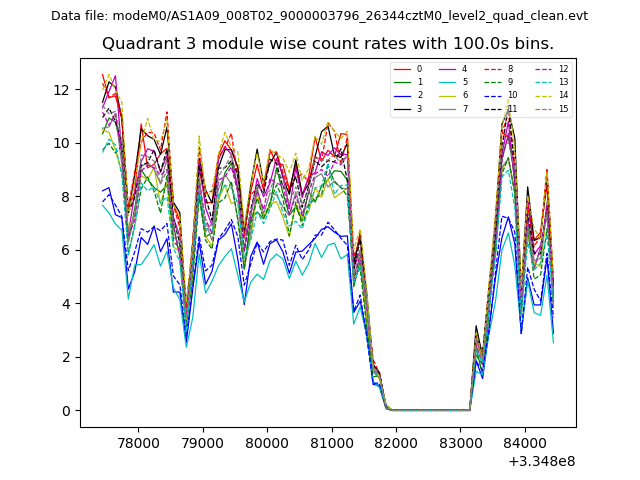 |
 |
| Parameter | Plot |
|---|---|
| CZT HV Monitor | 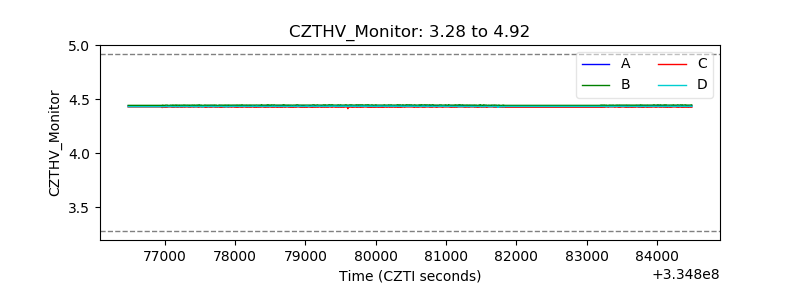 |
| D_VDD | 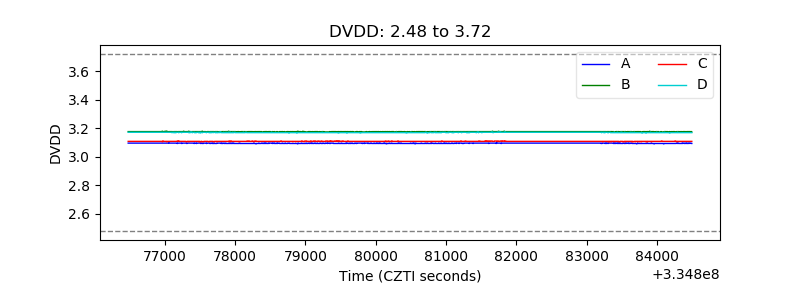 |
| Temperature 1 | 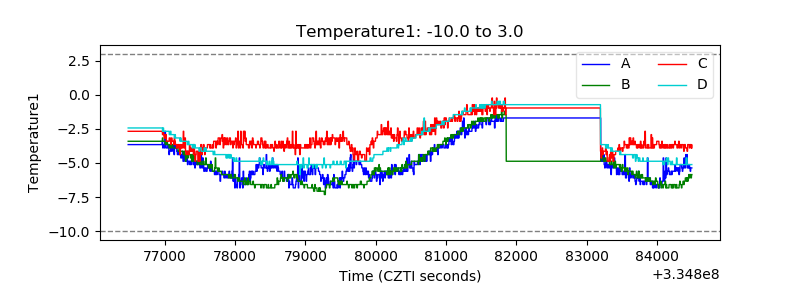 |
| Veto HV Monitor |  |
| Veto LLD | 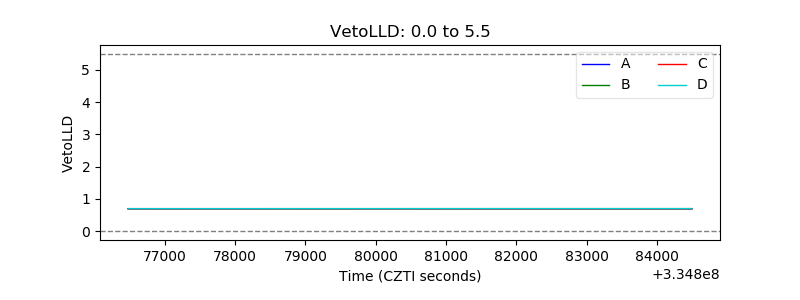 |
| Alpha Counter | 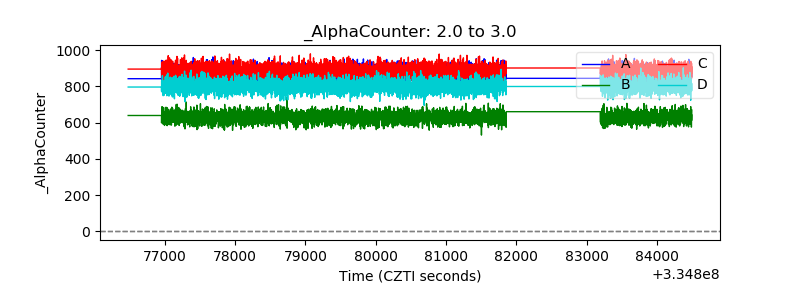 |
| _CPM_Rate | 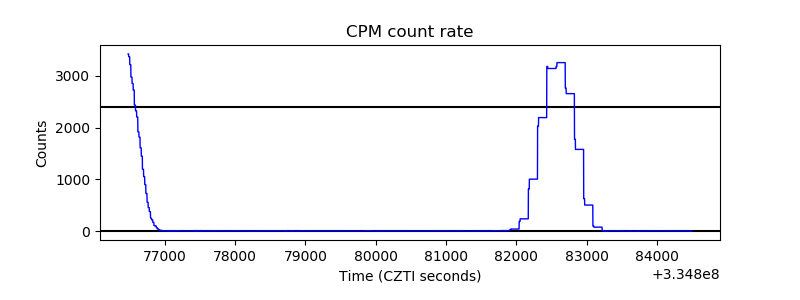 |
| CZT Counter | 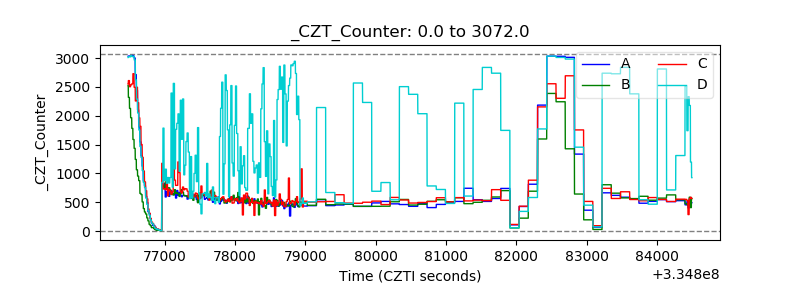 |
| +2.5 Volts monitor |  |
| +5 Volts monitor |  |
| _ROLL_ROT | 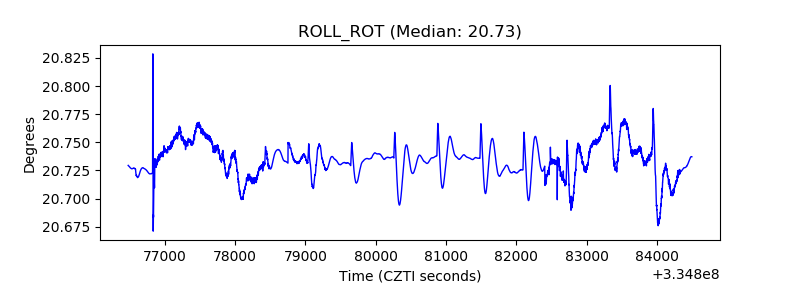 |
| _Roll_DEC | 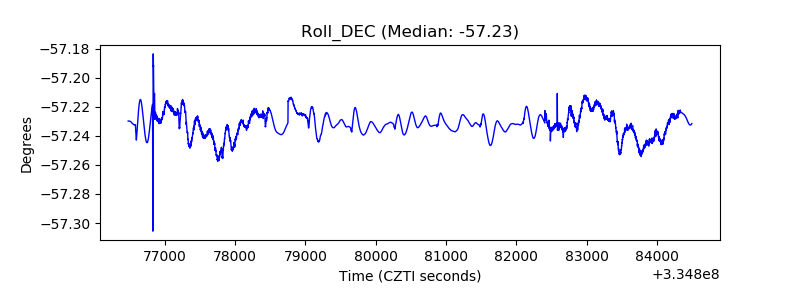 |
| _Roll_RA |  |
| Veto Counter | 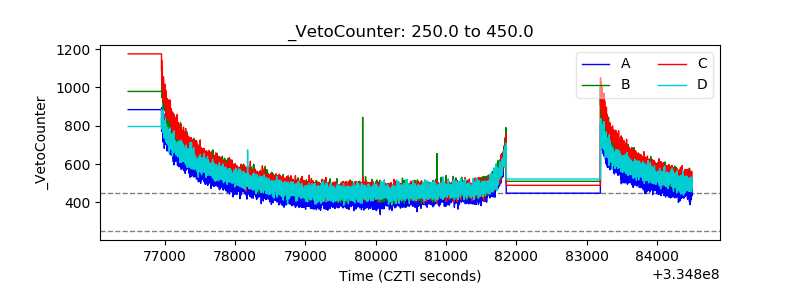 |