| Param | Original file | Final file |
|---|---|---|
| Filename | modeM0/AS1A09_008T02_9000003796_26345cztM0_level2.evt | modeM0/AS1A09_008T02_9000003796_26345cztM0_level2_quad_clean.evt |
| Size (bytes) | 732,983,040 | 117,659,520 |
| Size | 699.0 MB | 112.2 MB |
| Events in quadrant A | 3,103,989 | 854,080 |
| Events in quadrant B | 3,186,290 | 881,395 |
| Events in quadrant C | 3,462,489 | 845,159 |
| Events in quadrant D | 12,025,943 | 548,191 |
| Mode M0 | |||
|---|---|---|---|
| Quadrant | BADHDUFLAG | Total packets | Discarded packets |
| A | 0 | 12982 | 0 |
| B | 0 | 13216 | 0 |
| C | 0 | 13963 | 0 |
| D | 0 | 39900 | 0 |
| Mode M9 | |||
|---|---|---|---|
| Quadrant | BADHDUFLAG | Total packets | Discarded packets |
| A | 0 | 14 | 0 |
| B | 0 | 15 | 0 |
| C | 0 | 15 | 0 |
| D | 0 | 15 | 0 |
| Quadrant | Total seconds | Saturated seconds | Saturation percentage |
|---|---|---|---|
| A | 6208 | 20 | 0.322165% |
| B | 6207 | 40 | 0.644434% |
| C | 6207 | 95 | 1.530530% |
| D | 6207 | 3477 | 56.017400% |
Noise dominated data is calculated using 1-second bins in cleaned event files. If a bin has >2000 counts, and if more than 50% of those come from <1% of pixels, then it is considered to be noise-dominated and hence unusable.
| Quadrant | # 1 sec bins | Bins with >0 counts | Bins with >2000 counts | High rate bins dominated by noise | Noise dominated (total time) | Noise dominated (detector-on time) | Marked lightcurve |
|---|---|---|---|---|---|---|---|
| A | 7548 | 6209 | 0 | 0 | 0.00% | 0.00% |  |
| B | 7547 | 6208 | 1 | 1 | 0.01% | 0.02% |  |
| C | 7547 | 6208 | 9 | 9 | 0.12% | 0.14% |  |
| D | 7547 | 6208 | 3245 | 3245 | 43.00% | 52.27% | 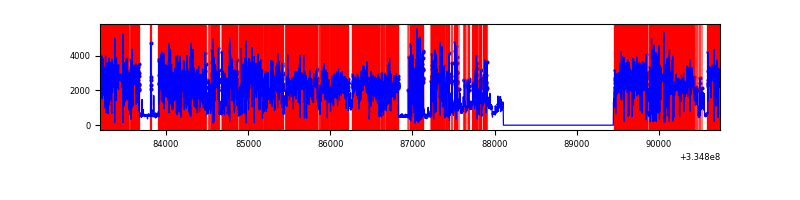 |
Top three noisy pixels from each quadrant. If the there are fewer than three noisy pixels in the level2.evt file, extra rows are filled as -1
| Pixel properties | Quadrant properties | ||||||
|---|---|---|---|---|---|---|---|
| Quadrant | DetID | PixID | Counts | Sigma | Mean | Median | Sigma |
| A | 13 | 254 | 10275 | 60.05 | 803 | 787 | 158.0 |
| A | 3 | 137 | 6834 | 38.27 | 803 | 787 | 158.0 |
| A | 0 | 226 | 6786 | 37.97 | 803 | 787 | 158.0 |
| B | 12 | 111 | 17299 | 110.62 | 809 | 790 | 149.2 |
| B | 11 | 111 | 15711 | 99.98 | 809 | 790 | 149.2 |
| B | 0 | 230 | 14082 | 89.06 | 809 | 790 | 149.2 |
| C | 3 | 233 | 234924 | 1290.53 | 789 | 797 | 181.4 |
| C | 14 | 238 | 130131 | 712.9 | 789 | 797 | 181.4 |
| C | 2 | 16 | 22547 | 119.89 | 789 | 797 | 181.4 |
| D | 1 | 52 | 9770278 | 72057.84 | 581 | 569 | 135.6 |
| D | 2 | 234 | 18694 | 133.68 | 581 | 569 | 135.6 |
| D | 11 | 176 | 17020 | 121.34 | 581 | 569 | 135.6 |
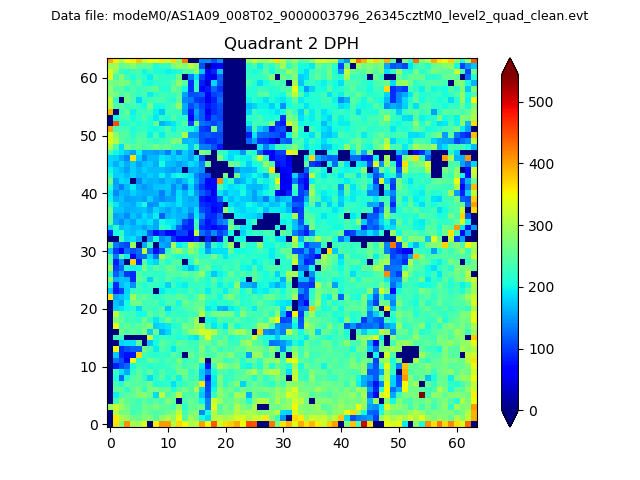
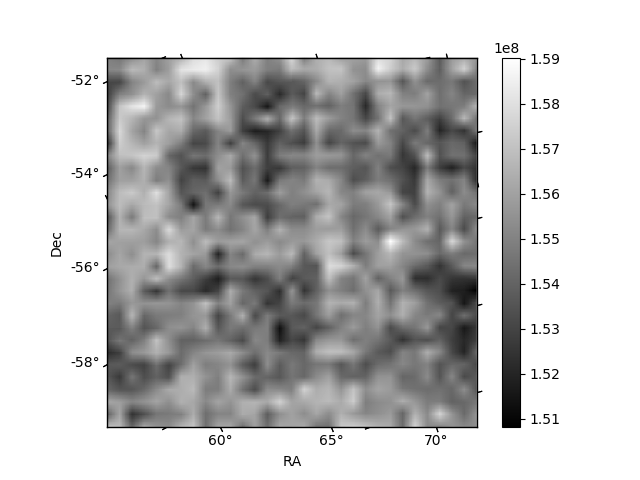
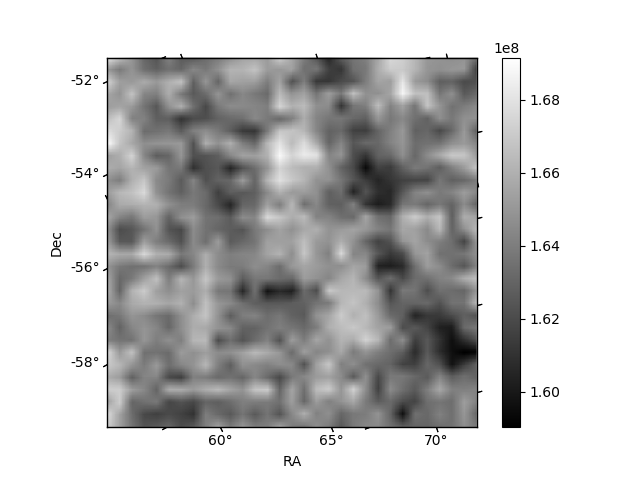
Histogram calculated using DETX and DETY for each event in the final _common_clean file
| Quadrant A | 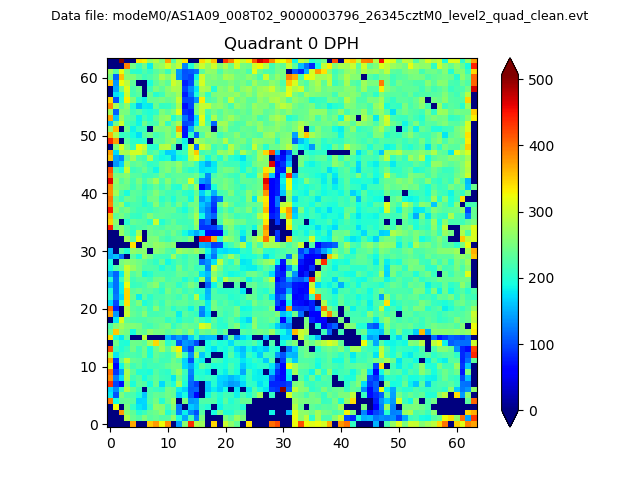 |
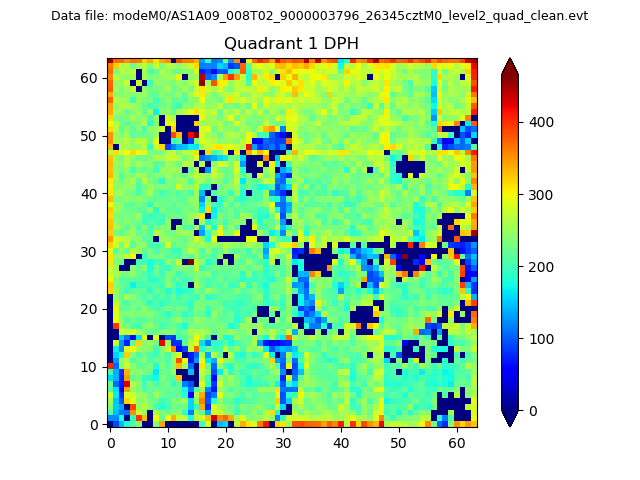 |
Quadrant B |
|---|---|---|---|
| Quadrant D | 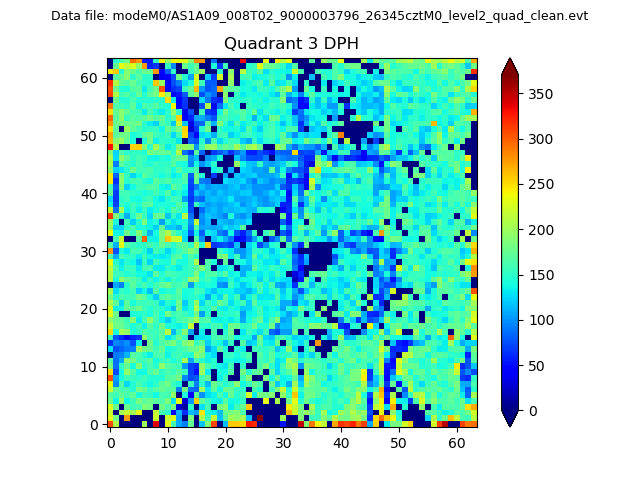 |
 |
Quadrant C |
| Plot type | Count rate plots | Images |
|---|---|---|
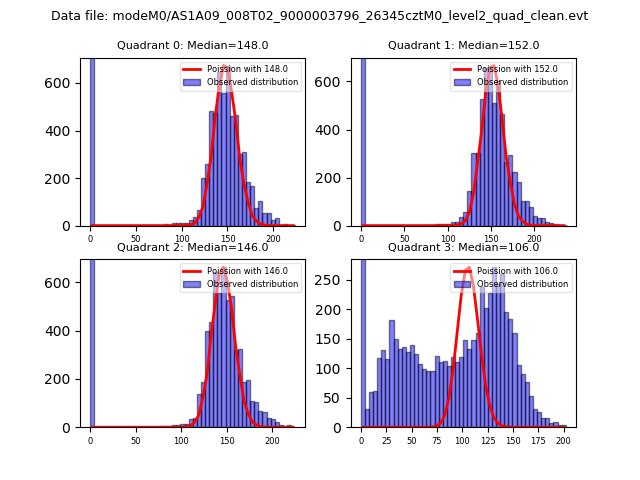
| Comparison with Poisson distribution Blue bars denote a histogram of data divided into 1 sec bins. Red curve is a Poisson curve with rate = median count rate of data. |
 |
 |
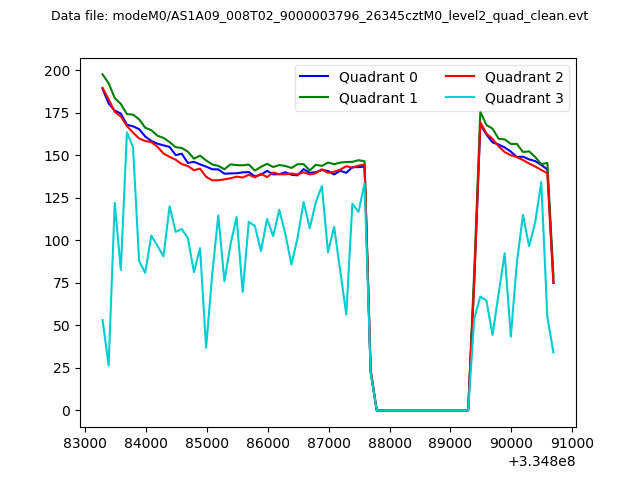
| Quadrant-wise count rates Data is divided into 100 sec bins |
 |
|
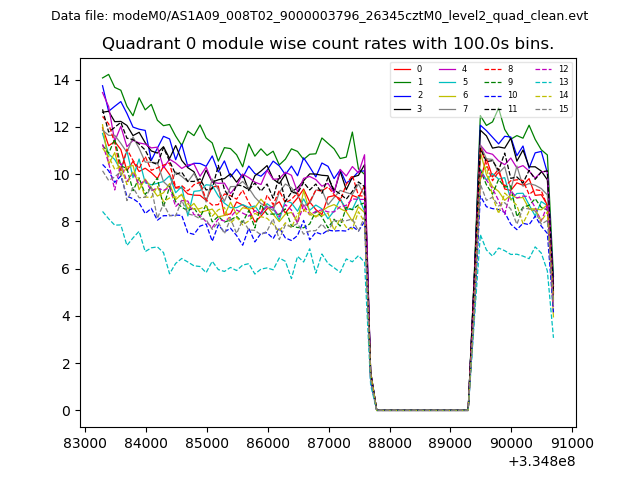
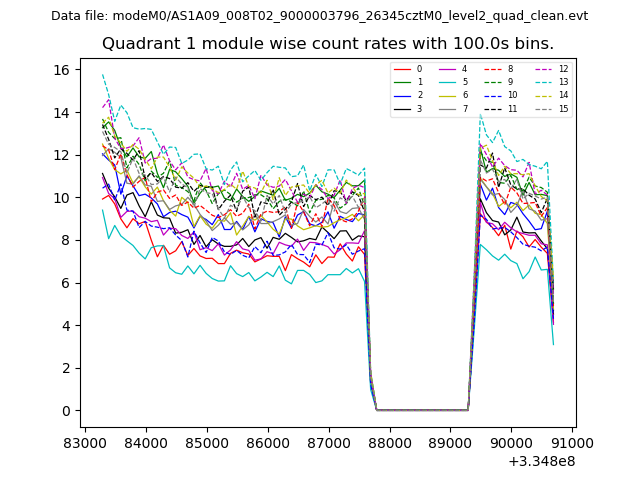
| Module-wise count rates for Quadrant A Data is divided into 100 sec bins |
 |
 |
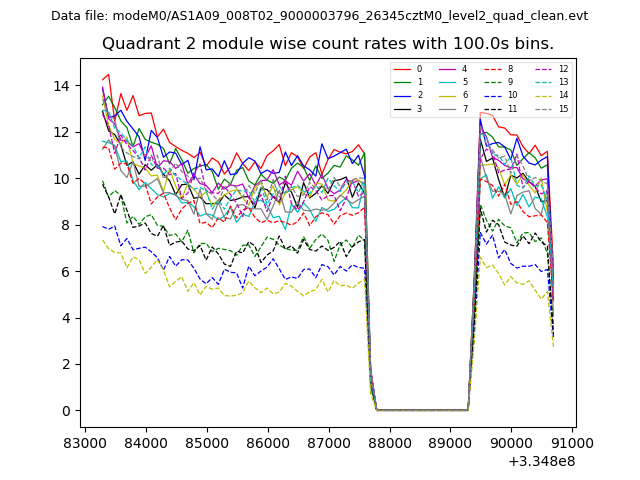
| Module-wise count rates for Quadrant B Data is divided into 100 sec bins |
 |
 |
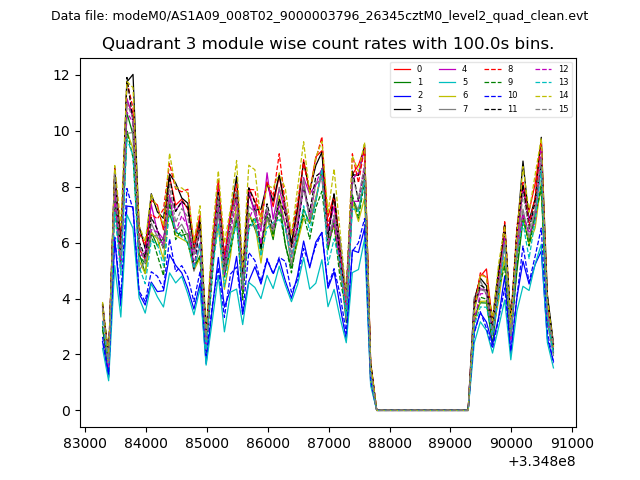
| Module-wise count rates for Quadrant C Data is divided into 100 sec bins |
 |
 |
| Module-wise count rates for Quadrant D Data is divided into 100 sec bins |
 |
 |
| Parameter | Plot |
|---|---|
| CZT HV Monitor | 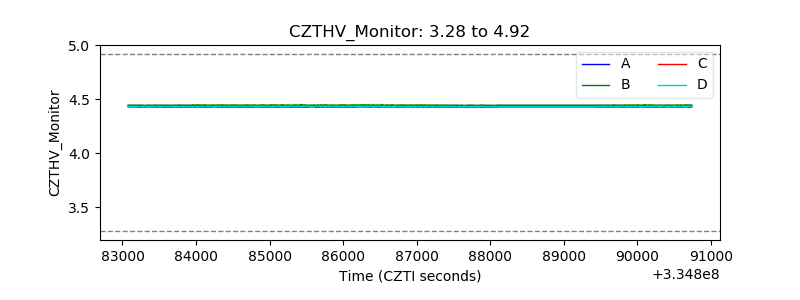 |
| D_VDD | 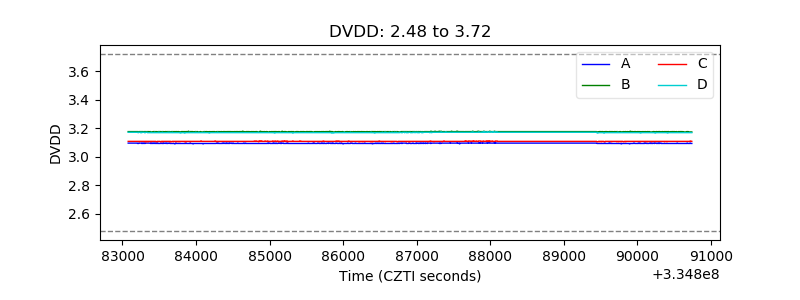 |
| Temperature 1 | 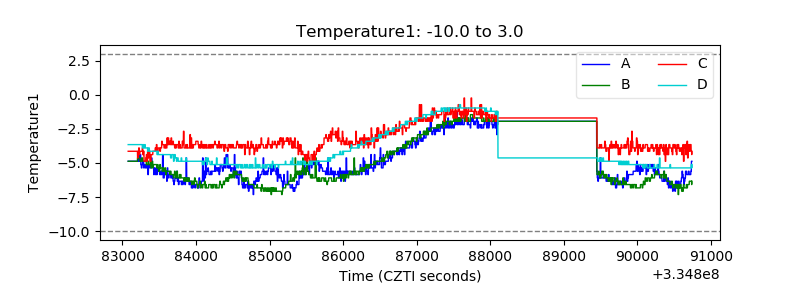 |
| Veto HV Monitor | 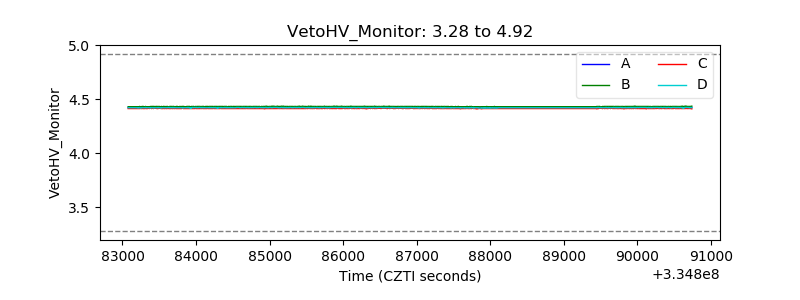 |
| Veto LLD | 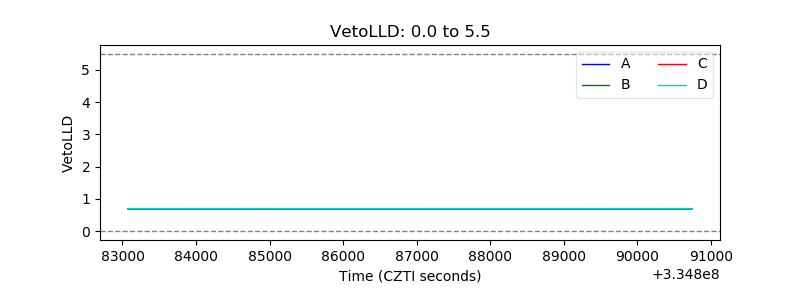 |
| Alpha Counter | 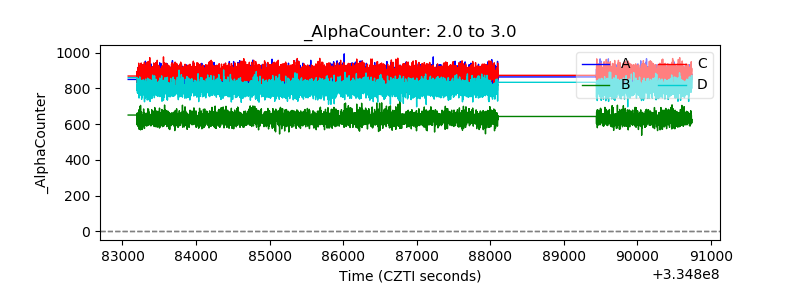 |
| _CPM_Rate | 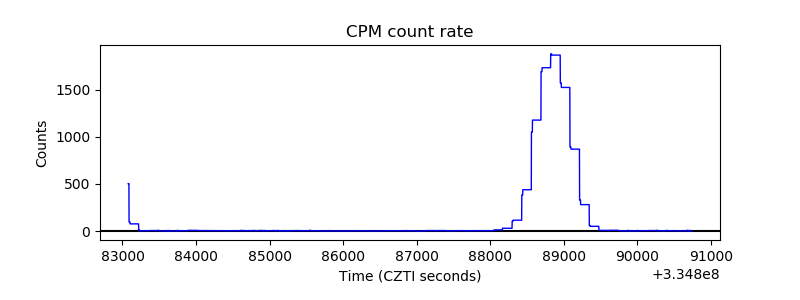 |
| CZT Counter | 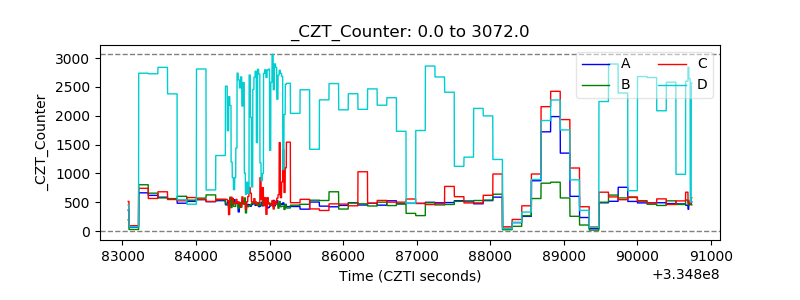 |
| +2.5 Volts monitor |  |
| +5 Volts monitor |  |
| _ROLL_ROT | 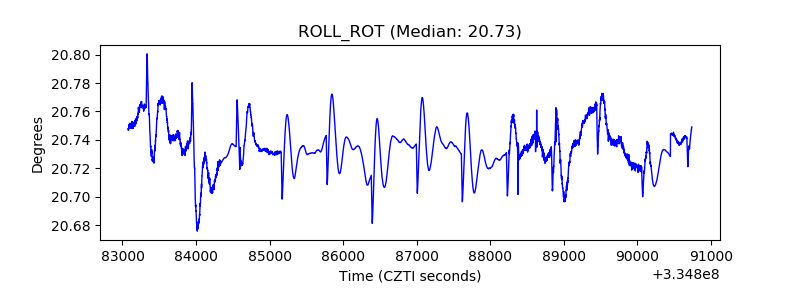 |
| _Roll_DEC | 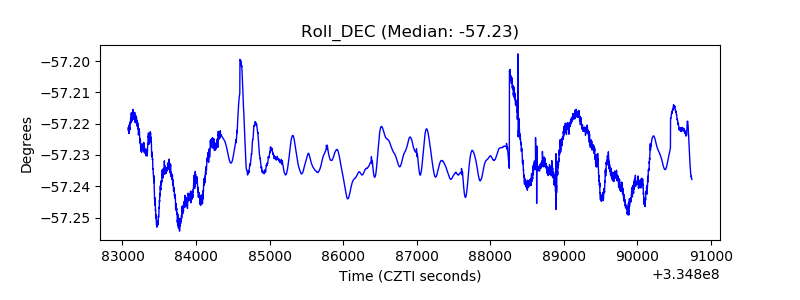 |
| _Roll_RA | 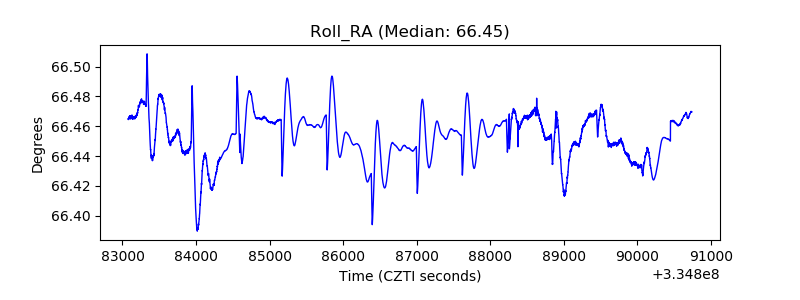 |
| Veto Counter | 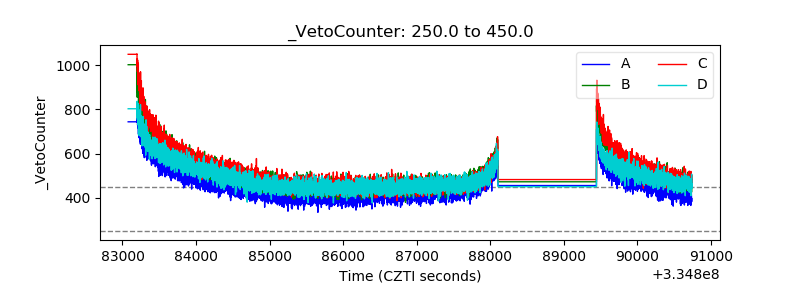 |