| Param | Original file | Final file |
|---|---|---|
| Filename | modeM0/AS1A09_008T02_9000003796_26346cztM0_level2.evt | modeM0/AS1A09_008T02_9000003796_26346cztM0_level2_quad_clean.evt |
| Size (bytes) | 430,542,720 | 75,755,520 |
| Size | 410.6 MB | 72.2 MB |
| Events in quadrant A | 1,793,323 | 541,274 |
| Events in quadrant B | 1,848,431 | 559,359 |
| Events in quadrant C | 2,402,615 | 534,594 |
| Events in quadrant D | 6,732,450 | 385,779 |
| Mode M0 | |||
|---|---|---|---|
| Quadrant | BADHDUFLAG | Total packets | Discarded packets |
| A | 0 | 7811 | 0 |
| B | 0 | 7924 | 0 |
| C | 0 | 9499 | 0 |
| D | 0 | 22601 | 0 |
| Mode M9 | |||
|---|---|---|---|
| Quadrant | BADHDUFLAG | Total packets | Discarded packets |
| A | 0 | 1 | 0 |
| B | 0 | 2 | 0 |
| C | 0 | 2 | 0 |
| D | 0 | 2 | 0 |
| Quadrant | Total seconds | Saturated seconds | Saturation percentage |
|---|---|---|---|
| A | 3853 | 1 | 0.025954% |
| B | 3853 | 6 | 0.155723% |
| C | 3853 | 115 | 2.984687% |
| D | 3853 | 1756 | 45.574877% |
Noise dominated data is calculated using 1-second bins in cleaned event files. If a bin has >2000 counts, and if more than 50% of those come from <1% of pixels, then it is considered to be noise-dominated and hence unusable.
| Quadrant | # 1 sec bins | Bins with >0 counts | Bins with >2000 counts | High rate bins dominated by noise | Noise dominated (total time) | Noise dominated (detector-on time) | Marked lightcurve |
|---|---|---|---|---|---|---|---|
| A | 3853 | 3853 | 0 | 0 | 0.00% | 0.00% |  |
| B | 3853 | 3853 | 0 | 0 | 0.00% | 0.00% | 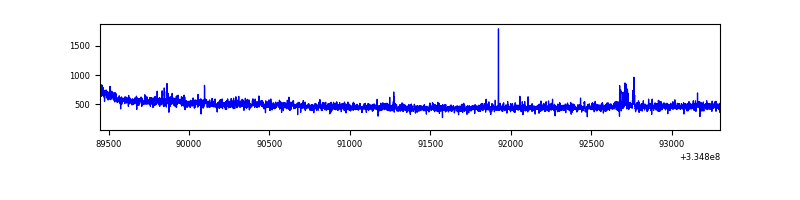 |
| C | 3853 | 3853 | 60 | 60 | 1.56% | 1.56% | 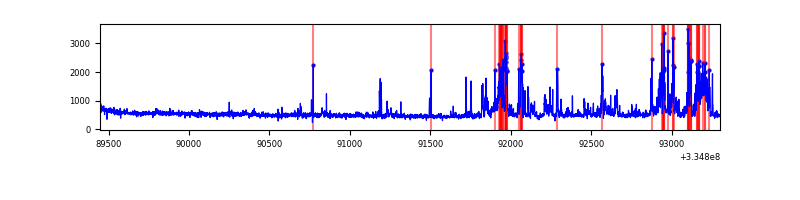 |
| D | 3853 | 3853 | 1754 | 1754 | 45.52% | 45.52% | 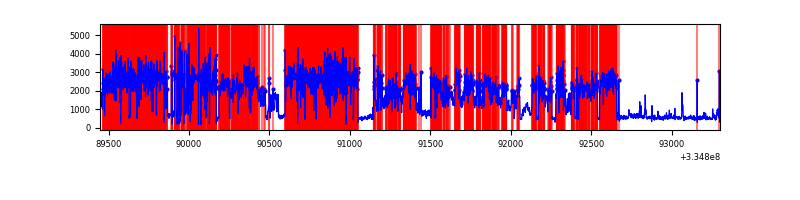 |
Top three noisy pixels from each quadrant. If the there are fewer than three noisy pixels in the level2.evt file, extra rows are filled as -1
| Pixel properties | Quadrant properties | ||||||
|---|---|---|---|---|---|---|---|
| Quadrant | DetID | PixID | Counts | Sigma | Mean | Median | Sigma |
| A | 13 | 254 | 6205 | 61.89 | 464 | 455 | 92.9 |
| A | 0 | 226 | 3972 | 37.85 | 464 | 455 | 92.9 |
| A | 3 | 137 | 3881 | 36.87 | 464 | 455 | 92.9 |
| B | 0 | 230 | 10737 | 118.13 | 467 | 455 | 87.0 |
| B | 12 | 111 | 10040 | 110.12 | 467 | 455 | 87.0 |
| B | 11 | 111 | 9119 | 99.54 | 467 | 455 | 87.0 |
| C | 3 | 233 | 523571 | 4858.03 | 459 | 464 | 107.7 |
| C | 14 | 238 | 74378 | 686.43 | 459 | 464 | 107.7 |
| C | 2 | 16 | 11267 | 100.33 | 459 | 464 | 107.7 |
| D | 1 | 52 | 5348098 | 62152.79 | 363 | 355 | 86.0 |
| D | 2 | 234 | 11869 | 133.82 | 363 | 355 | 86.0 |
| D | 11 | 176 | 4904 | 52.87 | 363 | 355 | 86.0 |
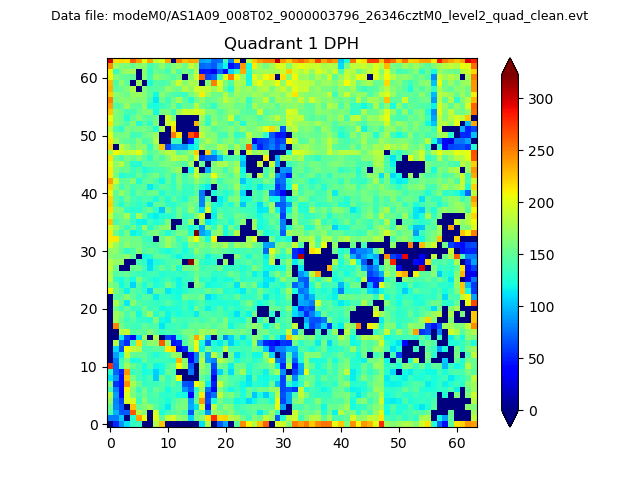
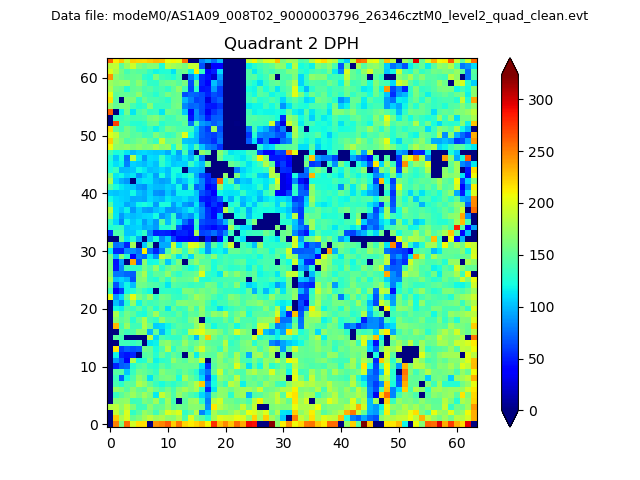
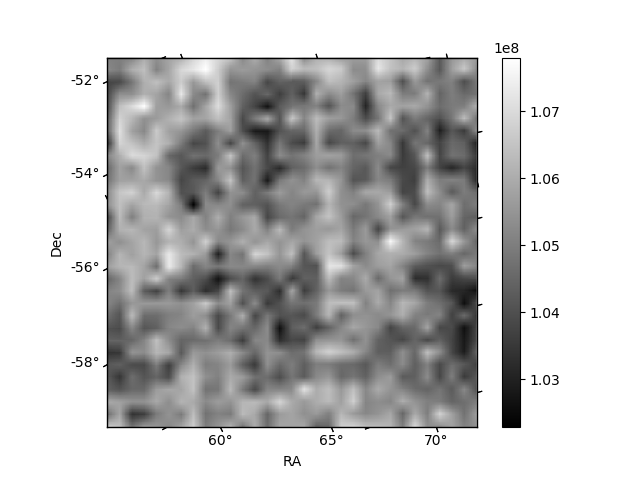
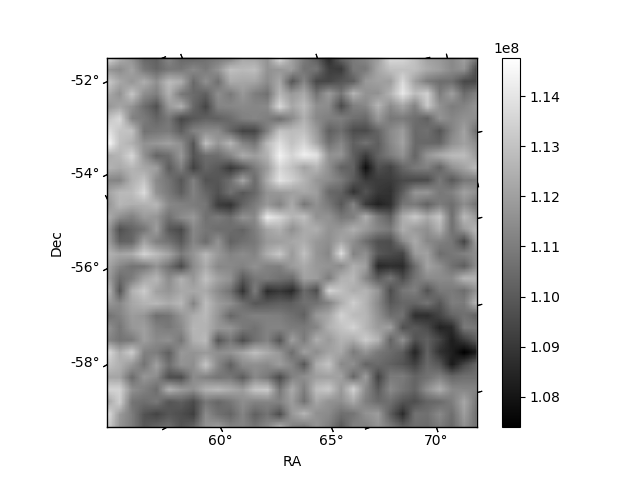
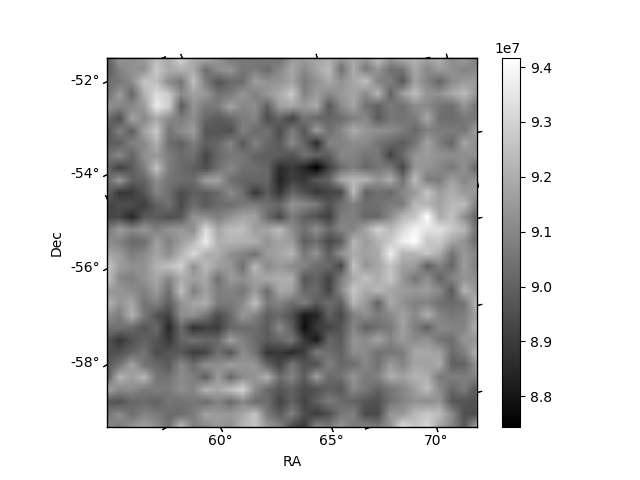
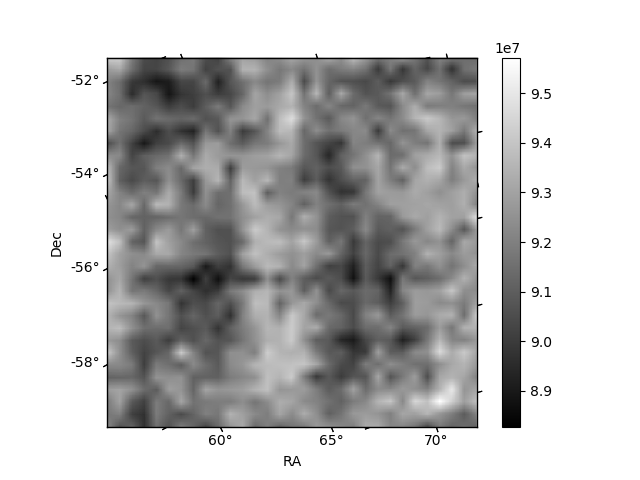
Histogram calculated using DETX and DETY for each event in the final _common_clean file
| Quadrant A |  |
 |
Quadrant B |
|---|---|---|---|
| Quadrant D | 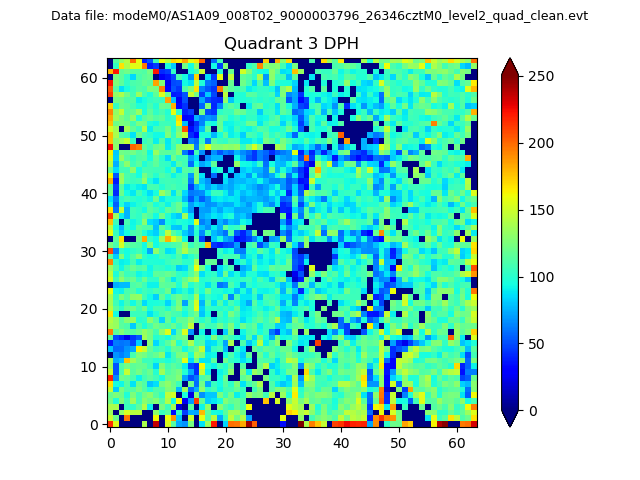 |
 |
Quadrant C |
| Plot type | Count rate plots | Images |
|---|---|---|
| Comparison with Poisson distribution Blue bars denote a histogram of data divided into 1 sec bins. Red curve is a Poisson curve with rate = median count rate of data. |
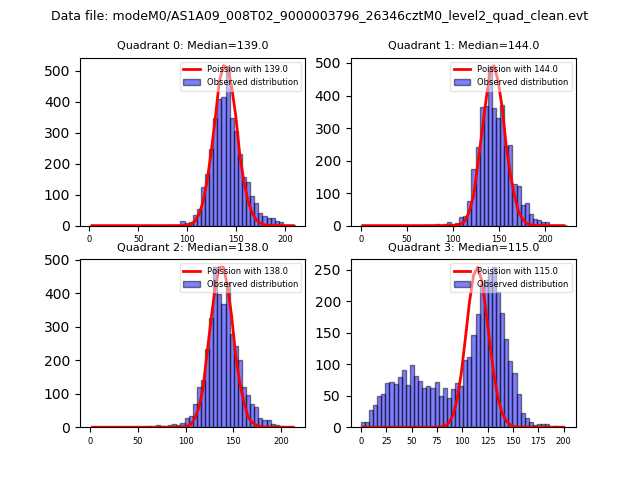 |
 |
| Quadrant-wise count rates Data is divided into 100 sec bins |
 |
|
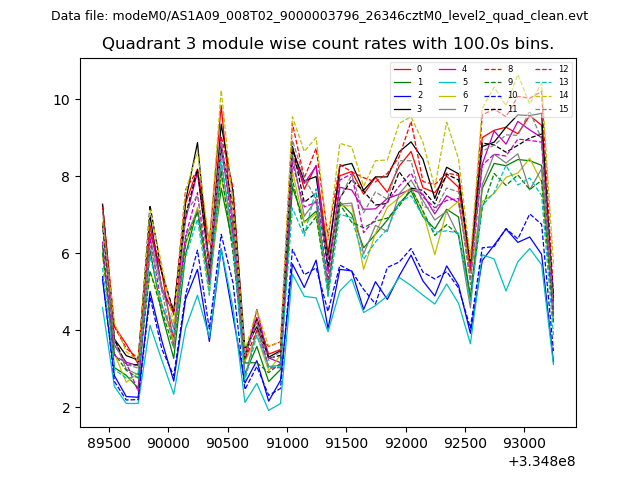
| Module-wise count rates for Quadrant A Data is divided into 100 sec bins |
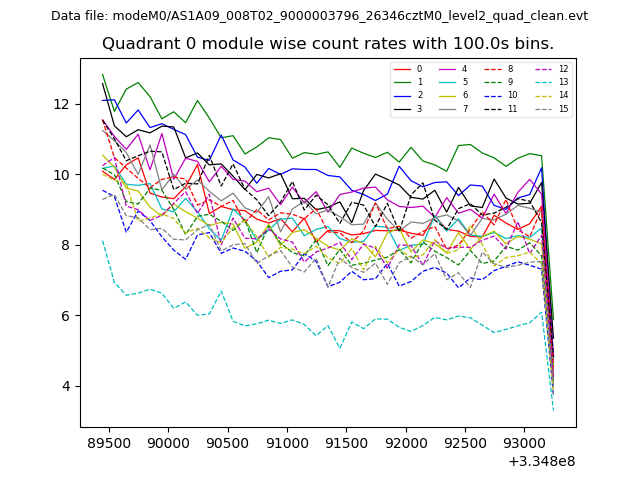 |
 |
| Module-wise count rates for Quadrant B Data is divided into 100 sec bins |
 |
 |
| Module-wise count rates for Quadrant C Data is divided into 100 sec bins |
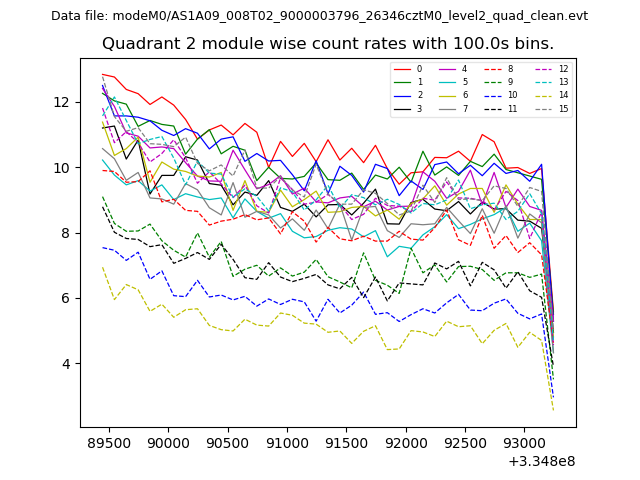 |
 |
| Module-wise count rates for Quadrant D Data is divided into 100 sec bins |
 |
 |
| Parameter | Plot |
|---|---|
| CZT HV Monitor | 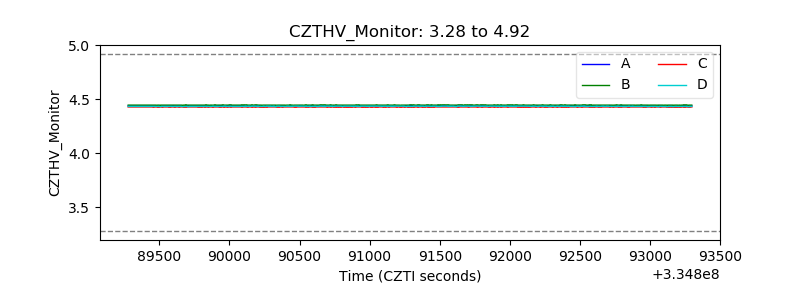 |
| D_VDD | 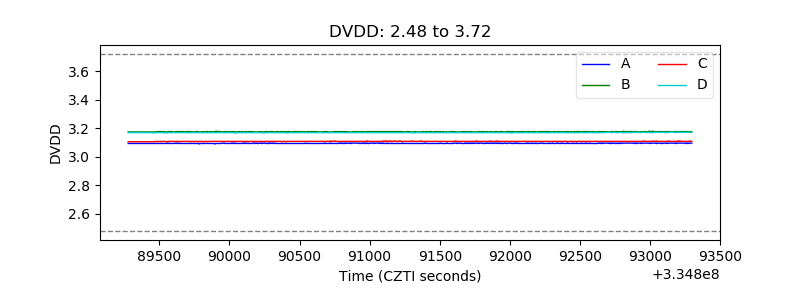 |
| Temperature 1 | 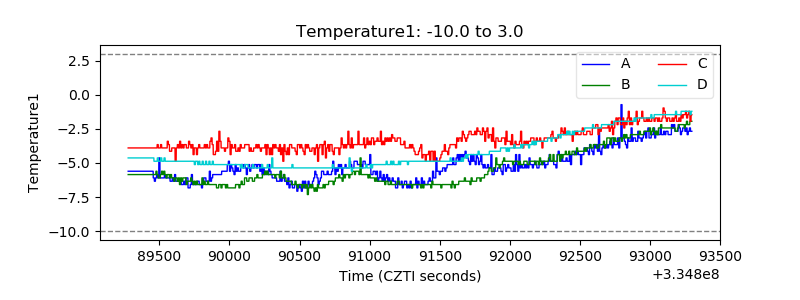 |
| Veto HV Monitor | 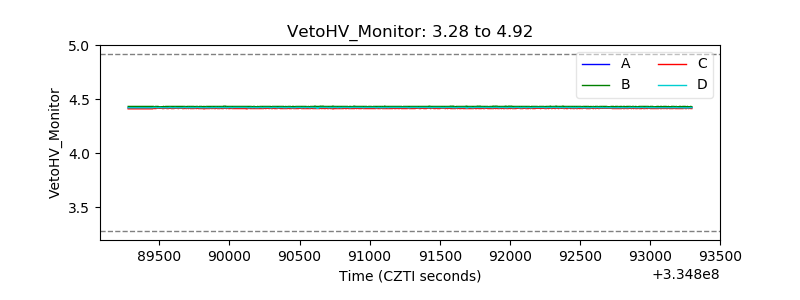 |
| Veto LLD | 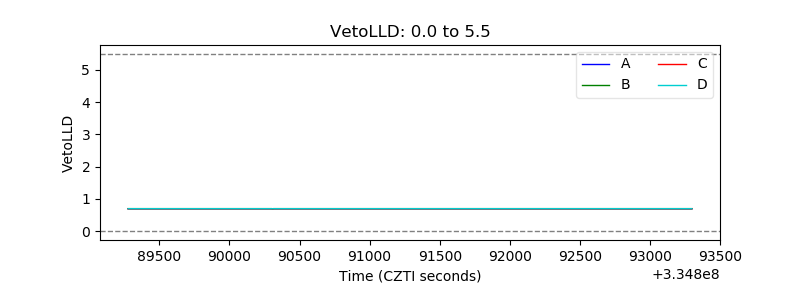 |
| Alpha Counter | 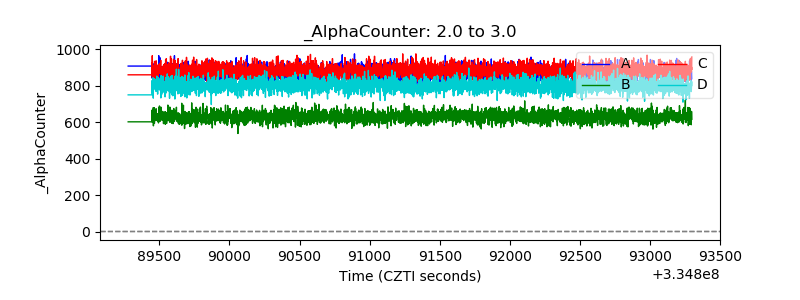 |
| _CPM_Rate | 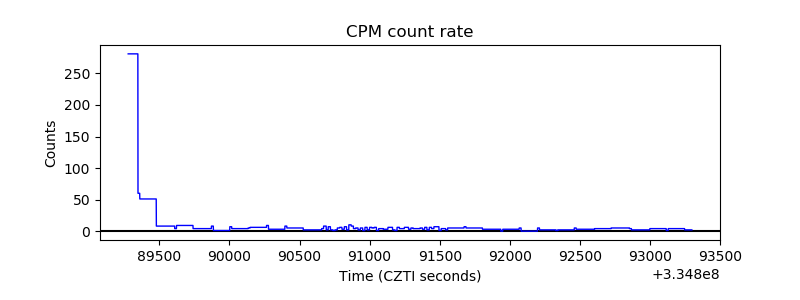 |
| CZT Counter | 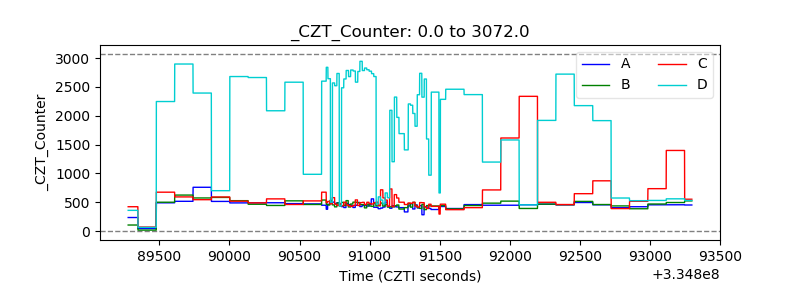 |
| +2.5 Volts monitor |  |
| +5 Volts monitor |  |
| _ROLL_ROT | 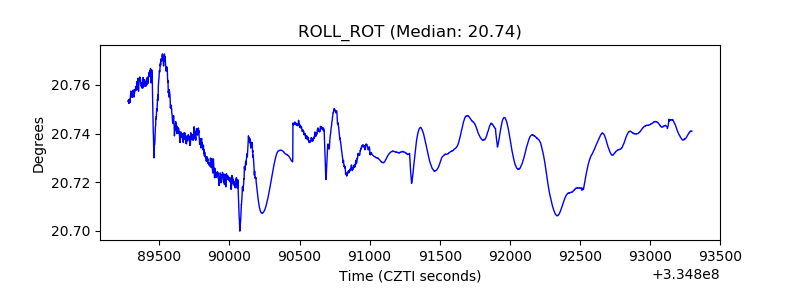 |
| _Roll_DEC | 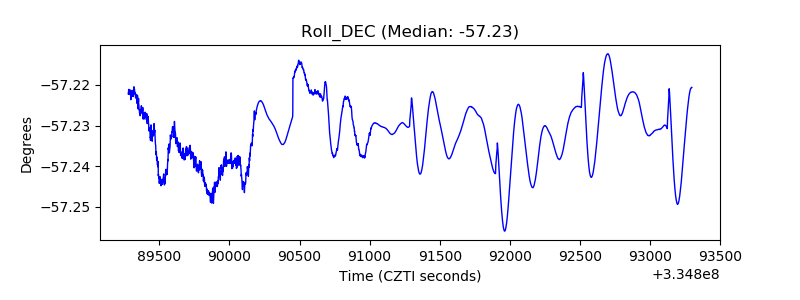 |
| _Roll_RA | 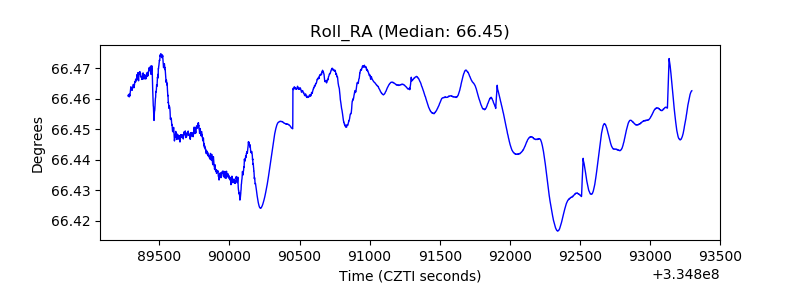 |
| Veto Counter | 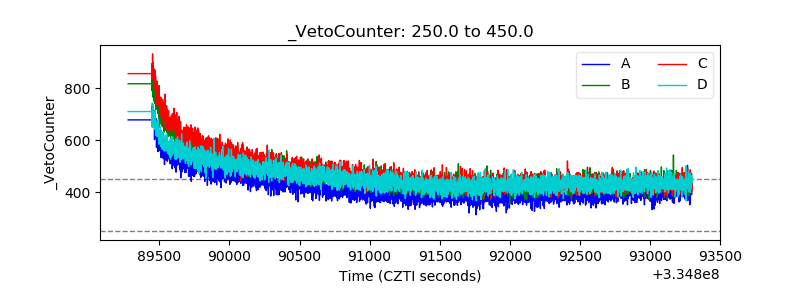 |