| Param | Original file | Final file |
|---|---|---|
| Filename | modeM0/AS1A09_038T02_9000003798cztM0_level2.fits | modeM0/AS1A09_038T02_9000003798cztM0_level2_quad_clean.evt |
| Size (bytes) | 109,635,840 | 126,426,240 |
| Size | 104.6 MB | 120.6 MB |
| Events in quadrant A | 668,602 | 791,201 |
| Events in quadrant B | 647,580 | 801,774 |
| Events in quadrant C | 645,804 | 733,790 |
| Events in quadrant D | 580,358 | 723,816 |
| Mode M0 | |||
|---|---|---|---|
| Quadrant | BADHDUFLAG | Total packets | Discarded packets |
| A | 0 | 22920 | 0 |
| B | 0 | 23080 | 0 |
| C | 0 | 29675 | 0 |
| D | 0 | 25425 | 0 |
| Mode M9 | |||
|---|---|---|---|
| Quadrant | BADHDUFLAG | Total packets | Discarded packets |
| A | 0 | 18 | 0 |
| B | 0 | 18 | 0 |
| C | 0 | 18 | 0 |
| D | 0 | 18 | 0 |
| Mode SS | |||
|---|---|---|---|
| Quadrant | BADHDUFLAG | Total packets | Discarded packets |
| A | 0 | 228 | 0 |
| B | 0 | 228 | 0 |
| C | 0 | 228 | 0 |
| D | 0 | 228 | 0 |
| Quadrant | Total seconds | Saturated seconds | Saturation percentage |
|---|---|---|---|
| A | 11244 | 67 | 0.595873% |
| B | 11244 | 115 | 1.022768% |
| C | 11244 | 779 | 6.928139% |
| D | 11244 | 161 | 1.431875% |
Noise dominated data is calculated using 1-second bins in cleaned event files. If a bin has >2000 counts, and if more than 50% of those come from <1% of pixels, then it is considered to be noise-dominated and hence unusable.
| Quadrant | # 1 sec bins | Bins with >0 counts | Bins with >2000 counts | High rate bins dominated by noise | Noise dominated (total time) | Noise dominated (detector-on time) | Marked lightcurve |
|---|---|---|---|---|---|---|---|
| A | 13044 | 11244 | 0 | 0 | 0.00% | 0.00% | 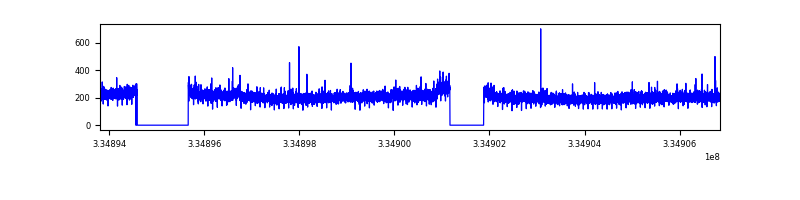 |
| B | 13044 | 11244 | 0 | 0 | 0.00% | 0.00% | 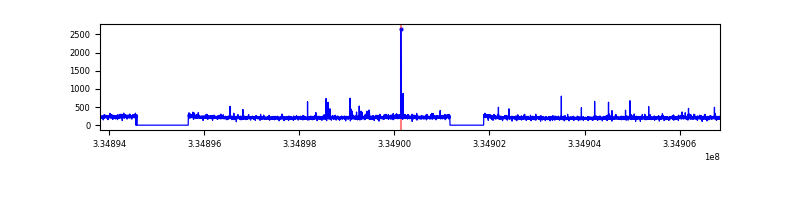 |
| C | 13044 | 11243 | 0 | 0 | 0.00% | 0.00% |  |
| D | 13044 | 11244 | 0 | 0 | 0.00% | 0.00% |  |
Top three noisy pixels from each quadrant. If the there are fewer than three noisy pixels in the level2.evt file, extra rows are filled as -1
| Pixel properties | Quadrant properties | ||||||
|---|---|---|---|---|---|---|---|
| Quadrant | DetID | PixID | Counts | Sigma | Mean | Median | Sigma |
| A | 0 | 29 | 662 | 11.2 | 174 | 164 | 44.5 |
| A | 7 | 110 | 536 | 8.37 | 174 | 164 | 44.5 |
| A | 0 | 30 | 504 | 7.65 | 174 | 164 | 44.5 |
| B | 2 | 9 | 511 | 9.89 | 171 | 164 | 35.1 |
| B | 2 | 8 | 450 | 8.15 | 171 | 164 | 35.1 |
| B | 3 | 17 | 440 | 7.86 | 171 | 164 | 35.1 |
| C | 3 | 202 | 525 | 8.0 | 170 | 160 | 45.6 |
| C | 1 | 81 | 522 | 7.93 | 170 | 160 | 45.6 |
| C | 1 | 80 | 518 | 7.84 | 170 | 160 | 45.6 |
| D | 6 | 231 | 437 | 6.21 | 165 | 150 | 46.2 |
| D | 3 | 14 | 424 | 5.93 | 165 | 150 | 46.2 |
| D | 6 | 38 | 416 | 5.76 | 165 | 150 | 46.2 |
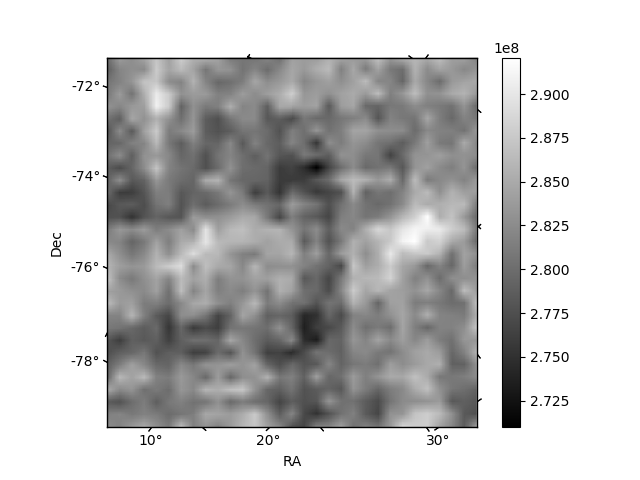
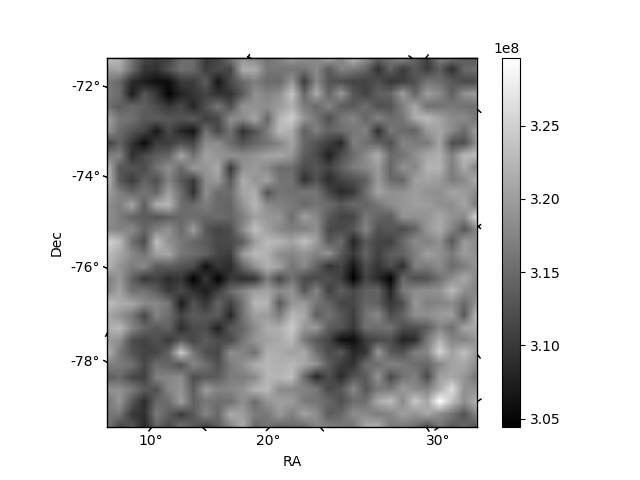
Histogram calculated using DETX and DETY for each event in the final _common_clean file
| Quadrant A | 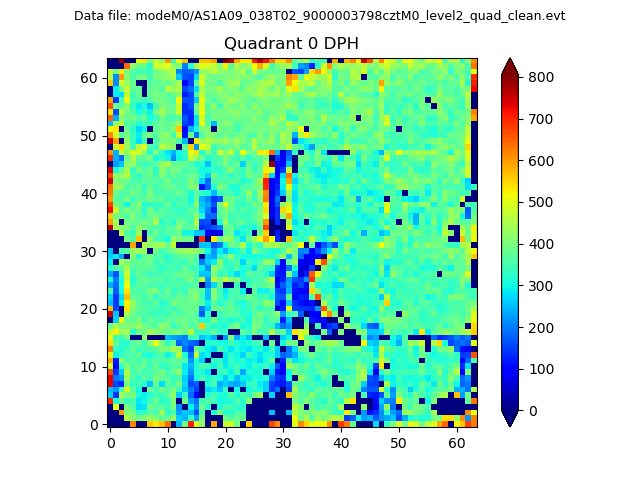 |
 |
Quadrant B |
|---|---|---|---|
| Quadrant D | 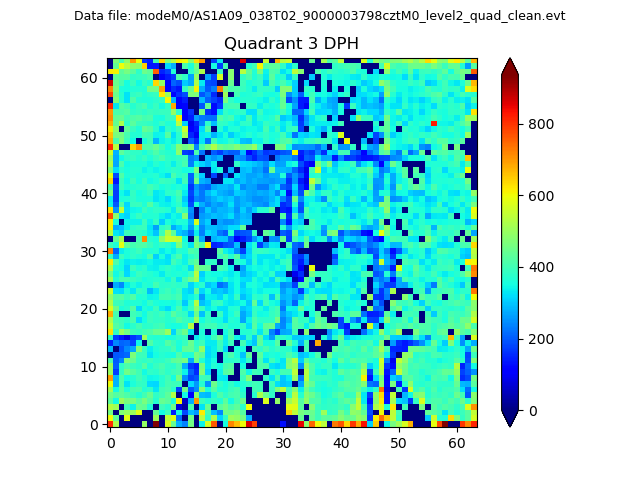 |
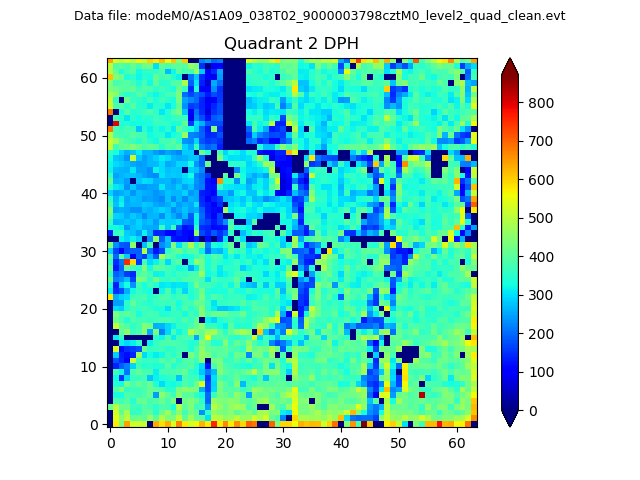 |
Quadrant C |
| Plot type | Count rate plots | Images |
|---|---|---|
| Comparison with Poisson distribution Blue bars denote a histogram of data divided into 1 sec bins. Red curve is a Poisson curve with rate = median count rate of data. |
 |
 |
| Quadrant-wise count rates Data is divided into 100 sec bins |
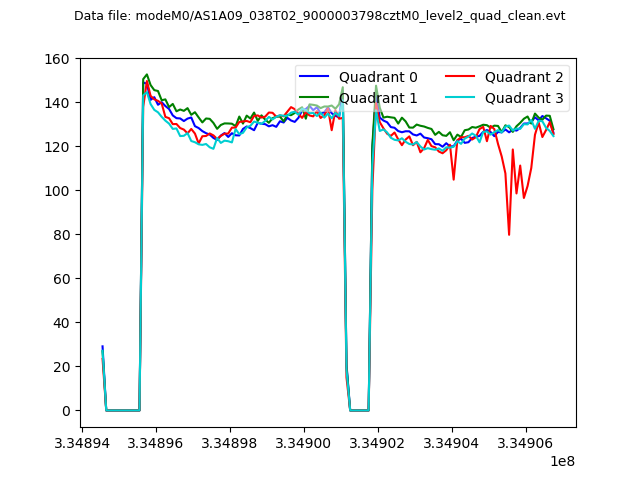 |
|
| Module-wise count rates for Quadrant A Data is divided into 100 sec bins |
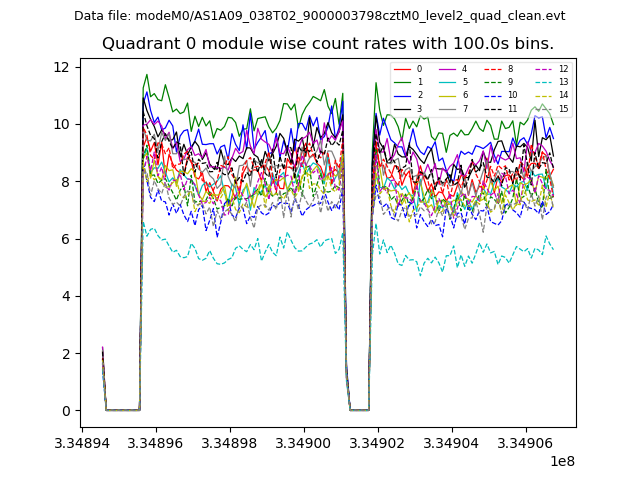 |
 |
| Module-wise count rates for Quadrant B Data is divided into 100 sec bins |
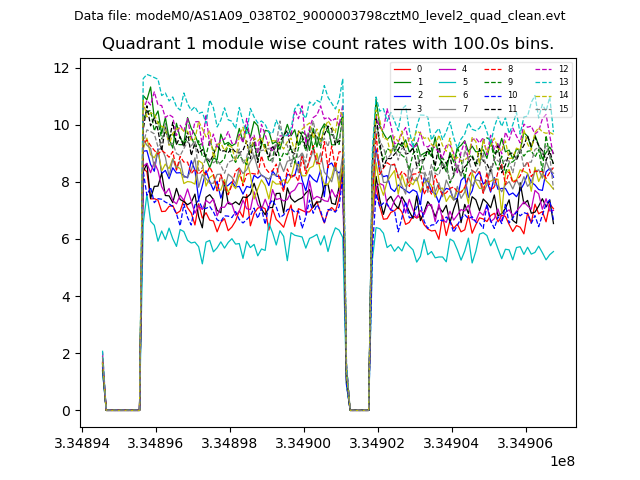 |
 |
| Module-wise count rates for Quadrant C Data is divided into 100 sec bins |
 |
 |
| Module-wise count rates for Quadrant D Data is divided into 100 sec bins |
 |
 |
| Parameter | Plot |
|---|---|
| CZT HV Monitor |  |
| D_VDD |  |
| Temperature 1 |  |
| Veto HV Monitor |  |
| Veto LLD | 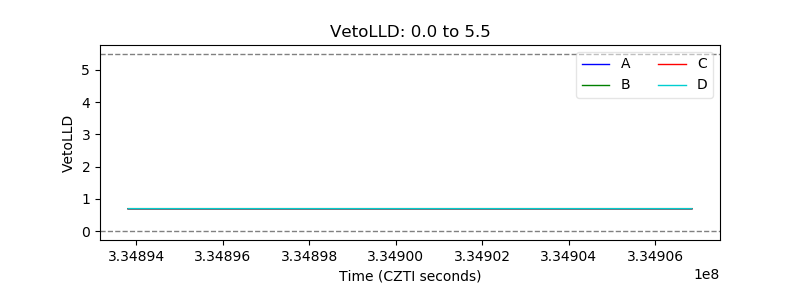 |
| Alpha Counter |  |
| _CPM_Rate |  |
| CZT Counter |  |
| +2.5 Volts monitor |  |
| +5 Volts monitor |  |
| _ROLL_ROT |  |
| _Roll_DEC |  |
| _Roll_RA |  |
| Veto Counter |  |