| Param | Original file | Final file |
|---|---|---|
| Filename | modeM0/AS1A09_038T02_9000003798_26347cztM0_level2.evt | modeM0/AS1A09_038T02_9000003798_26347cztM0_level2_quad_clean.evt |
| Size (bytes) | 463,642,560 | 135,633,600 |
| Size | 442.2 MB | 129.4 MB |
| Events in quadrant A | 3,178,722 | 907,697 |
| Events in quadrant B | 3,258,845 | 932,077 |
| Events in quadrant C | 3,704,774 | 899,049 |
| Events in quadrant D | 3,430,989 | 889,451 |
| Mode M0 | |||
|---|---|---|---|
| Quadrant | BADHDUFLAG | Total packets | Discarded packets |
| A | 0 | 14021 | 0 |
| B | 0 | 14080 | 0 |
| C | 0 | 15218 | 0 |
| D | 0 | 14818 | 0 |
| Mode M9 | |||
|---|---|---|---|
| Quadrant | BADHDUFLAG | Total packets | Discarded packets |
| A | 0 | 8 | 0 |
| B | 0 | 8 | 0 |
| C | 0 | 8 | 0 |
| D | 0 | 8 | 0 |
| Quadrant | Total seconds | Saturated seconds | Saturation percentage |
|---|---|---|---|
| A | 6895 | 42 | 0.609137% |
| B | 6895 | 69 | 1.000725% |
| C | 6895 | 171 | 2.480058% |
| D | 6895 | 59 | 0.855693% |
Noise dominated data is calculated using 1-second bins in cleaned event files. If a bin has >2000 counts, and if more than 50% of those come from <1% of pixels, then it is considered to be noise-dominated and hence unusable.
| Quadrant | # 1 sec bins | Bins with >0 counts | Bins with >2000 counts | High rate bins dominated by noise | Noise dominated (total time) | Noise dominated (detector-on time) | Marked lightcurve |
|---|---|---|---|---|---|---|---|
| A | 7605 | 6896 | 0 | 0 | 0.00% | 0.00% | 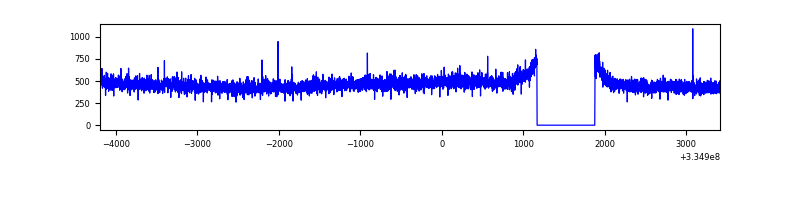 |
| B | 7605 | 6896 | 3 | 3 | 0.04% | 0.04% | 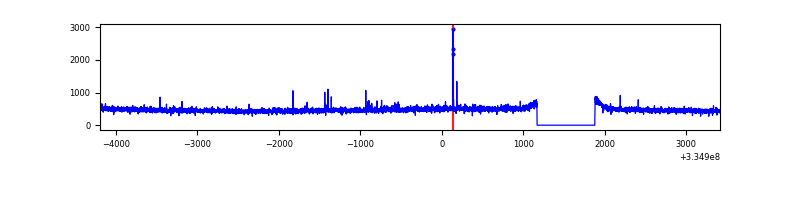 |
| C | 7605 | 6896 | 22 | 22 | 0.29% | 0.32% | 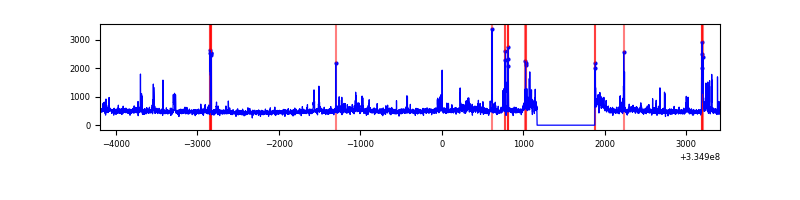 |
| D | 7605 | 6896 | 9 | 9 | 0.12% | 0.13% | 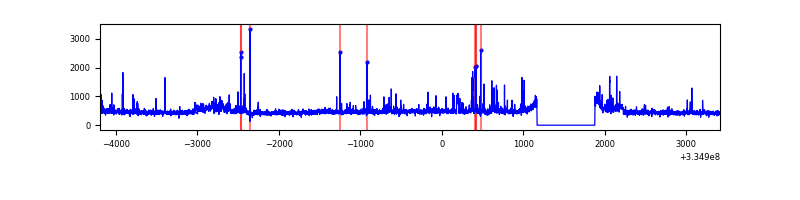 |
Top three noisy pixels from each quadrant. If the there are fewer than three noisy pixels in the level2.evt file, extra rows are filled as -1
| Pixel properties | Quadrant properties | ||||||
|---|---|---|---|---|---|---|---|
| Quadrant | DetID | PixID | Counts | Sigma | Mean | Median | Sigma |
| A | 6 | 16 | 24572 | 145.7 | 817 | 798 | 163.2 |
| A | 13 | 254 | 10644 | 60.34 | 817 | 798 | 163.2 |
| A | 3 | 137 | 7464 | 40.85 | 817 | 798 | 163.2 |
| B | 12 | 111 | 18746 | 115.93 | 822 | 799 | 154.8 |
| B | 0 | 230 | 17941 | 110.73 | 822 | 799 | 154.8 |
| B | 11 | 111 | 16697 | 102.7 | 822 | 799 | 154.8 |
| C | 3 | 233 | 434604 | 2317.58 | 800 | 804 | 187.2 |
| C | 14 | 238 | 130691 | 693.92 | 800 | 804 | 187.2 |
| C | 2 | 16 | 18582 | 94.98 | 800 | 804 | 187.2 |
| D | 1 | 52 | 354751 | 1864.23 | 803 | 784 | 189.9 |
| D | 2 | 234 | 26387 | 134.84 | 803 | 784 | 189.9 |
| D | 11 | 176 | 14181 | 70.56 | 803 | 784 | 189.9 |
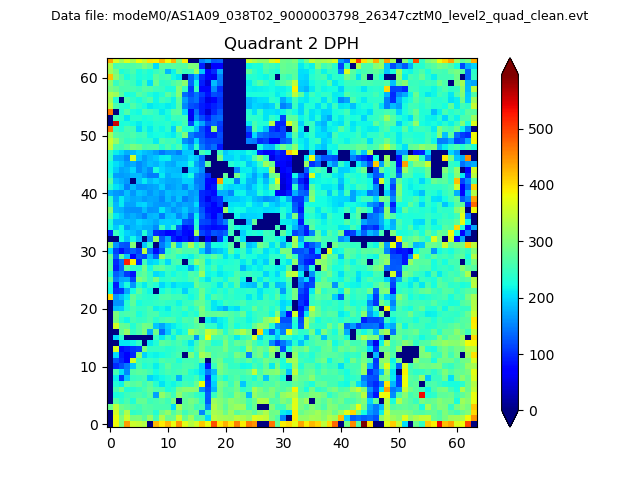
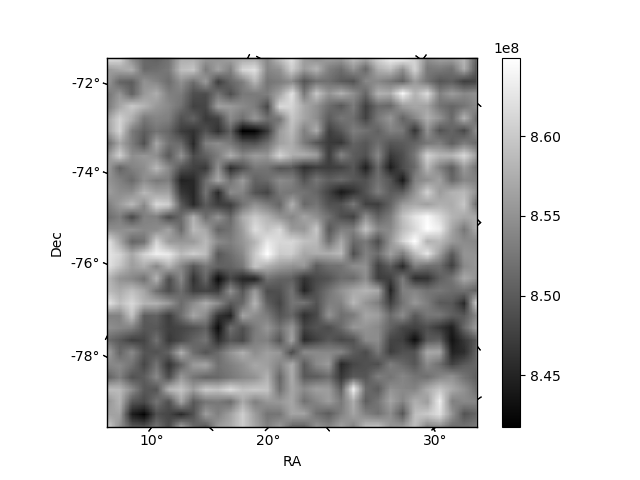
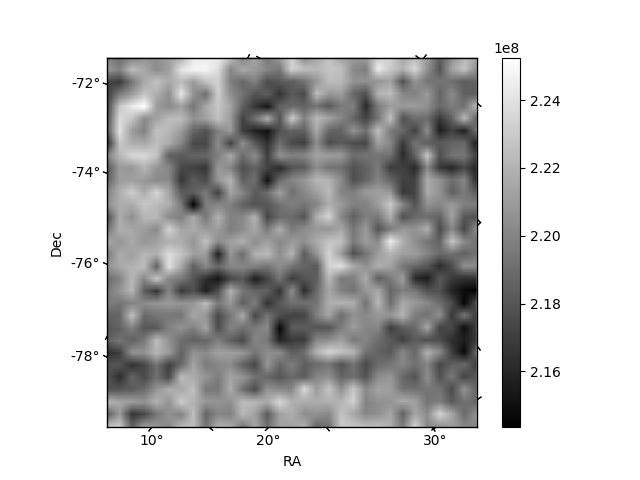
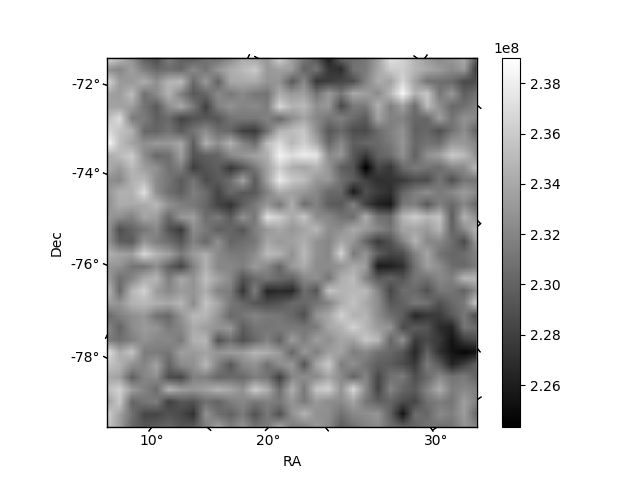
Histogram calculated using DETX and DETY for each event in the final _common_clean file
| Quadrant A | 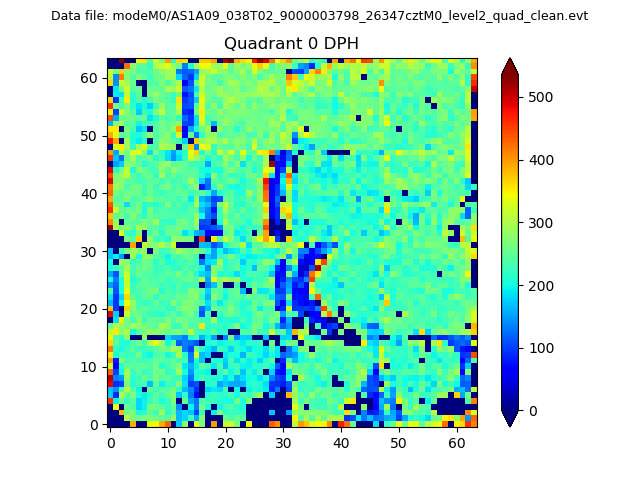 |
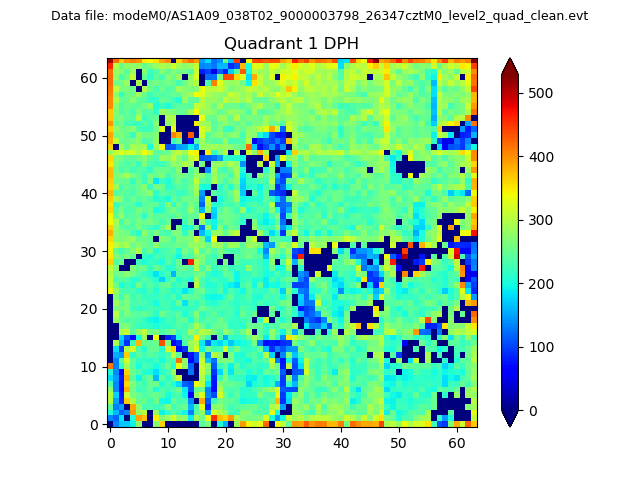 |
Quadrant B |
|---|---|---|---|
| Quadrant D | 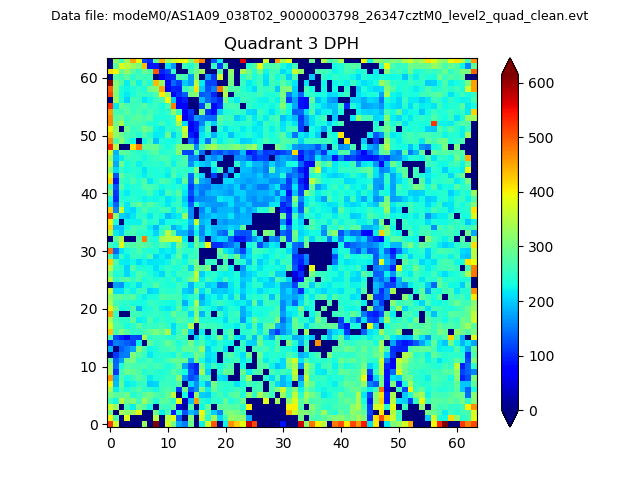 |
 |
Quadrant C |
| Plot type | Count rate plots | Images |
|---|---|---|
| Comparison with Poisson distribution Blue bars denote a histogram of data divided into 1 sec bins. Red curve is a Poisson curve with rate = median count rate of data. |
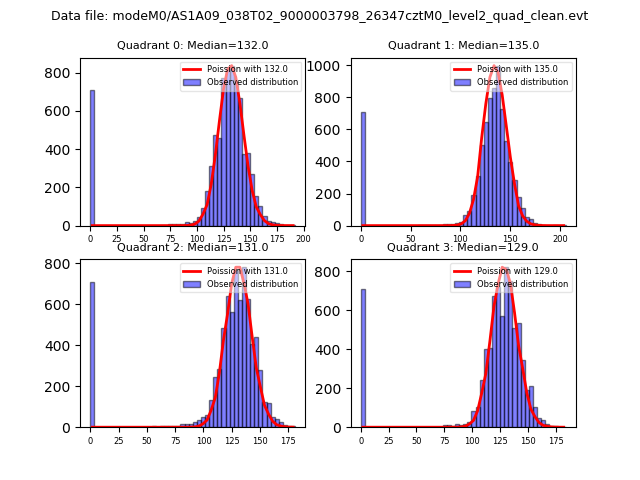 |
 |
| Quadrant-wise count rates Data is divided into 100 sec bins |
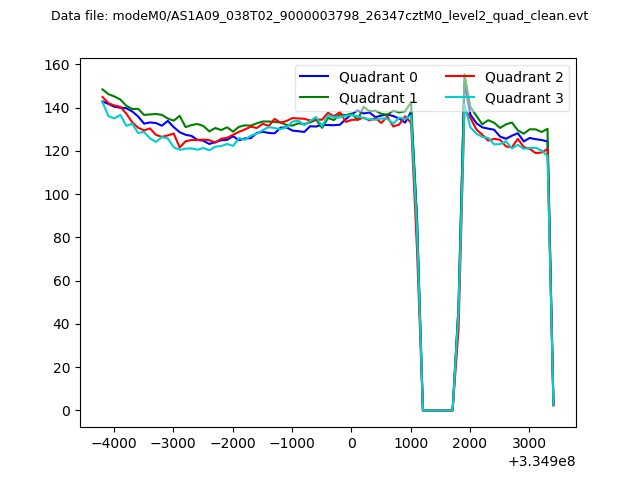 |
|
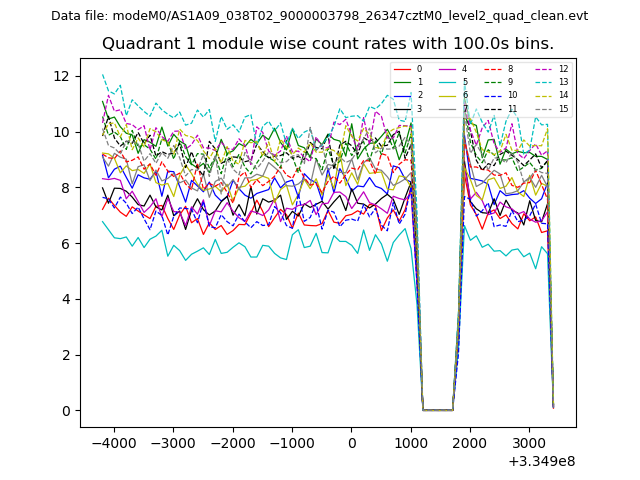
| Module-wise count rates for Quadrant A Data is divided into 100 sec bins |
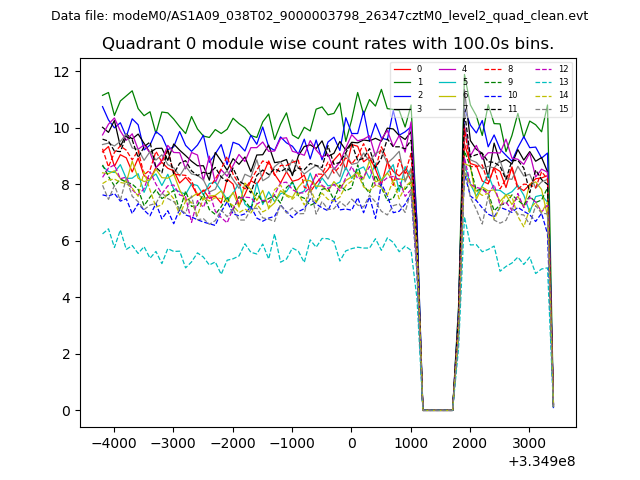 |
 |
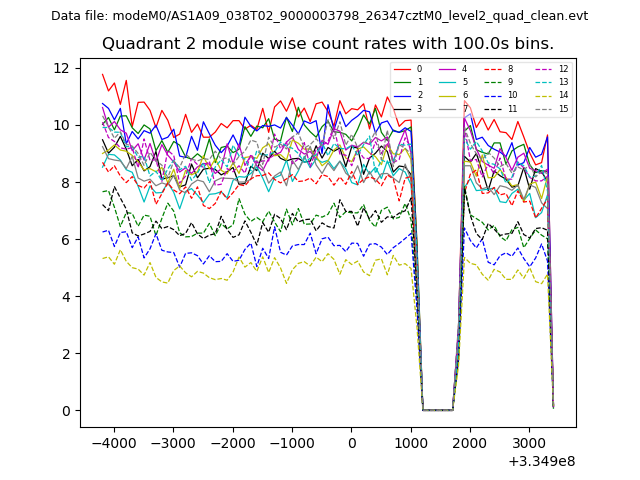
| Module-wise count rates for Quadrant B Data is divided into 100 sec bins |
 |
 |
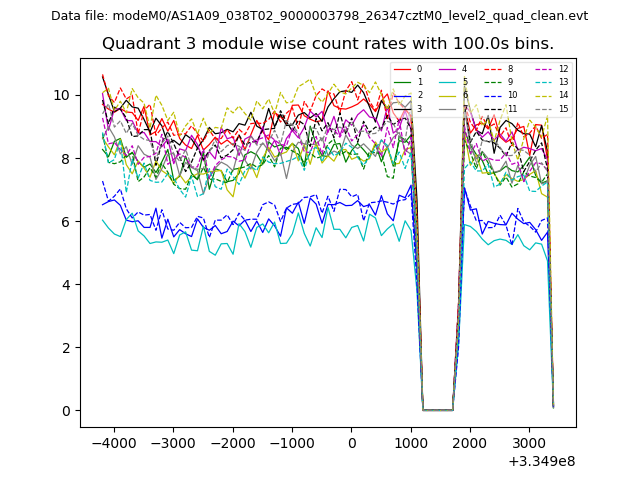
| Module-wise count rates for Quadrant C Data is divided into 100 sec bins |
 |
 |
| Module-wise count rates for Quadrant D Data is divided into 100 sec bins |
 |
 |
| Parameter | Plot |
|---|---|
| CZT HV Monitor | 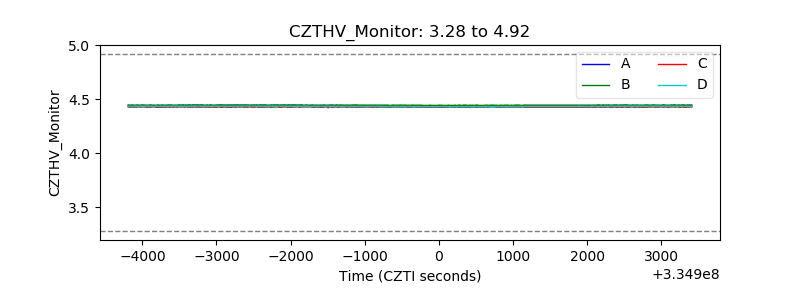 |
| D_VDD | 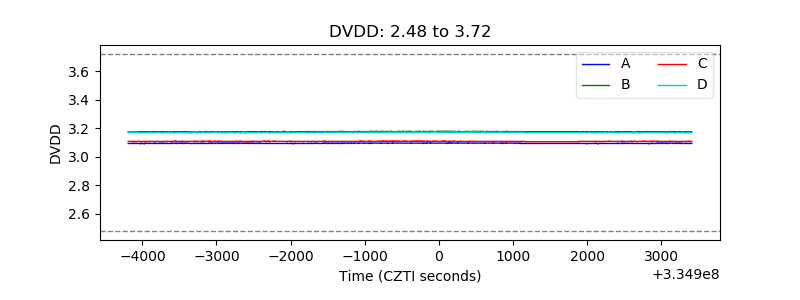 |
| Temperature 1 | 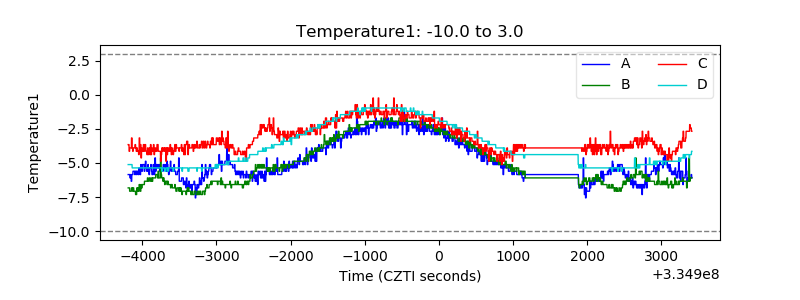 |
| Veto HV Monitor | 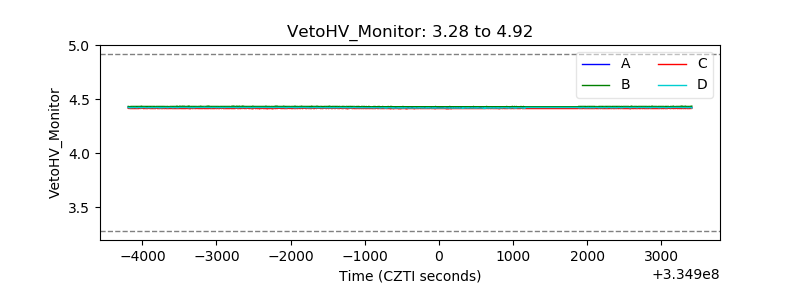 |
| Veto LLD | 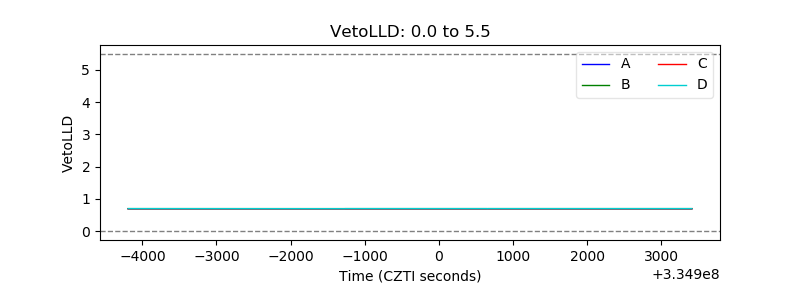 |
| Alpha Counter | 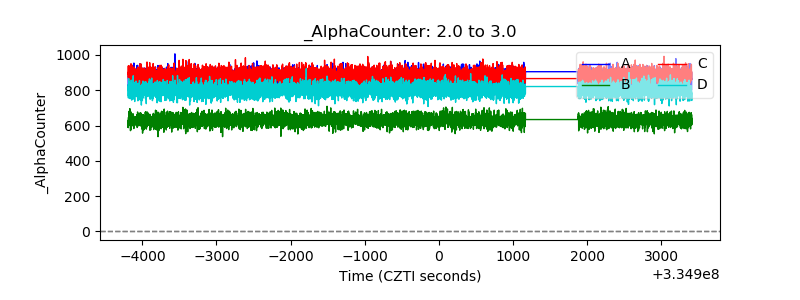 |
| _CPM_Rate | 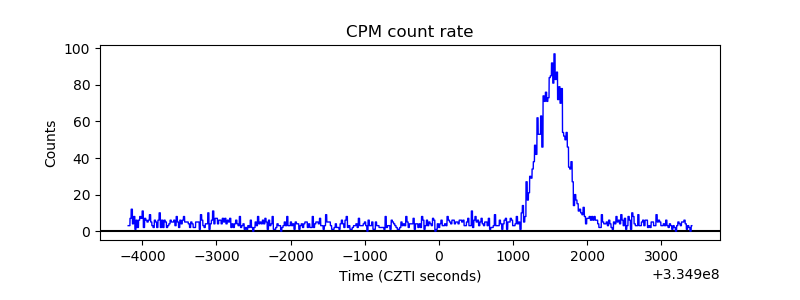 |
| CZT Counter | 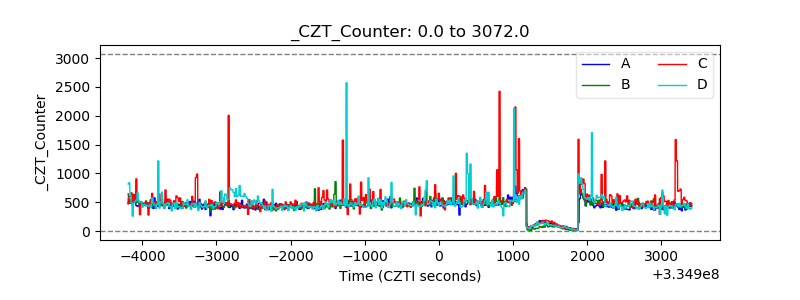 |
| +2.5 Volts monitor |  |
| +5 Volts monitor |  |
| _ROLL_ROT | 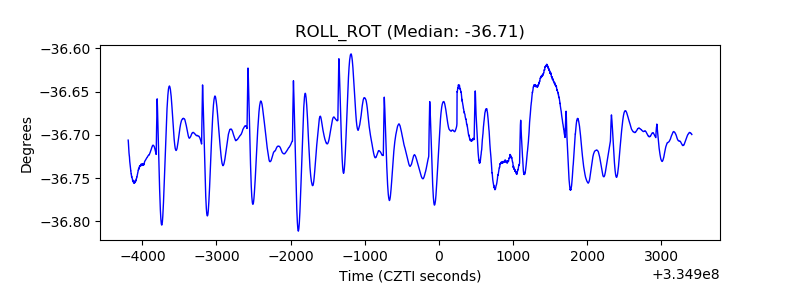 |
| _Roll_DEC | 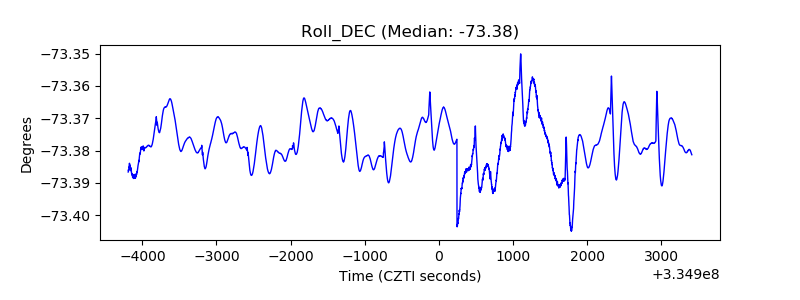 |
| _Roll_RA | 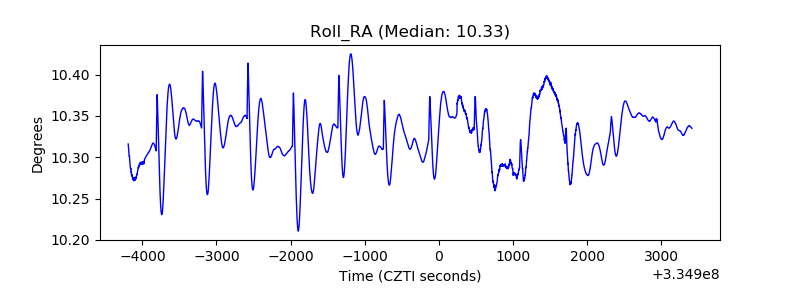 |
| Veto Counter | 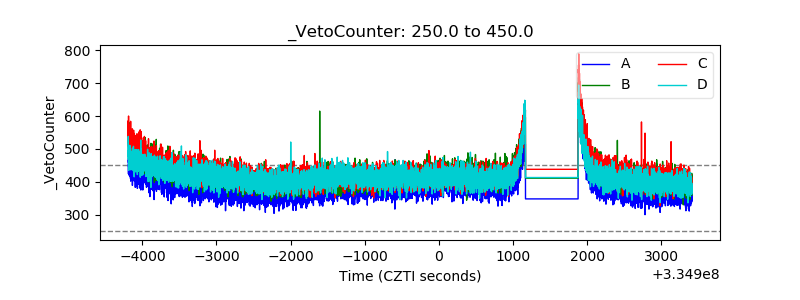 |