| Param | Original file | Final file |
|---|---|---|
| Filename | modeM0/AS1A09_038T02_9000003798_26348cztM0_level2.evt | modeM0/AS1A09_038T02_9000003798_26348cztM0_level2_quad_clean.evt |
| Size (bytes) | 386,150,400 | 94,253,760 |
| Size | 368.3 MB | 89.9 MB |
| Events in quadrant A | 2,232,591 | 634,177 |
| Events in quadrant B | 2,283,514 | 649,342 |
| Events in quadrant C | 4,231,996 | 599,264 |
| Events in quadrant D | 2,608,296 | 623,042 |
| Mode M0 | |||
|---|---|---|---|
| Quadrant | BADHDUFLAG | Total packets | Discarded packets |
| A | 0 | 10034 | 0 |
| B | 0 | 10078 | 0 |
| C | 0 | 15818 | 0 |
| D | 0 | 11018 | 0 |
| Mode M9 | |||
|---|---|---|---|
| Quadrant | BADHDUFLAG | Total packets | Discarded packets |
| A | 0 | 1 | 0 |
| B | 0 | 2 | 0 |
| C | 0 | 2 | 0 |
| D | 0 | 2 | 0 |
| Quadrant | Total seconds | Saturated seconds | Saturation percentage |
|---|---|---|---|
| A | 4973 | 25 | 0.502715% |
| B | 4973 | 36 | 0.723909% |
| C | 4973 | 607 | 12.205912% |
| D | 4973 | 42 | 0.844561% |
Noise dominated data is calculated using 1-second bins in cleaned event files. If a bin has >2000 counts, and if more than 50% of those come from <1% of pixels, then it is considered to be noise-dominated and hence unusable.
| Quadrant | # 1 sec bins | Bins with >0 counts | Bins with >2000 counts | High rate bins dominated by noise | Noise dominated (total time) | Noise dominated (detector-on time) | Marked lightcurve |
|---|---|---|---|---|---|---|---|
| A | 4973 | 4973 | 0 | 0 | 0.00% | 0.00% | 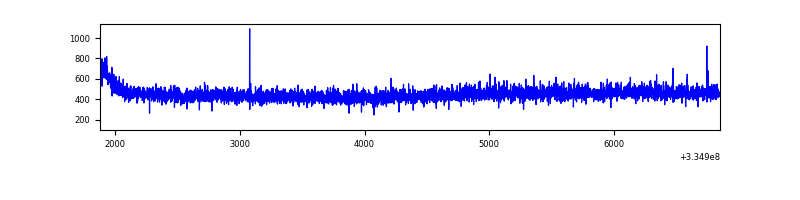 |
| B | 4973 | 4973 | 0 | 0 | 0.00% | 0.00% | 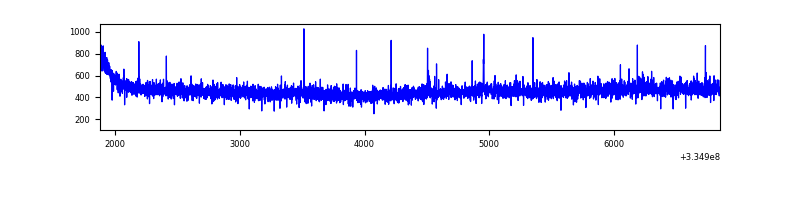 |
| C | 4973 | 4973 | 361 | 361 | 7.26% | 7.26% | 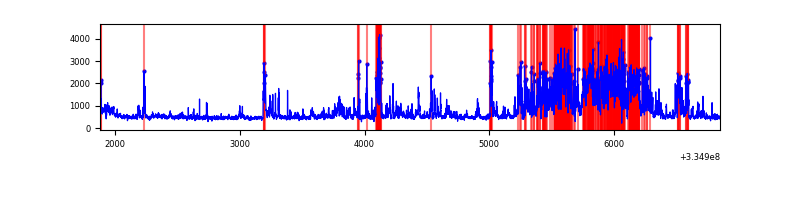 |
| D | 4973 | 4973 | 11 | 11 | 0.22% | 0.22% | 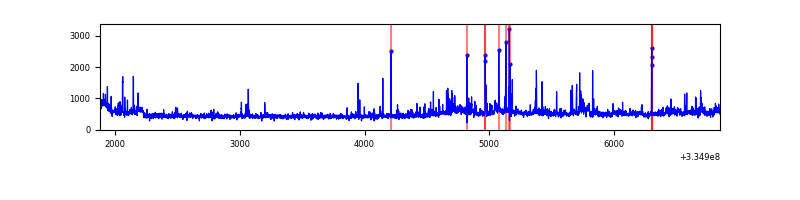 |
Top three noisy pixels from each quadrant. If the there are fewer than three noisy pixels in the level2.evt file, extra rows are filled as -1
| Pixel properties | Quadrant properties | ||||||
|---|---|---|---|---|---|---|---|
| Quadrant | DetID | PixID | Counts | Sigma | Mean | Median | Sigma |
| A | 13 | 254 | 7323 | 57.64 | 578 | 564 | 117.3 |
| A | 3 | 137 | 5482 | 41.94 | 578 | 564 | 117.3 |
| A | 0 | 226 | 4909 | 37.05 | 578 | 564 | 117.3 |
| B | 12 | 111 | 13241 | 114.37 | 579 | 562 | 110.9 |
| B | 11 | 111 | 12178 | 104.78 | 579 | 562 | 110.9 |
| B | 14 | 111 | 10693 | 91.38 | 579 | 562 | 110.9 |
| C | 3 | 233 | 1954493 | 15541.01 | 542 | 544 | 125.7 |
| C | 14 | 238 | 87321 | 690.19 | 542 | 544 | 125.7 |
| C | 0 | 239 | 57829 | 455.62 | 542 | 544 | 125.7 |
| D | 1 | 52 | 395987 | 2923.14 | 567 | 553 | 135.3 |
| D | 11 | 176 | 21647 | 155.93 | 567 | 553 | 135.3 |
| D | 2 | 234 | 20850 | 150.04 | 567 | 553 | 135.3 |
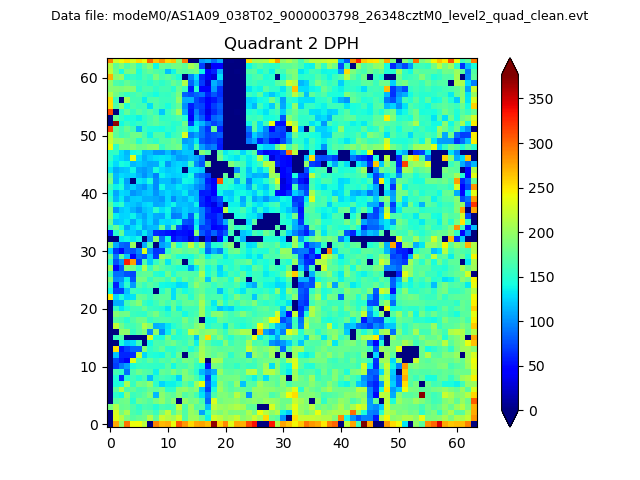
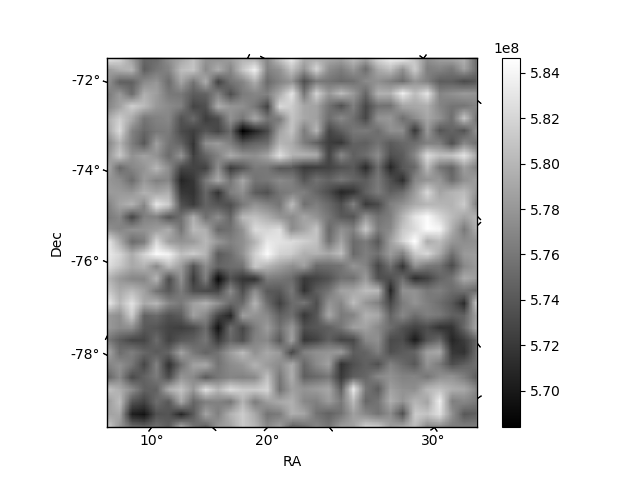
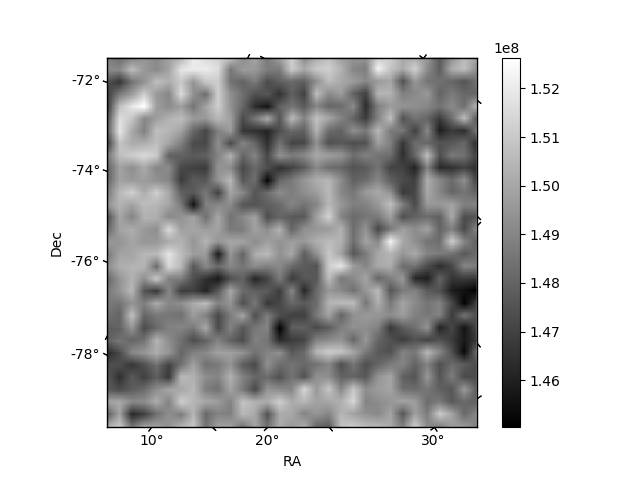
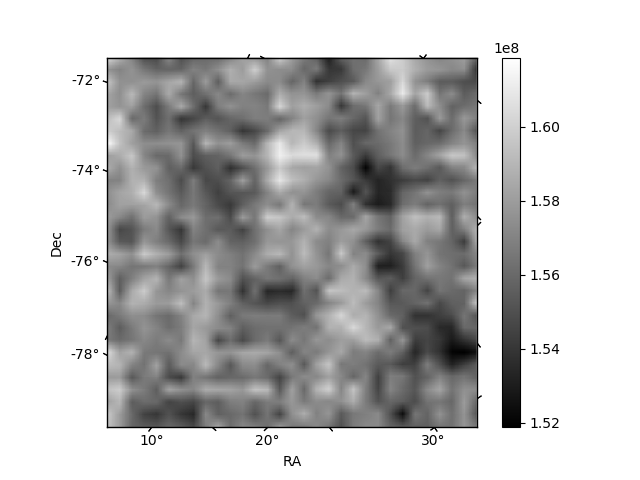
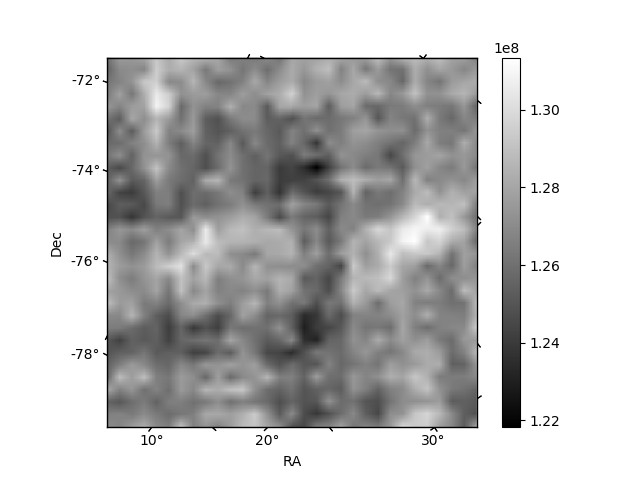
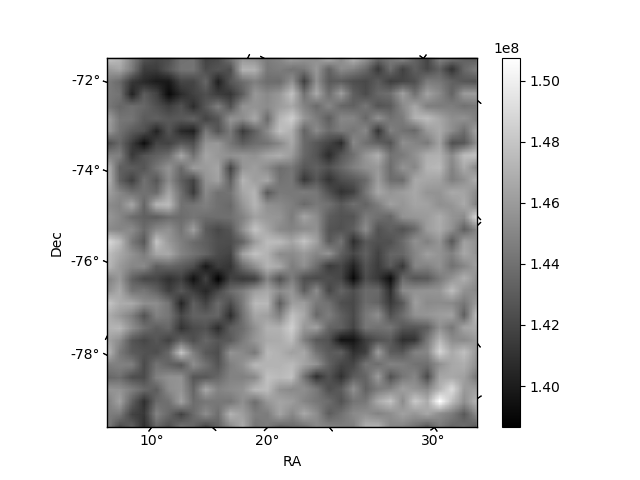
Histogram calculated using DETX and DETY for each event in the final _common_clean file
| Quadrant A | 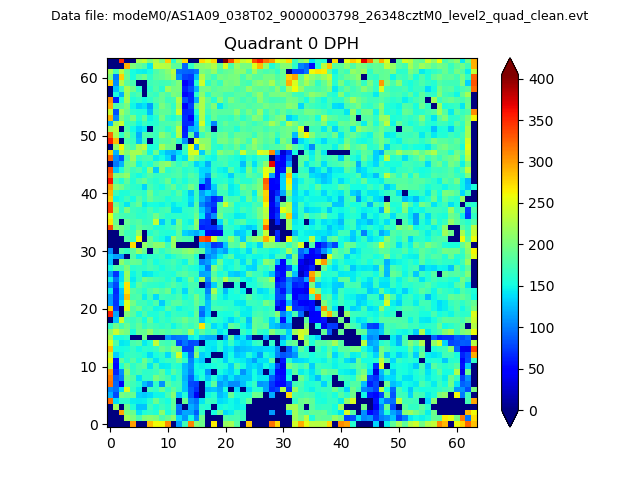 |
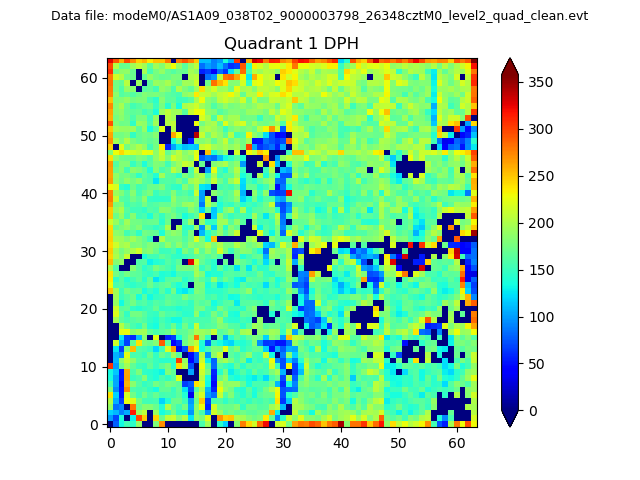 |
Quadrant B |
|---|---|---|---|
| Quadrant D | 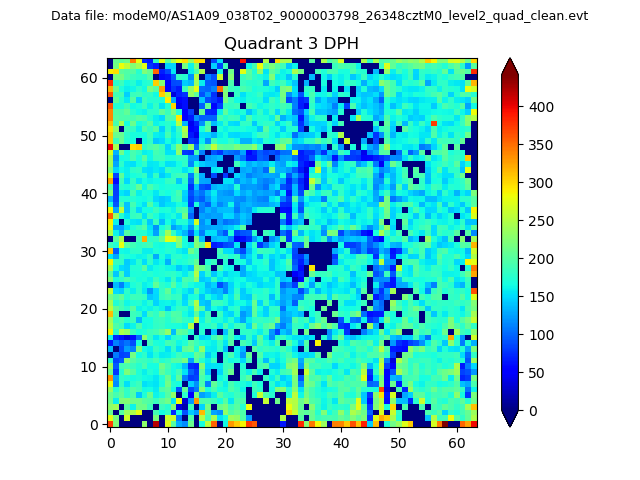 |
 |
Quadrant C |
| Plot type | Count rate plots | Images |
|---|---|---|
| Comparison with Poisson distribution Blue bars denote a histogram of data divided into 1 sec bins. Red curve is a Poisson curve with rate = median count rate of data. |
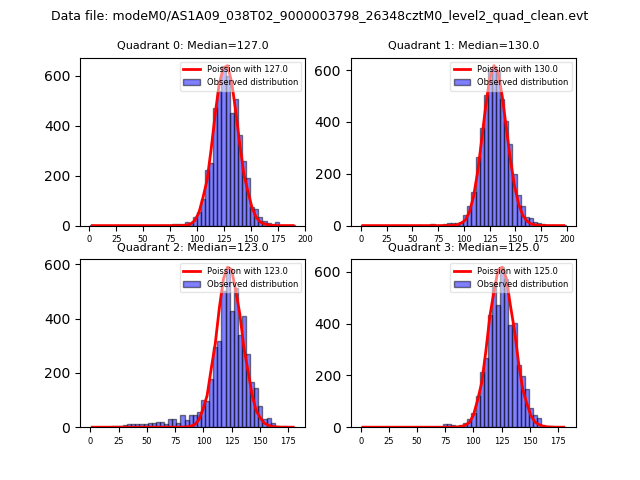 |
 |
| Quadrant-wise count rates Data is divided into 100 sec bins |
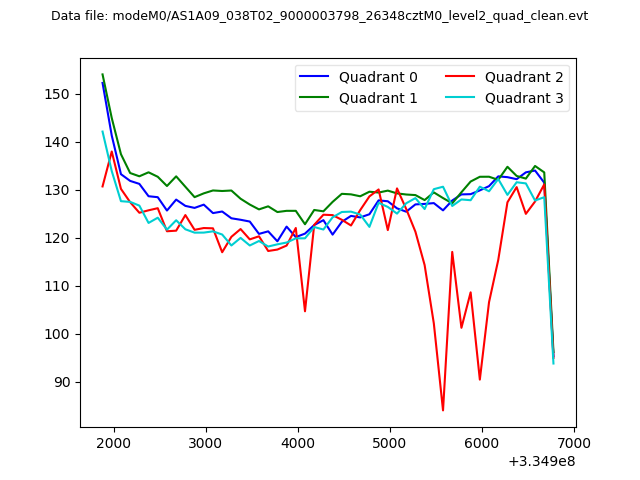 |
|
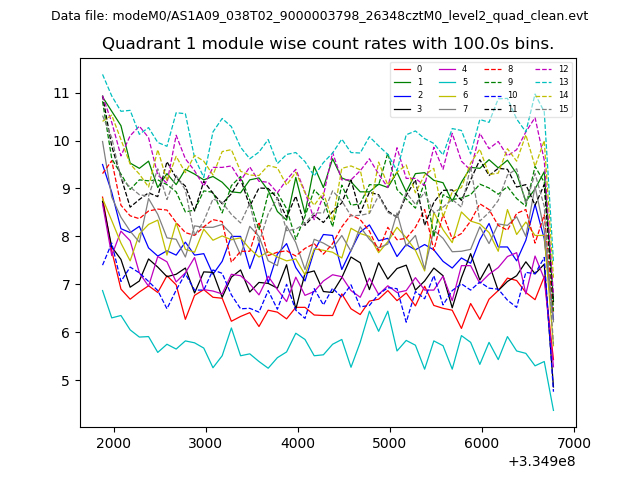
| Module-wise count rates for Quadrant A Data is divided into 100 sec bins |
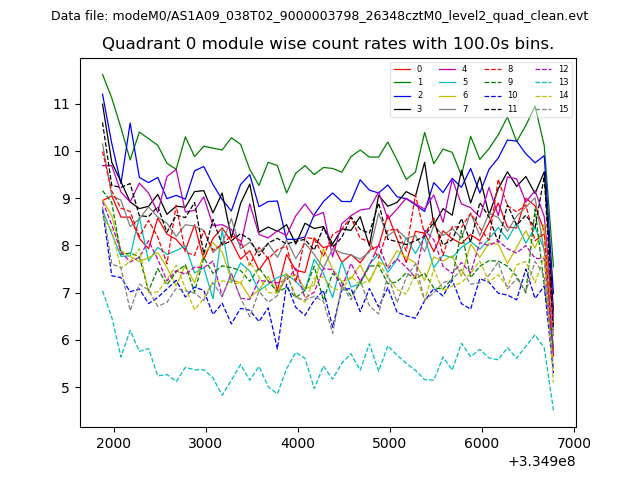 |
 |
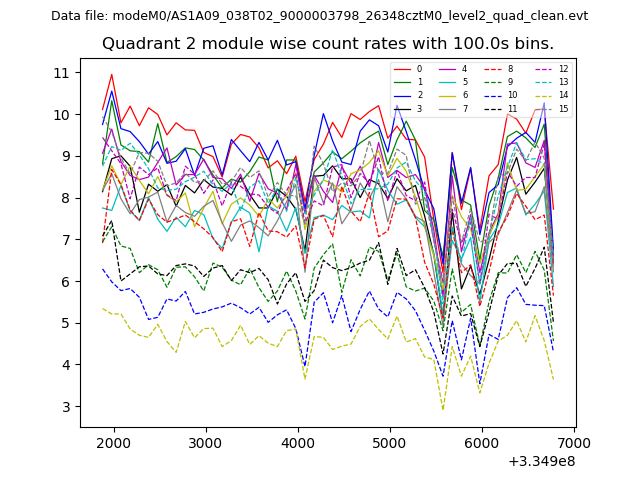
| Module-wise count rates for Quadrant B Data is divided into 100 sec bins |
 |
 |
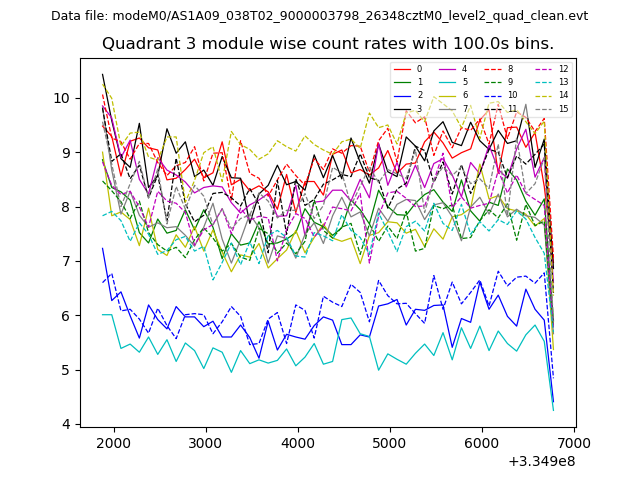
| Module-wise count rates for Quadrant C Data is divided into 100 sec bins |
 |
 |
| Module-wise count rates for Quadrant D Data is divided into 100 sec bins |
 |
 |
| Parameter | Plot |
|---|---|
| CZT HV Monitor | 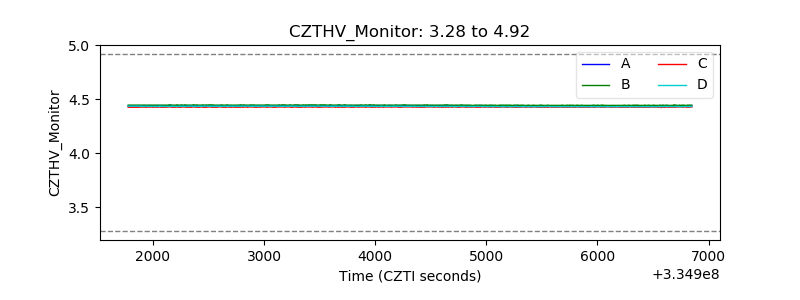 |
| D_VDD | 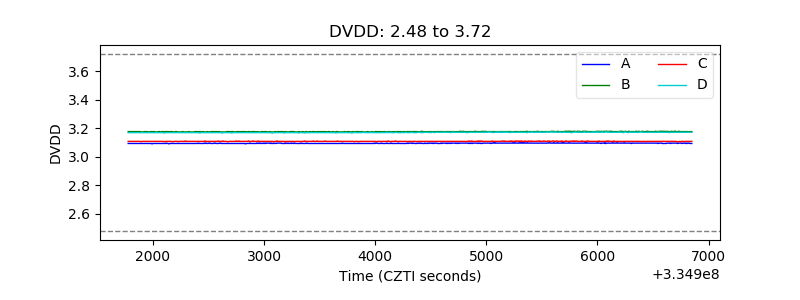 |
| Temperature 1 | 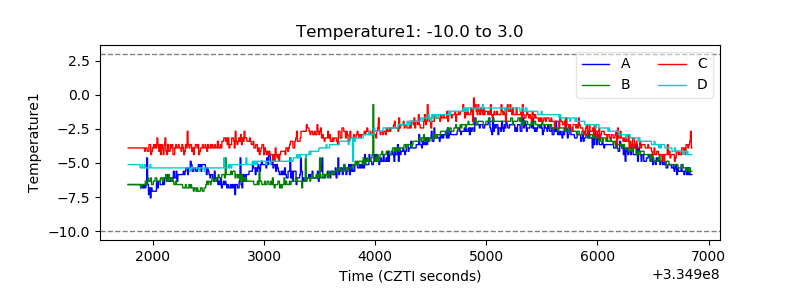 |
| Veto HV Monitor | 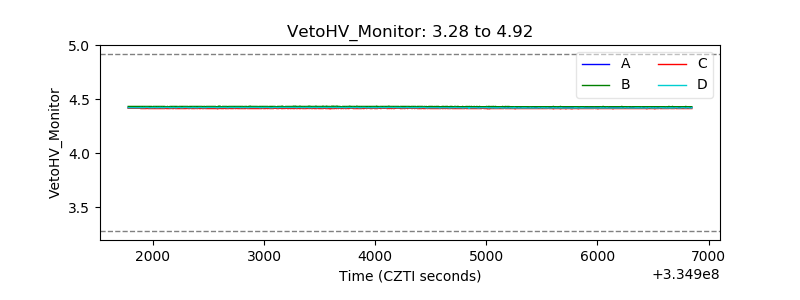 |
| Veto LLD | 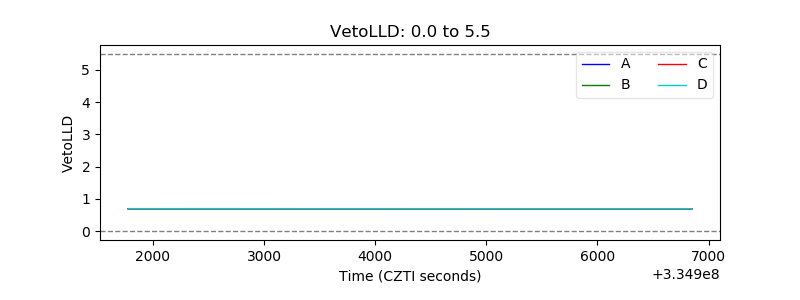 |
| Alpha Counter | 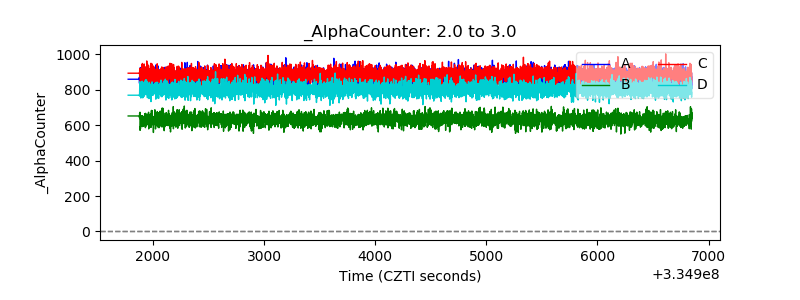 |
| _CPM_Rate | 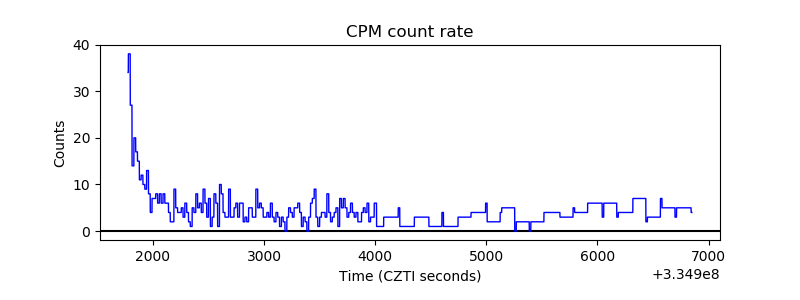 |
| CZT Counter |  |
| +2.5 Volts monitor |  |
| +5 Volts monitor |  |
| _ROLL_ROT | 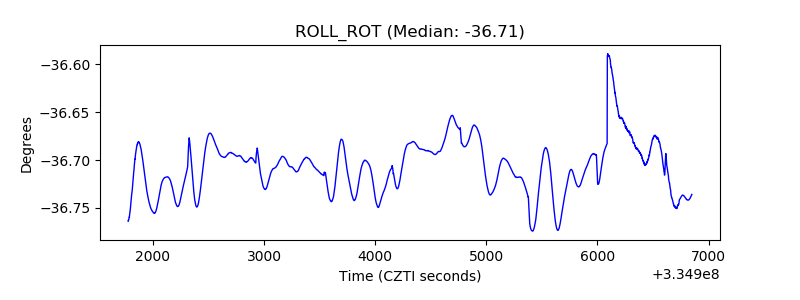 |
| _Roll_DEC | 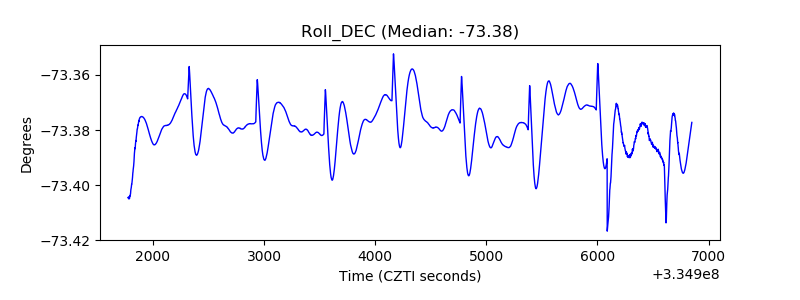 |
| _Roll_RA | 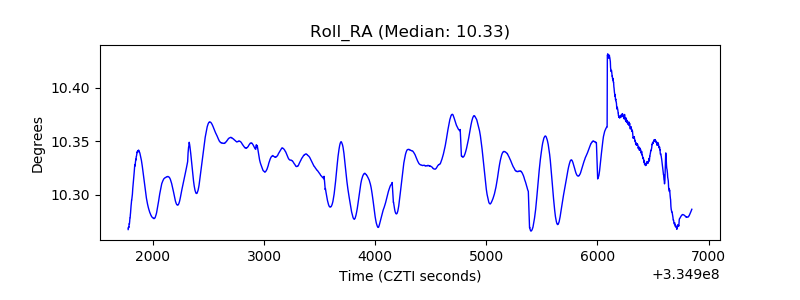 |
| Veto Counter | 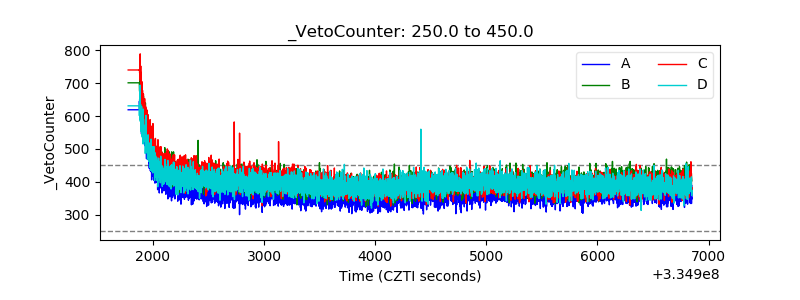 |