| Param | Original file | Final file |
|---|---|---|
| Filename | modeM0/AS1A09_038T03_9000003800cztM0_level2.fits | modeM0/AS1A09_038T03_9000003800cztM0_level2_quad_clean.evt |
| Size (bytes) | 62,383,680 | 66,746,880 |
| Size | 59.5 MB | 63.7 MB |
| Events in quadrant A | 377,038 | 405,061 |
| Events in quadrant B | 365,700 | 408,139 |
| Events in quadrant C | 360,436 | 387,538 |
| Events in quadrant D | 324,192 | 358,181 |
| Mode SS | |||
|---|---|---|---|
| Quadrant | BADHDUFLAG | Total packets | Discarded packets |
| A | 0 | 136 | 0 |
| B | 0 | 136 | 0 |
| C | 0 | 136 | 0 |
| D | 0 | 136 | 0 |
| Mode M9 | |||
|---|---|---|---|
| Quadrant | BADHDUFLAG | Total packets | Discarded packets |
| A | 0 | 3 | 0 |
| B | 0 | 3 | 0 |
| C | 0 | 3 | 0 |
| D | 0 | 3 | 0 |
| Mode M0 | |||
|---|---|---|---|
| Quadrant | BADHDUFLAG | Total packets | Discarded packets |
| A | 0 | 13590 | 0 |
| B | 0 | 13735 | 0 |
| C | 0 | 18419 | 0 |
| D | 0 | 17011 | 0 |
| Quadrant | Total seconds | Saturated seconds | Saturation percentage |
|---|---|---|---|
| A | 6617 | 178 | 2.690041% |
| B | 6617 | 214 | 3.234094% |
| C | 6617 | 514 | 7.767871% |
| D | 6617 | 265 | 4.004836% |
Noise dominated data is calculated using 1-second bins in cleaned event files. If a bin has >2000 counts, and if more than 50% of those come from <1% of pixels, then it is considered to be noise-dominated and hence unusable.
| Quadrant | # 1 sec bins | Bins with >0 counts | Bins with >2000 counts | High rate bins dominated by noise | Noise dominated (total time) | Noise dominated (detector-on time) | Marked lightcurve |
|---|---|---|---|---|---|---|---|
| A | 6977 | 6617 | 0 | 0 | 0.00% | 0.00% |  |
| B | 6977 | 6617 | 0 | 0 | 0.00% | 0.00% | 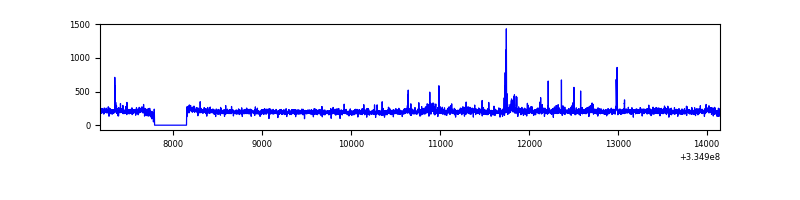 |
| C | 6977 | 6617 | 0 | 0 | 0.00% | 0.00% | 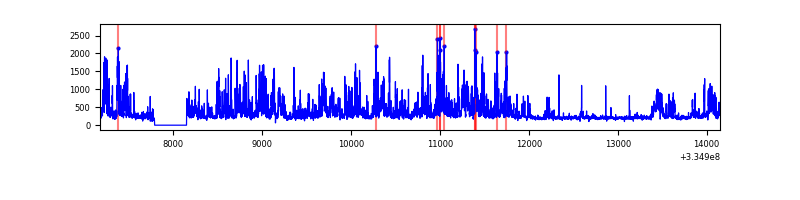 |
| D | 6977 | 6615 | 0 | 0 | 0.00% | 0.00% | 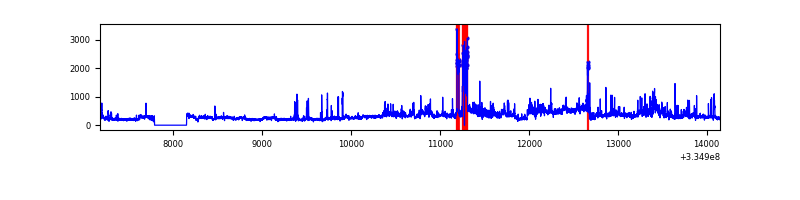 |
Top three noisy pixels from each quadrant. If the there are fewer than three noisy pixels in the level2.evt file, extra rows are filled as -1
| Pixel properties | Quadrant properties | ||||||
|---|---|---|---|---|---|---|---|
| Quadrant | DetID | PixID | Counts | Sigma | Mean | Median | Sigma |
| A | 0 | 29 | 363 | 10.3 | 98 | 92 | 26.3 |
| A | 9 | 19 | 284 | 7.3 | 98 | 92 | 26.3 |
| A | 0 | 30 | 273 | 6.88 | 98 | 92 | 26.3 |
| B | 2 | 9 | 305 | 9.85 | 96 | 92 | 21.6 |
| B | 2 | 8 | 253 | 7.45 | 96 | 92 | 21.6 |
| B | 5 | 225 | 250 | 7.31 | 96 | 92 | 21.6 |
| C | 12 | 249 | 267 | 7.0 | 95 | 89 | 25.4 |
| C | 2 | 191 | 260 | 6.72 | 95 | 89 | 25.4 |
| C | 12 | 250 | 253 | 6.45 | 95 | 89 | 25.4 |
| D | 4 | 246 | 242 | 6.01 | 92 | 83 | 26.4 |
| D | 15 | 46 | 240 | 5.94 | 92 | 83 | 26.4 |
| D | 6 | 62 | 240 | 5.94 | 92 | 83 | 26.4 |
Histogram calculated using DETX and DETY for each event in the final _common_clean file
| Quadrant A |  |
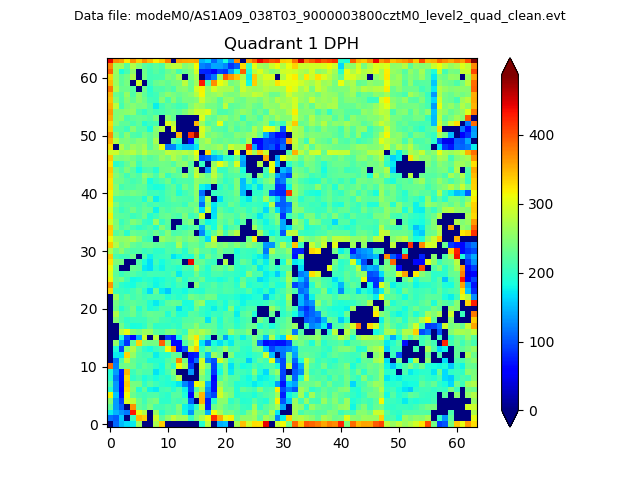 |
Quadrant B |
|---|---|---|---|
| Quadrant D | 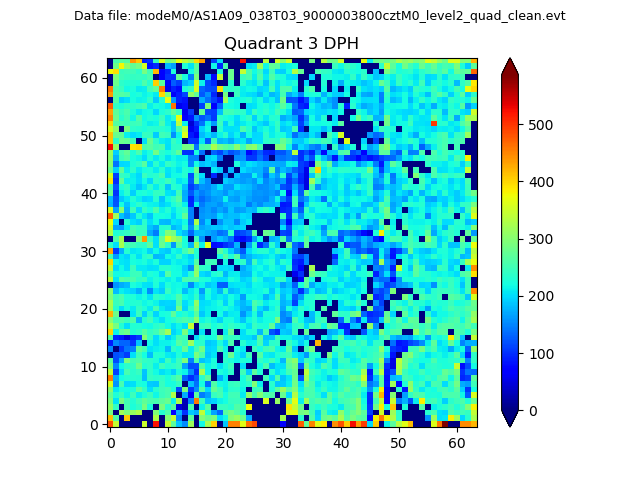 |
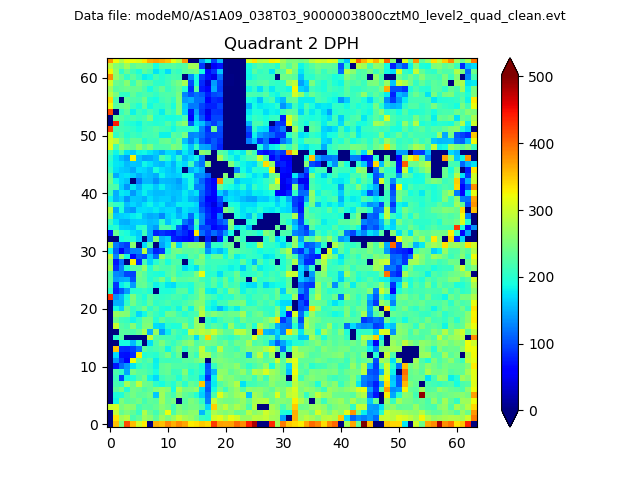 |
Quadrant C |
| Plot type | Count rate plots | Images |
|---|---|---|
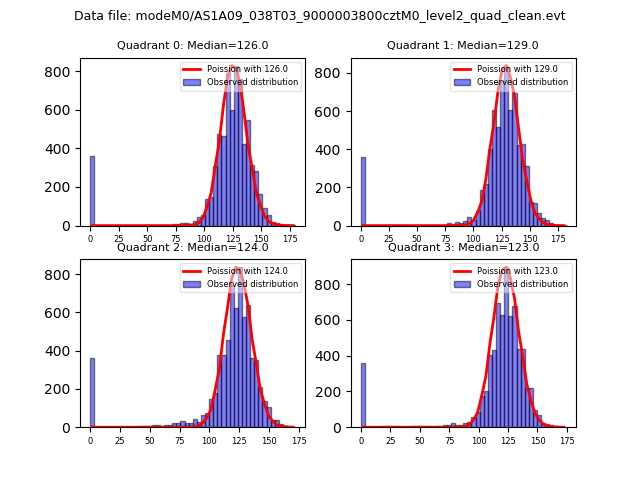
| Comparison with Poisson distribution Blue bars denote a histogram of data divided into 1 sec bins. Red curve is a Poisson curve with rate = median count rate of data. |
 |
 |
| Quadrant-wise count rates Data is divided into 100 sec bins |
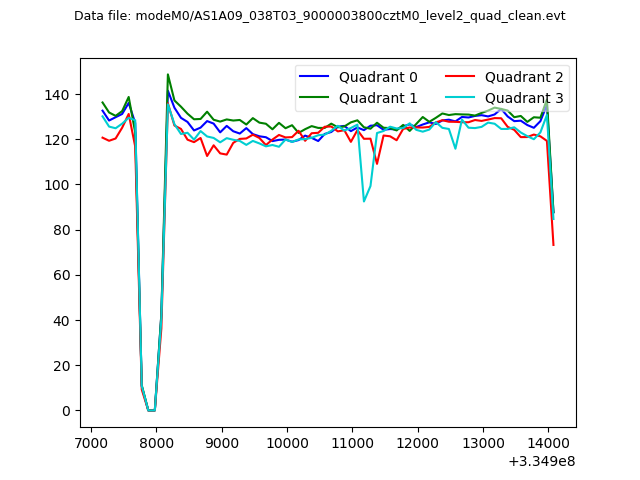 |
|
| Module-wise count rates for Quadrant A Data is divided into 100 sec bins |
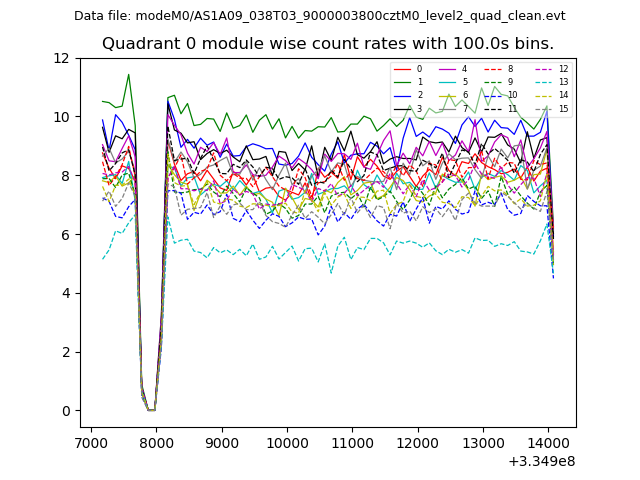 |
 |
| Module-wise count rates for Quadrant B Data is divided into 100 sec bins |
 |
 |
| Module-wise count rates for Quadrant C Data is divided into 100 sec bins |
 |
 |
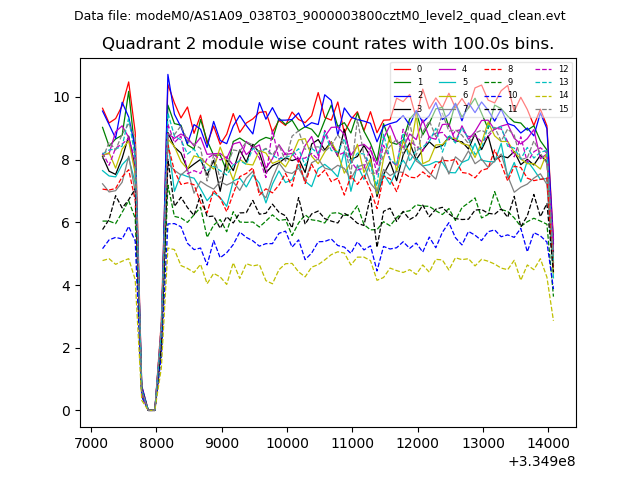
| Module-wise count rates for Quadrant D Data is divided into 100 sec bins |
 |
 |
| Parameter | Plot |
|---|---|
| CZT HV Monitor |  |
| D_VDD | 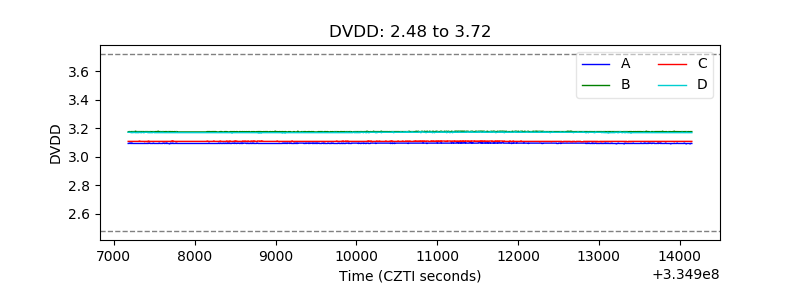 |
| Temperature 1 | 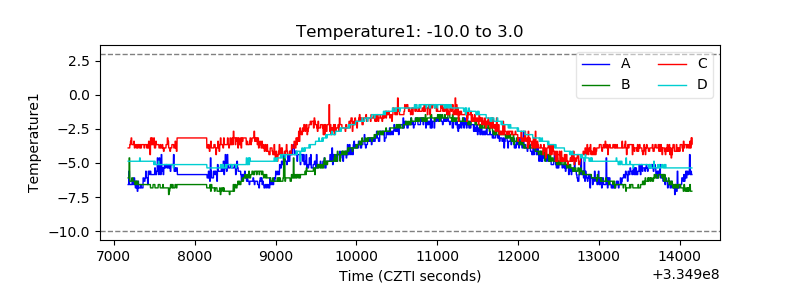 |
| Veto HV Monitor | 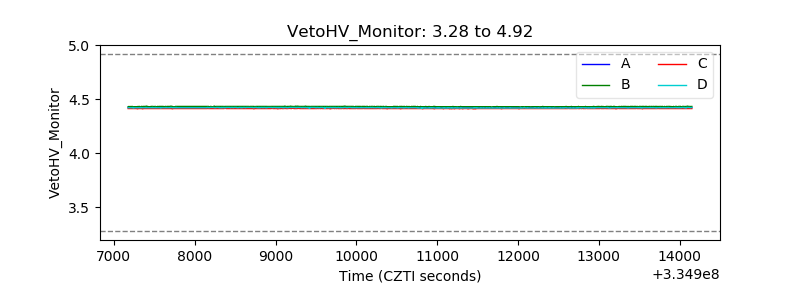 |
| Veto LLD | 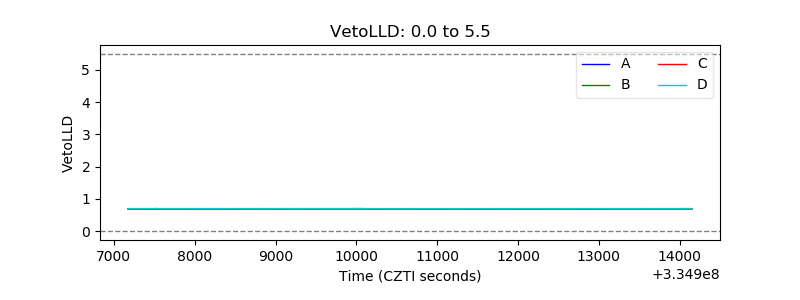 |
| Alpha Counter |  |
| _CPM_Rate | 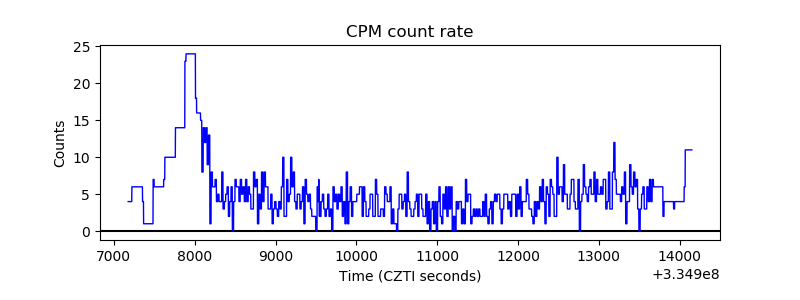 |
| CZT Counter | 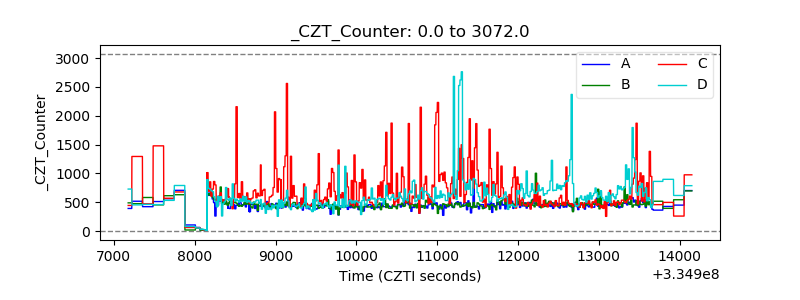 |
| +2.5 Volts monitor |  |
| +5 Volts monitor | 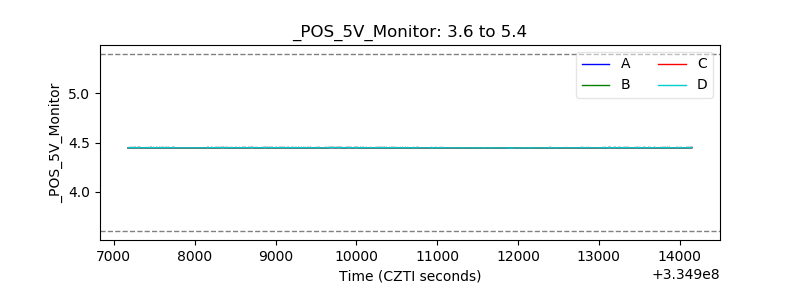 |
| _ROLL_ROT | 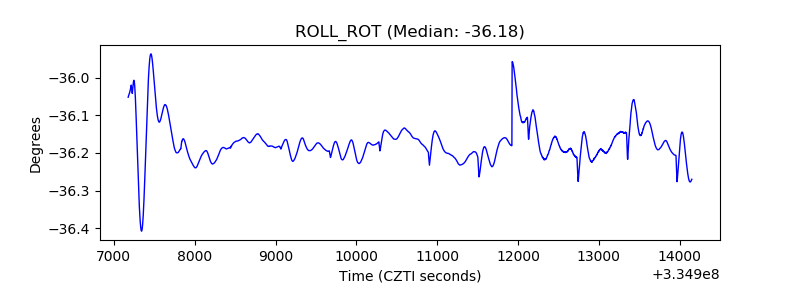 |
| _Roll_DEC | 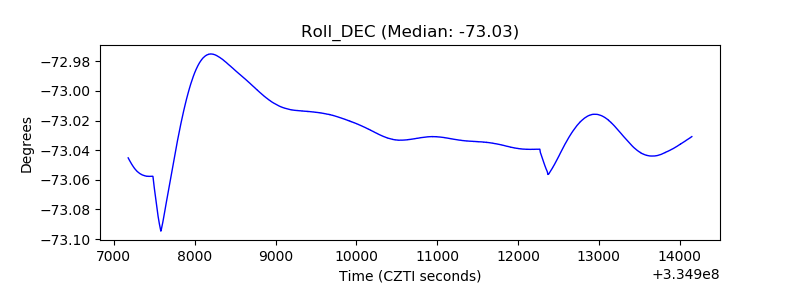 |
| _Roll_RA | 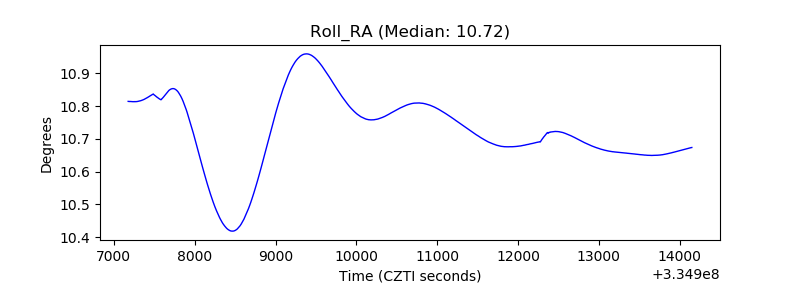 |
| Veto Counter |  |