| Param | Original file | Final file |
|---|---|---|
| Filename | modeM0/AS1A09_038T03_9000003800_26348cztM0_level2.evt | modeM0/AS1A09_038T03_9000003800_26348cztM0_level2_quad_clean.evt |
| Size (bytes) | 165,058,560 | 41,112,000 |
| Size | 157.4 MB | 39.2 MB |
| Events in quadrant A | 1,021,088 | 276,066 |
| Events in quadrant B | 1,051,983 | 284,381 |
| Events in quadrant C | 1,660,607 | 260,411 |
| Events in quadrant D | 1,115,186 | 266,687 |
| Mode M9 | |||
|---|---|---|---|
| Quadrant | BADHDUFLAG | Total packets | Discarded packets |
| A | 0 | 3 | 0 |
| B | 0 | 3 | 0 |
| C | 0 | 3 | 0 |
| D | 0 | 3 | 0 |
| Mode M0 | |||
|---|---|---|---|
| Quadrant | BADHDUFLAG | Total packets | Discarded packets |
| A | 0 | 4520 | 0 |
| B | 0 | 4561 | 0 |
| C | 0 | 6403 | 0 |
| D | 0 | 4711 | 0 |
| Quadrant | Total seconds | Saturated seconds | Saturation percentage |
|---|---|---|---|
| A | 2162 | 87 | 4.024052% |
| B | 2162 | 120 | 5.550416% |
| C | 2161 | 261 | 12.077742% |
| D | 2161 | 84 | 3.887089% |
Noise dominated data is calculated using 1-second bins in cleaned event files. If a bin has >2000 counts, and if more than 50% of those come from <1% of pixels, then it is considered to be noise-dominated and hence unusable.
| Quadrant | # 1 sec bins | Bins with >0 counts | Bins with >2000 counts | High rate bins dominated by noise | Noise dominated (total time) | Noise dominated (detector-on time) | Marked lightcurve |
|---|---|---|---|---|---|---|---|
| A | 2522 | 2163 | 0 | 0 | 0.00% | 0.00% | 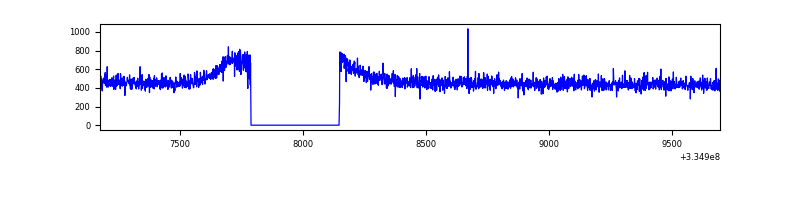 |
| B | 2522 | 2163 | 0 | 0 | 0.00% | 0.00% | 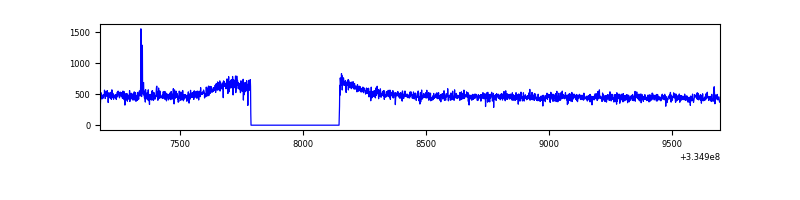 |
| C | 2521 | 2162 | 53 | 53 | 2.10% | 2.45% | 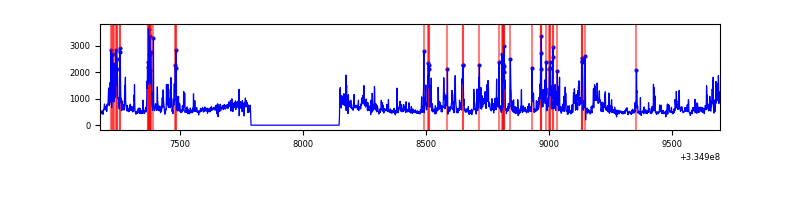 |
| D | 2521 | 2162 | 0 | 0 | 0.00% | 0.00% | 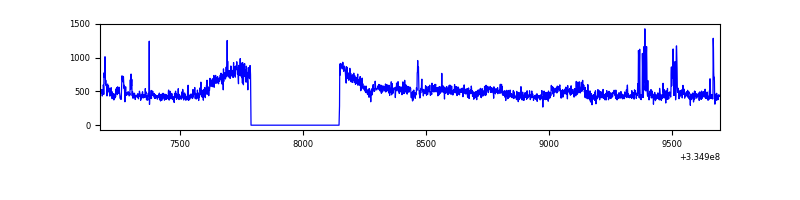 |
Top three noisy pixels from each quadrant. If the there are fewer than three noisy pixels in the level2.evt file, extra rows are filled as -1
| Pixel properties | Quadrant properties | ||||||
|---|---|---|---|---|---|---|---|
| Quadrant | DetID | PixID | Counts | Sigma | Mean | Median | Sigma |
| A | 6 | 16 | 4201 | 72.88 | 263 | 256 | 54.1 |
| A | 13 | 254 | 3297 | 56.18 | 263 | 256 | 54.1 |
| A | 3 | 137 | 2602 | 43.34 | 263 | 256 | 54.1 |
| B | 0 | 230 | 6710 | 121.8 | 265 | 258 | 53.0 |
| B | 12 | 111 | 6416 | 116.25 | 265 | 258 | 53.0 |
| B | 11 | 111 | 5700 | 102.74 | 265 | 258 | 53.0 |
| C | 3 | 233 | 505254 | 8215.8 | 257 | 258 | 61.5 |
| C | 0 | 239 | 104496 | 1695.85 | 257 | 258 | 61.5 |
| C | 14 | 238 | 40551 | 655.53 | 257 | 258 | 61.5 |
| D | 1 | 52 | 124233 | 1966.23 | 261 | 253 | 63.1 |
| D | 2 | 234 | 8528 | 131.24 | 261 | 253 | 63.1 |
| D | 14 | 226 | 2490 | 35.48 | 261 | 253 | 63.1 |
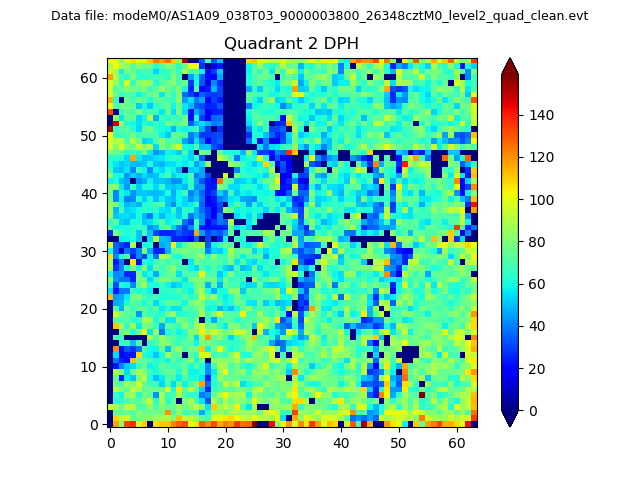
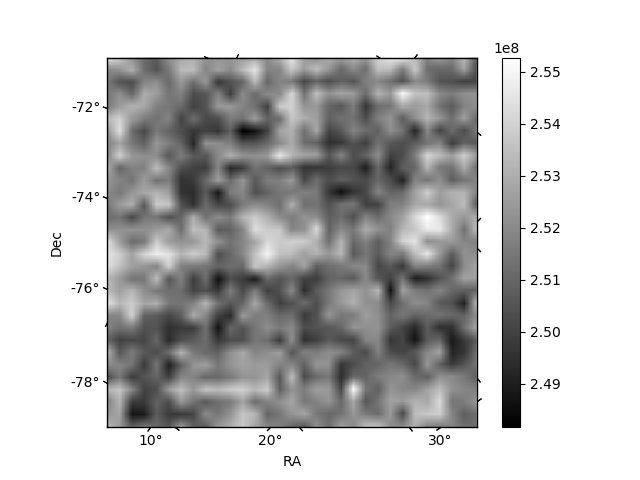
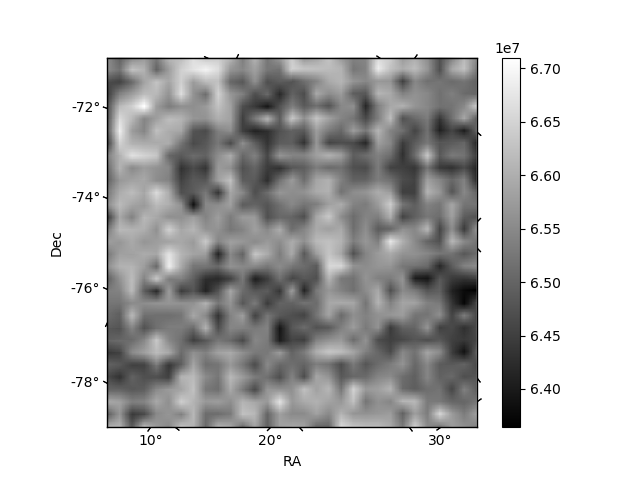
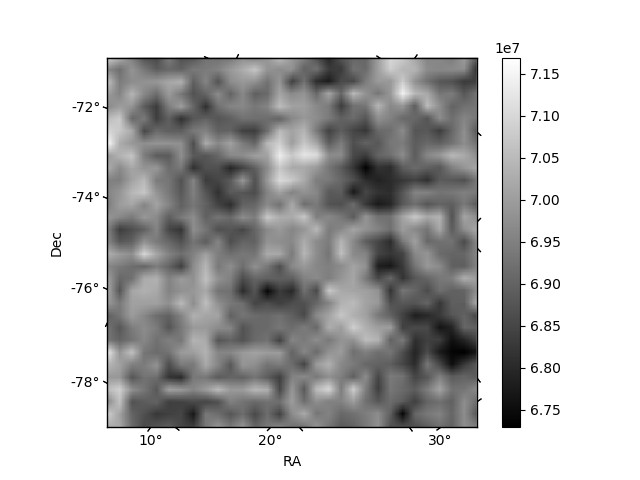
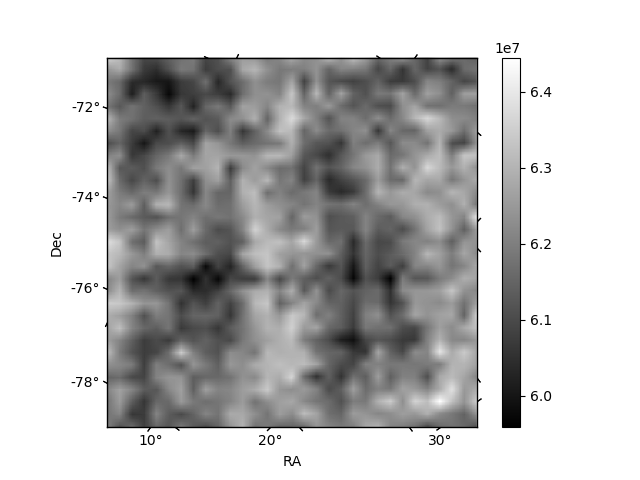
Histogram calculated using DETX and DETY for each event in the final _common_clean file
| Quadrant A | 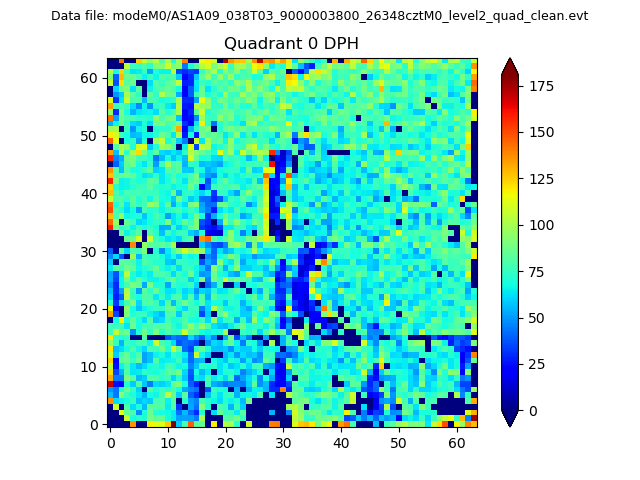 |
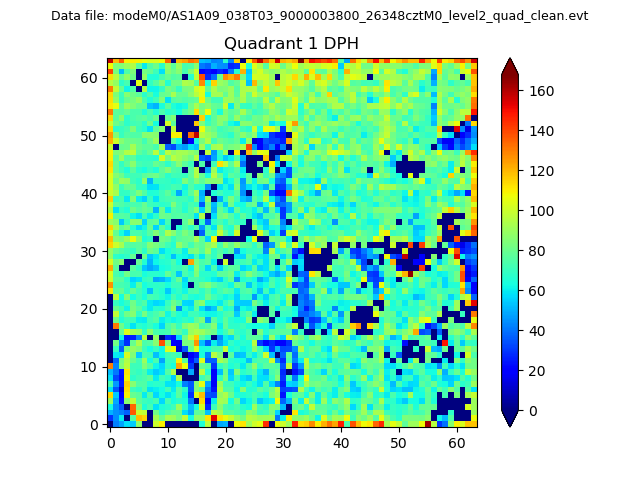 |
Quadrant B |
|---|---|---|---|
| Quadrant D | 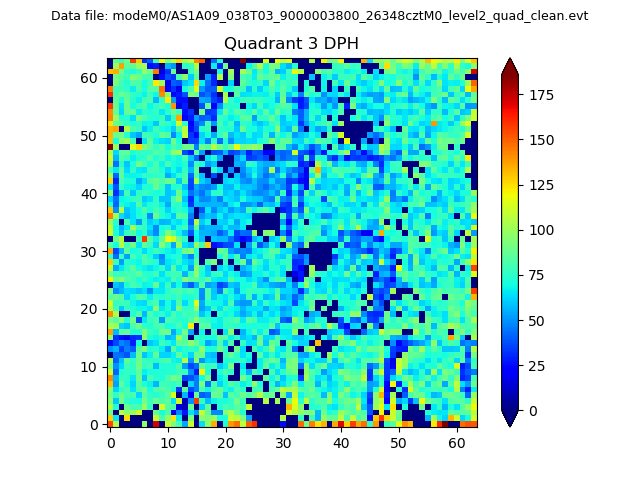 |
 |
Quadrant C |
| Plot type | Count rate plots | Images |
|---|---|---|
| Comparison with Poisson distribution Blue bars denote a histogram of data divided into 1 sec bins. Red curve is a Poisson curve with rate = median count rate of data. |
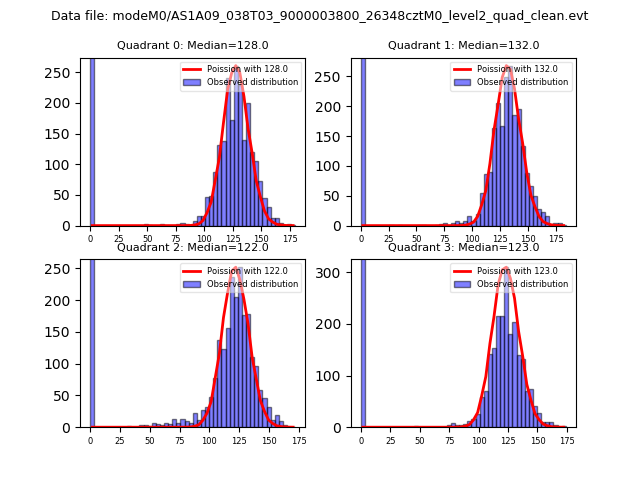 |
 |
| Quadrant-wise count rates Data is divided into 100 sec bins |
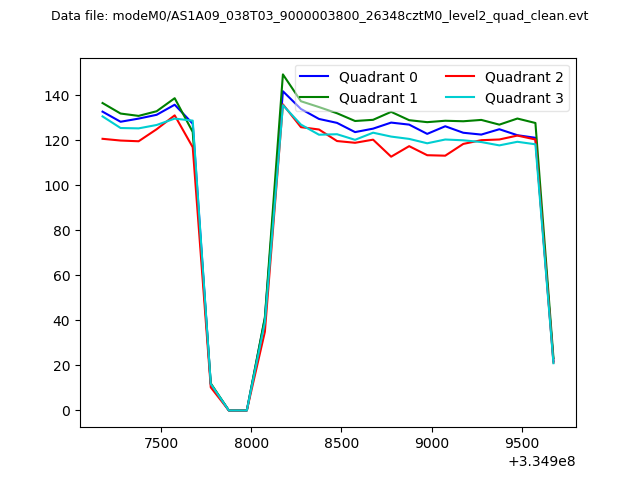 |
|
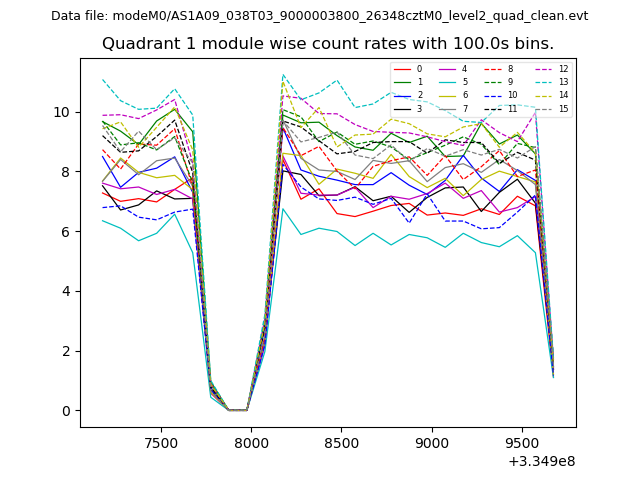
| Module-wise count rates for Quadrant A Data is divided into 100 sec bins |
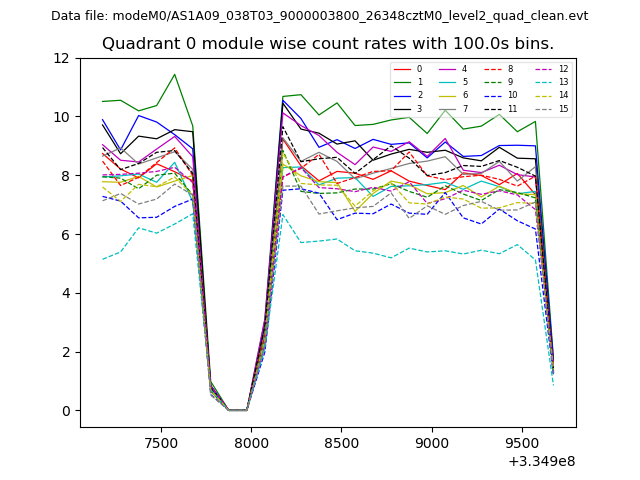 |
 |
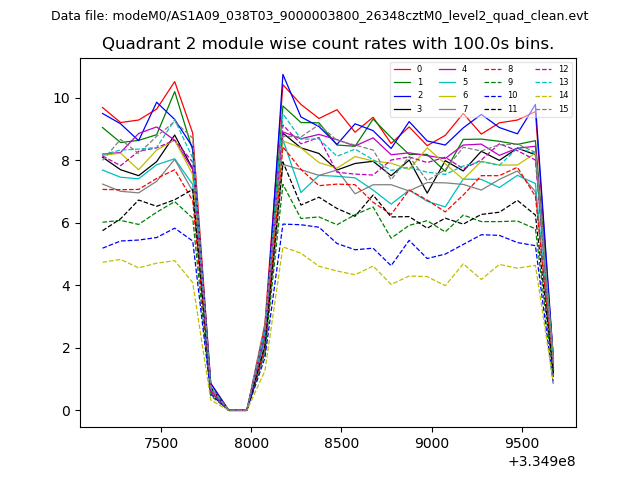
| Module-wise count rates for Quadrant B Data is divided into 100 sec bins |
 |
 |
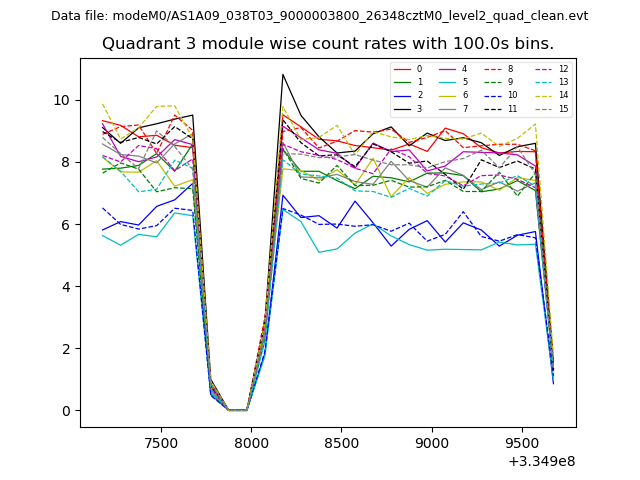
| Module-wise count rates for Quadrant C Data is divided into 100 sec bins |
 |
 |
| Module-wise count rates for Quadrant D Data is divided into 100 sec bins |
 |
 |
| Parameter | Plot |
|---|---|
| CZT HV Monitor | 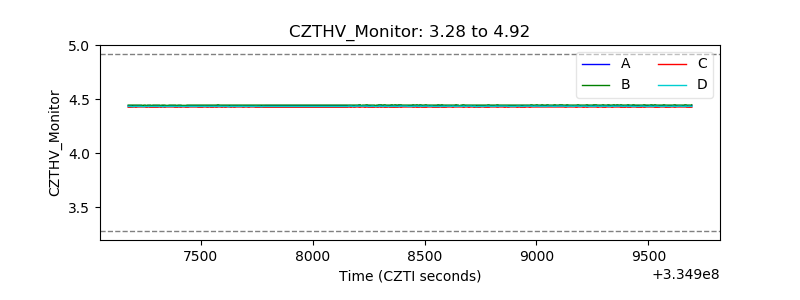 |
| D_VDD |  |
| Temperature 1 | 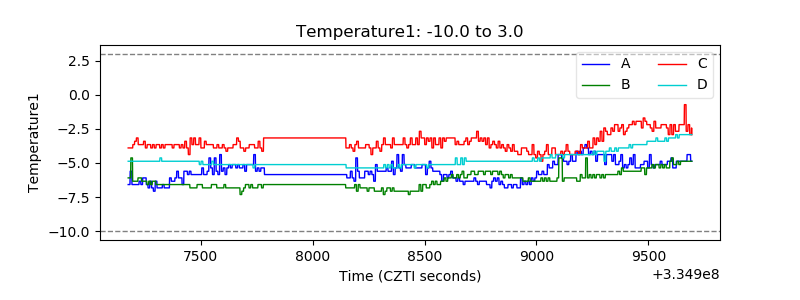 |
| Veto HV Monitor | 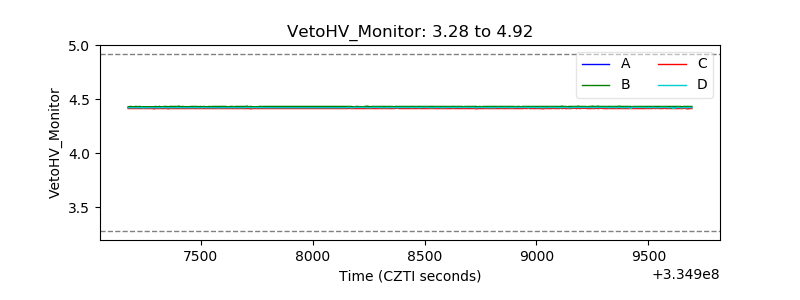 |
| Veto LLD | 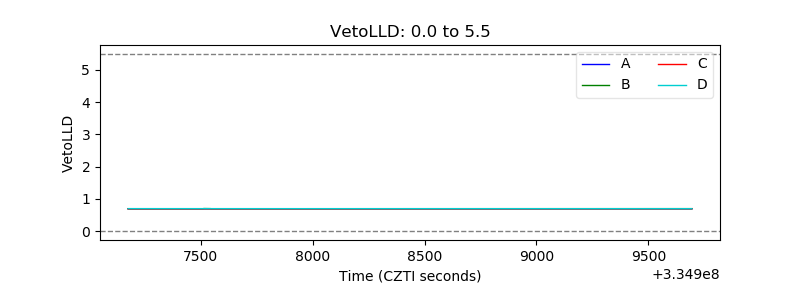 |
| Alpha Counter | 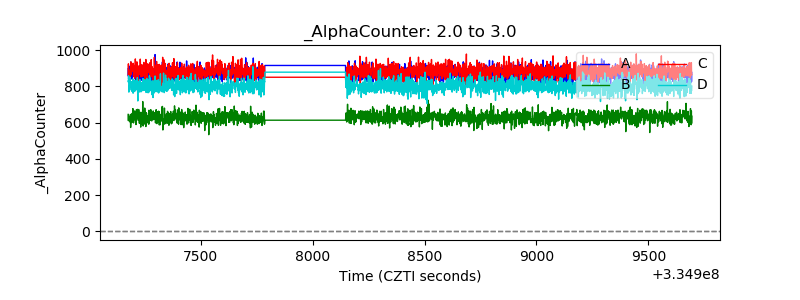 |
| _CPM_Rate | 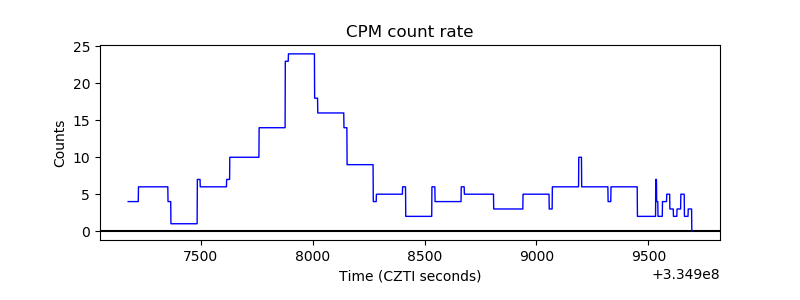 |
| CZT Counter | 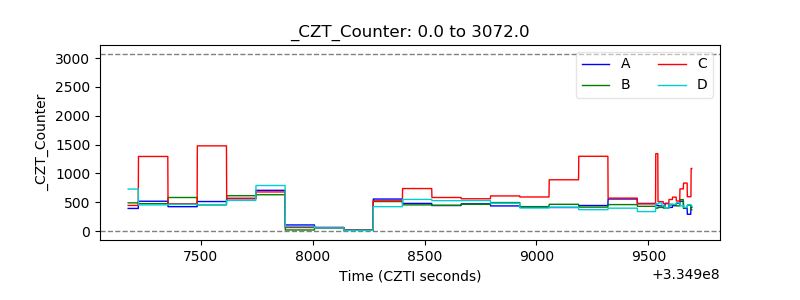 |
| +2.5 Volts monitor | 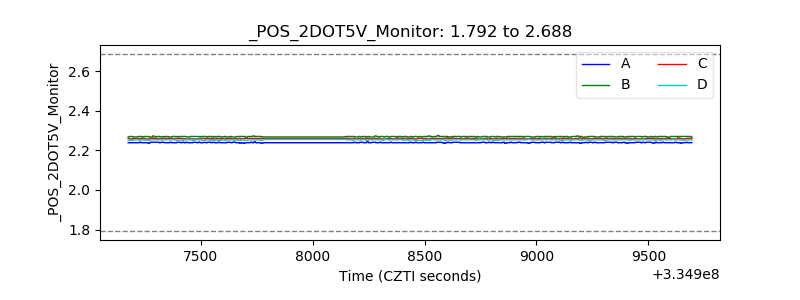 |
| +5 Volts monitor |  |
| _ROLL_ROT | 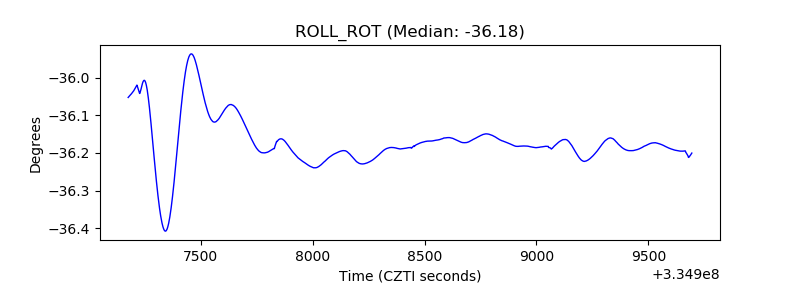 |
| _Roll_DEC | 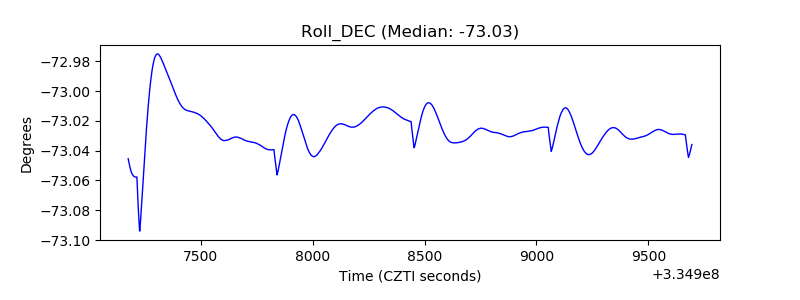 |
| _Roll_RA | 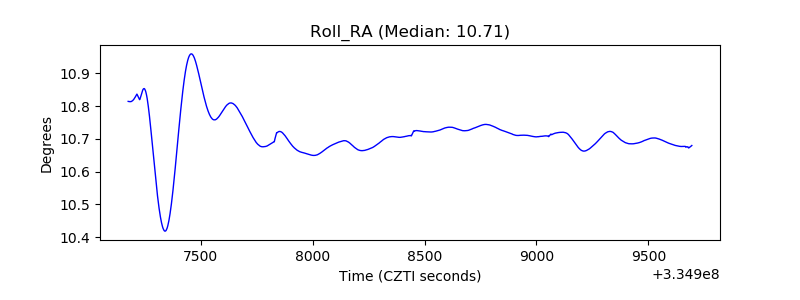 |
| Veto Counter | 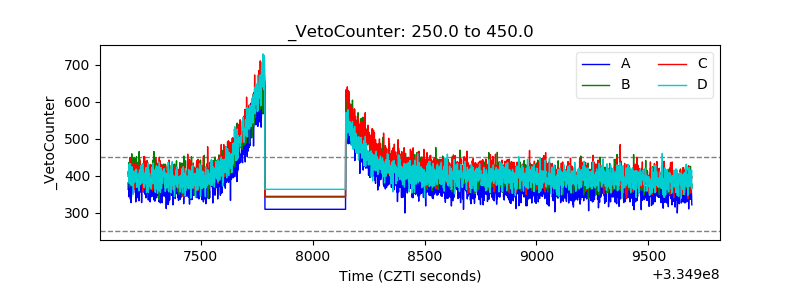 |