| Param | Original file | Final file |
|---|---|---|
| Filename | modeM0/AS1A09_038T03_9000003800_26350cztM0_level2.evt | modeM0/AS1A09_038T03_9000003800_26350cztM0_level2_quad_clean.evt |
| Size (bytes) | 119,393,280 | 29,041,920 |
| Size | 113.9 MB | 27.7 MB |
| Events in quadrant A | 732,874 | 194,705 |
| Events in quadrant B | 755,283 | 197,959 |
| Events in quadrant C | 939,938 | 187,234 |
| Events in quadrant D | 1,082,130 | 187,132 |
| Mode M0 | |||
|---|---|---|---|
| Quadrant | BADHDUFLAG | Total packets | Discarded packets |
| A | 0 | 3177 | 0 |
| B | 0 | 3195 | 0 |
| C | 0 | 3775 | 0 |
| D | 0 | 4229 | 0 |
| Quadrant | Total seconds | Saturated seconds | Saturation percentage |
|---|---|---|---|
| A | 1512 | 87 | 5.753968% |
| B | 1513 | 91 | 6.014541% |
| C | 1513 | 151 | 9.980172% |
| D | 1513 | 102 | 6.741573% |
Noise dominated data is calculated using 1-second bins in cleaned event files. If a bin has >2000 counts, and if more than 50% of those come from <1% of pixels, then it is considered to be noise-dominated and hence unusable.
| Quadrant | # 1 sec bins | Bins with >0 counts | Bins with >2000 counts | High rate bins dominated by noise | Noise dominated (total time) | Noise dominated (detector-on time) | Marked lightcurve |
|---|---|---|---|---|---|---|---|
| A | 1512 | 1512 | 0 | 0 | 0.00% | 0.00% | 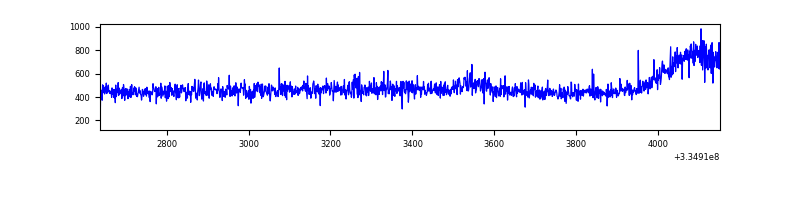 |
| B | 1513 | 1513 | 0 | 0 | 0.00% | 0.00% | 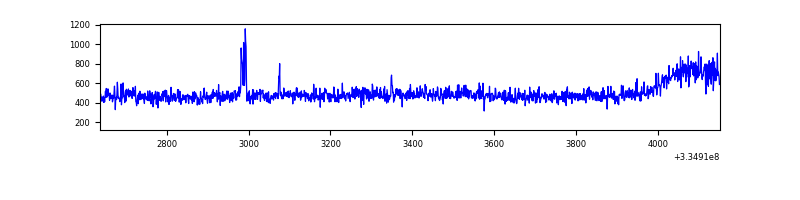 |
| C | 1513 | 1513 | 7 | 7 | 0.46% | 0.46% | 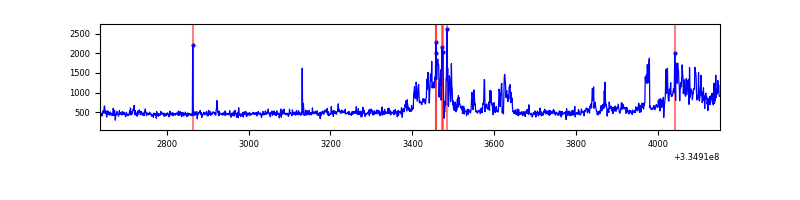 |
| D | 1513 | 1513 | 18 | 18 | 1.19% | 1.19% | 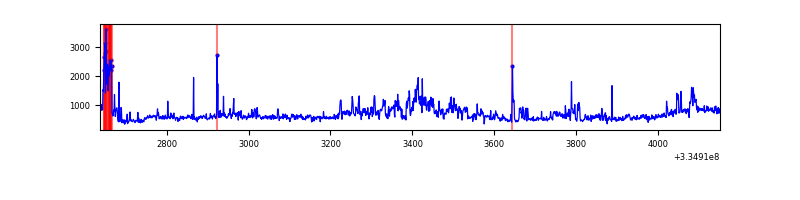 |
Top three noisy pixels from each quadrant. If the there are fewer than three noisy pixels in the level2.evt file, extra rows are filled as -1
| Pixel properties | Quadrant properties | ||||||
|---|---|---|---|---|---|---|---|
| Quadrant | DetID | PixID | Counts | Sigma | Mean | Median | Sigma |
| A | 6 | 16 | 5371 | 127.06 | 188 | 183 | 40.8 |
| A | 13 | 254 | 2610 | 59.44 | 188 | 183 | 40.8 |
| A | 3 | 137 | 1936 | 42.93 | 188 | 183 | 40.8 |
| B | 0 | 219 | 7752 | 194.1 | 189 | 183 | 39.0 |
| B | 15 | 185 | 5897 | 146.53 | 189 | 183 | 39.0 |
| B | 12 | 111 | 4704 | 115.94 | 189 | 183 | 39.0 |
| C | 3 | 233 | 203021 | 4644.08 | 179 | 180 | 43.7 |
| C | 14 | 238 | 28469 | 647.68 | 179 | 180 | 43.7 |
| C | 0 | 239 | 8459 | 189.55 | 179 | 180 | 43.7 |
| D | 1 | 52 | 364314 | 8166.53 | 181 | 176 | 44.6 |
| D | 11 | 176 | 11540 | 254.86 | 181 | 176 | 44.6 |
| D | 2 | 234 | 7518 | 164.66 | 181 | 176 | 44.6 |
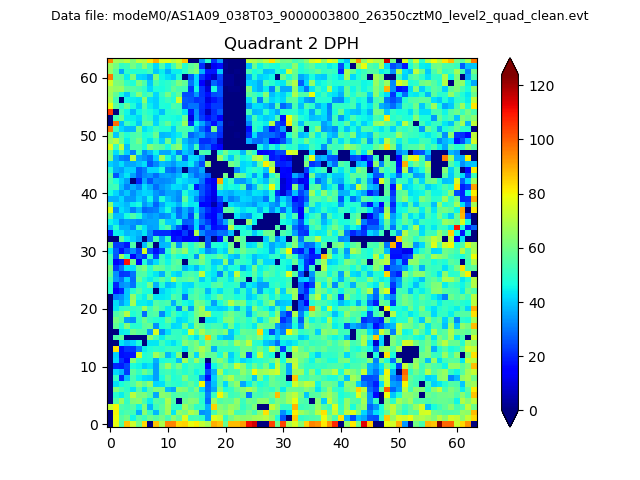
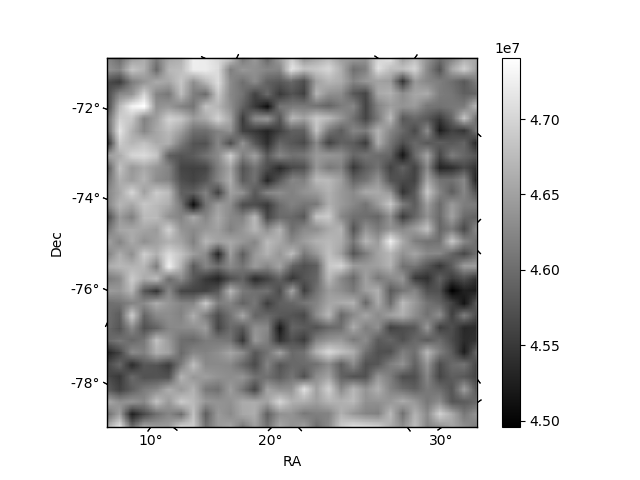
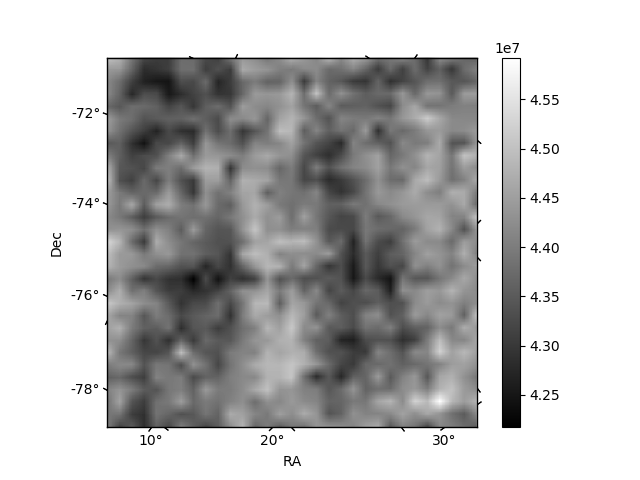
Histogram calculated using DETX and DETY for each event in the final _common_clean file
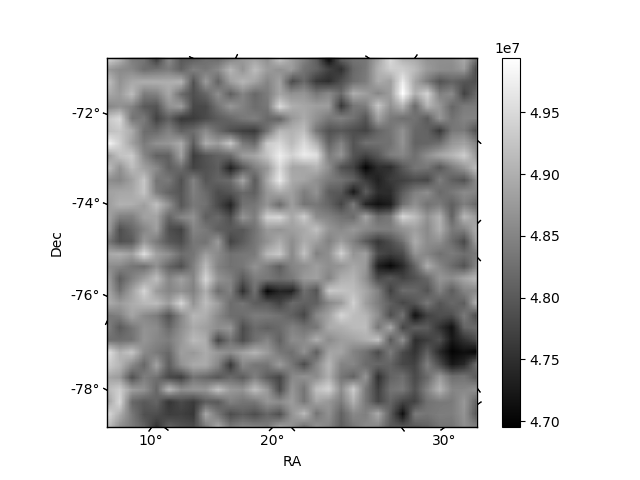
| Quadrant A | 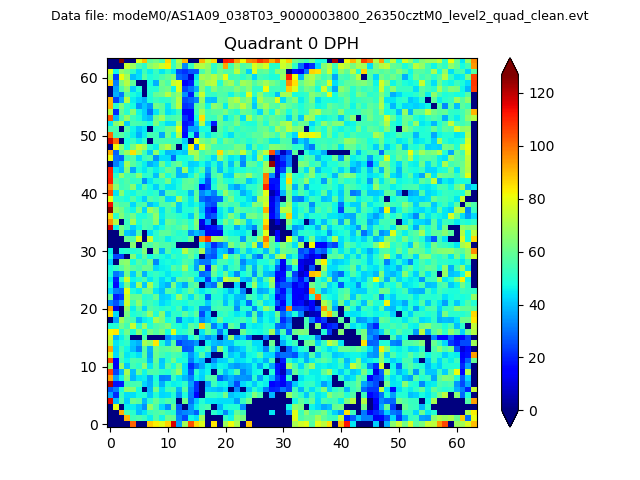 |
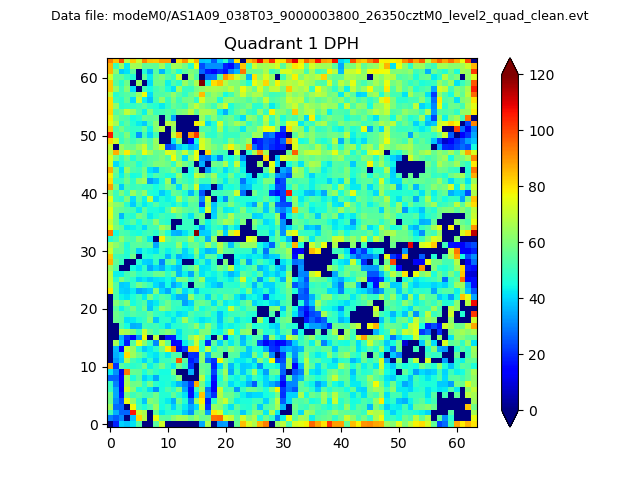 |
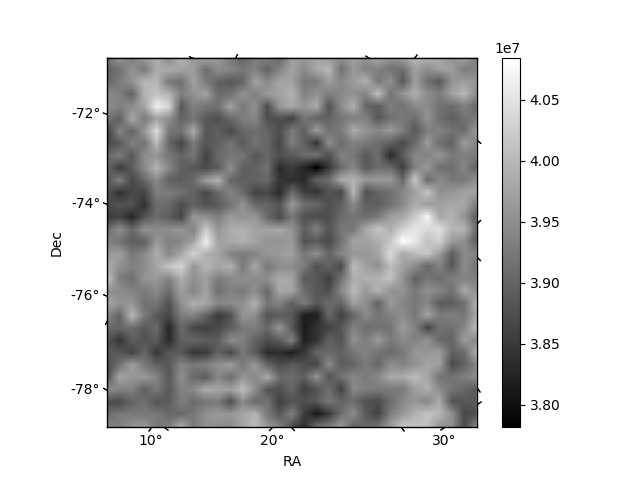
Quadrant B |
|---|---|---|---|
| Quadrant D | 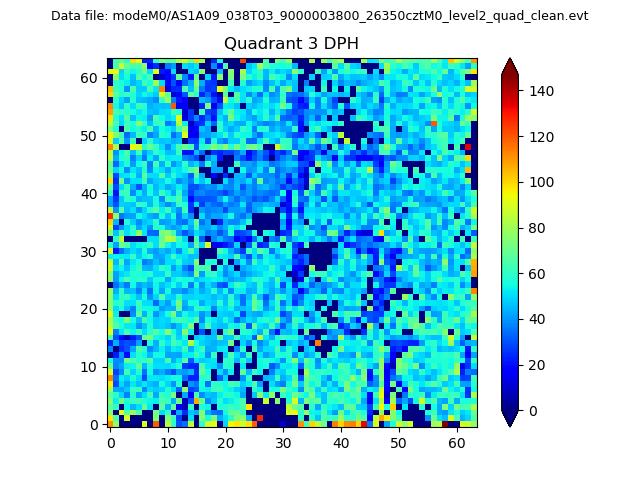 |
 |
Quadrant C |
| Plot type | Count rate plots | Images |
|---|---|---|
| Comparison with Poisson distribution Blue bars denote a histogram of data divided into 1 sec bins. Red curve is a Poisson curve with rate = median count rate of data. |
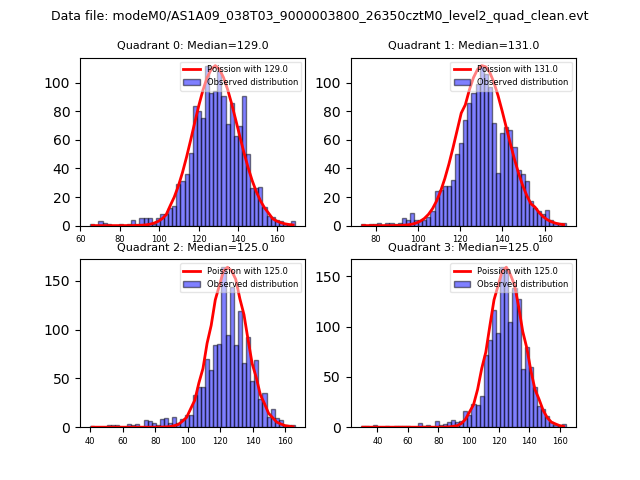 |
 |
| Quadrant-wise count rates Data is divided into 100 sec bins |
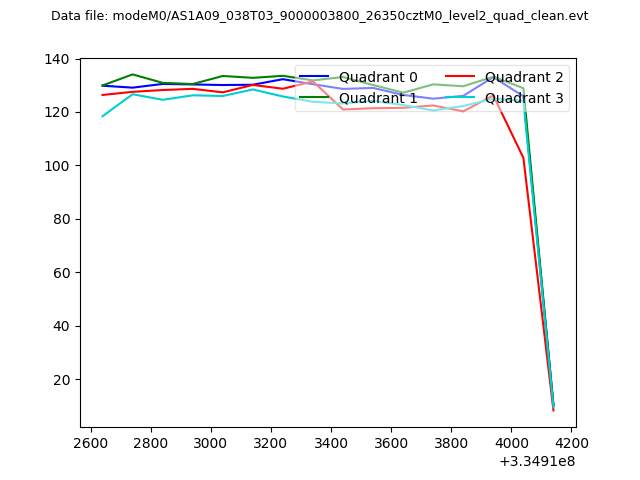 |
|
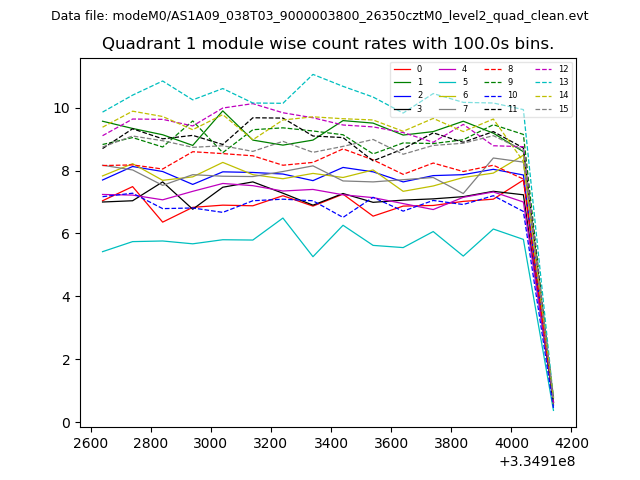
| Module-wise count rates for Quadrant A Data is divided into 100 sec bins |
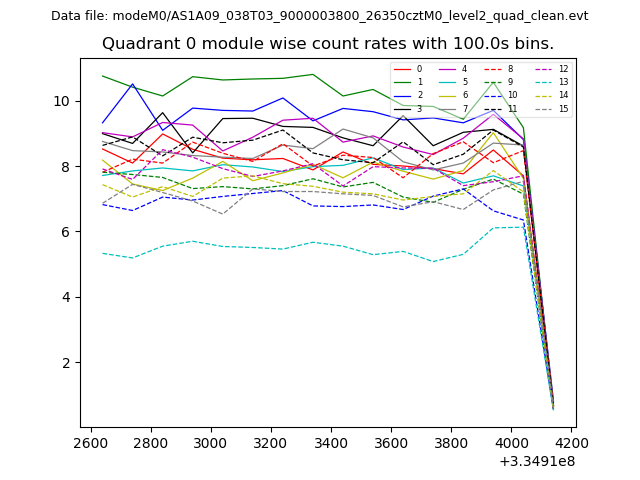 |
 |
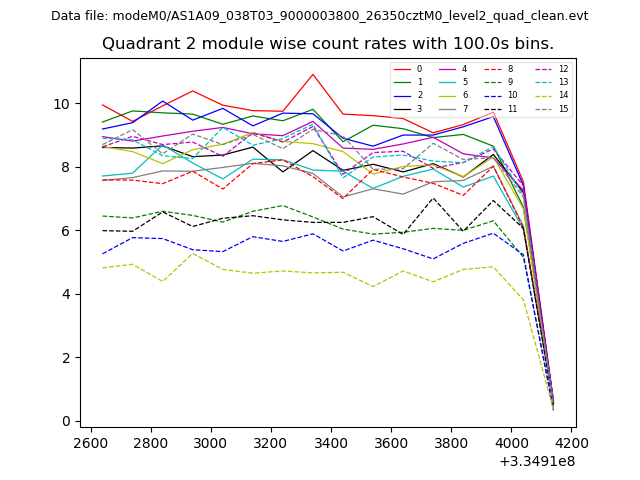
| Module-wise count rates for Quadrant B Data is divided into 100 sec bins |
 |
 |
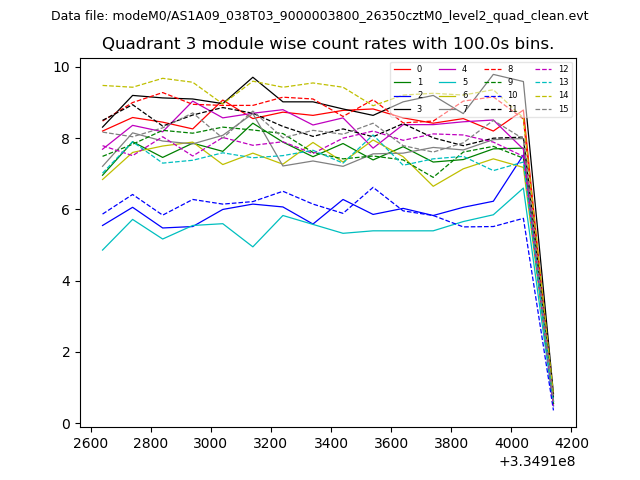
| Module-wise count rates for Quadrant C Data is divided into 100 sec bins |
 |
 |
| Module-wise count rates for Quadrant D Data is divided into 100 sec bins |
 |
 |
| Parameter | Plot |
|---|---|
| CZT HV Monitor |  |
| D_VDD |  |
| Temperature 1 | 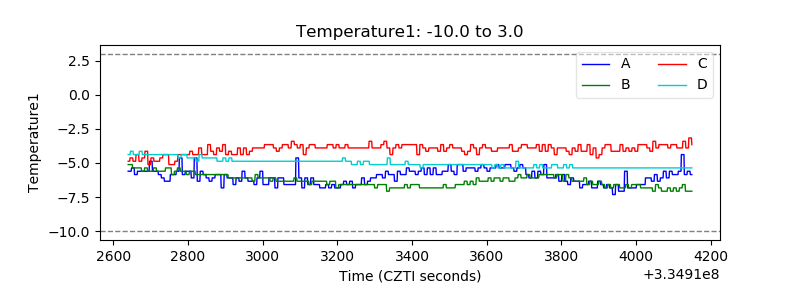 |
| Veto HV Monitor | 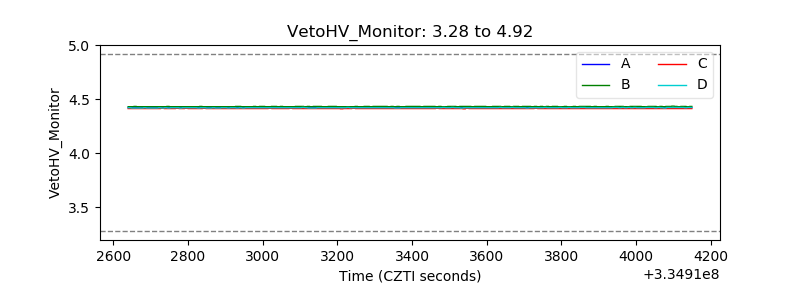 |
| Veto LLD | 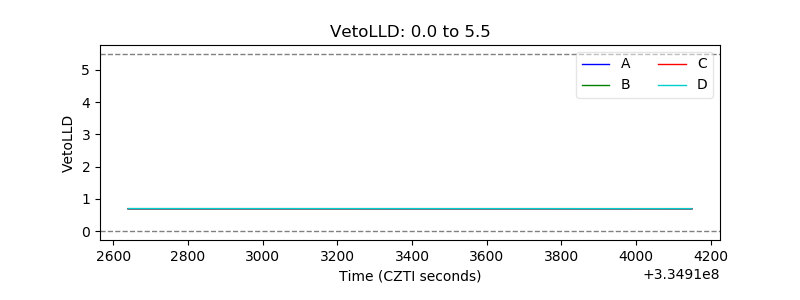 |
| Alpha Counter | 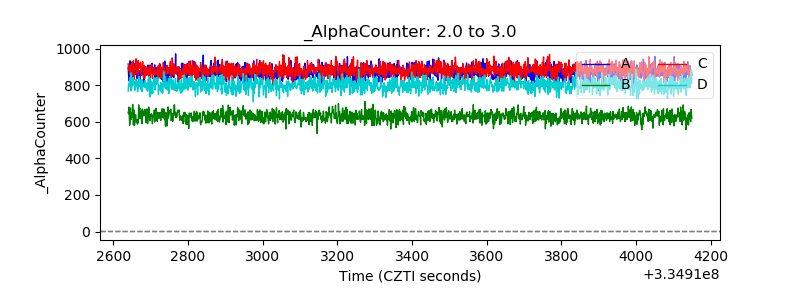 |
| _CPM_Rate | 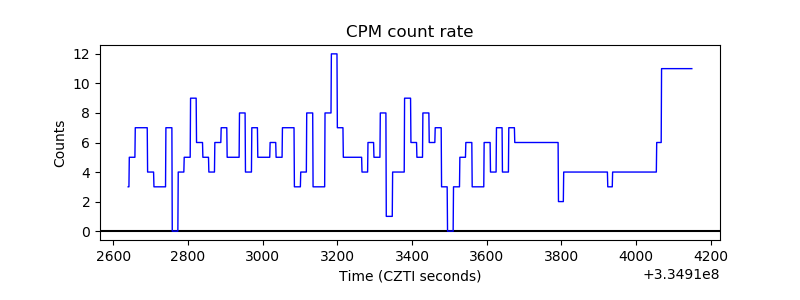 |
| CZT Counter | 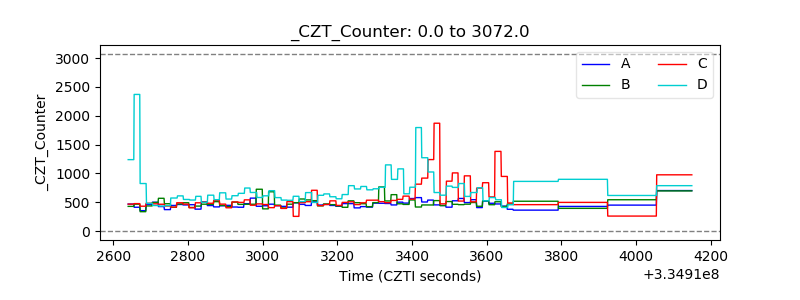 |
| +2.5 Volts monitor |  |
| +5 Volts monitor |  |
| _ROLL_ROT | 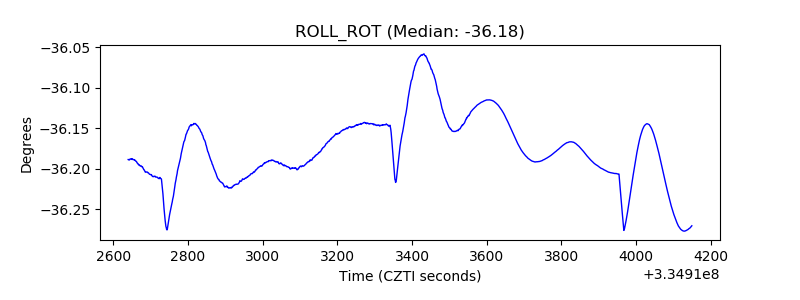 |
| _Roll_DEC | 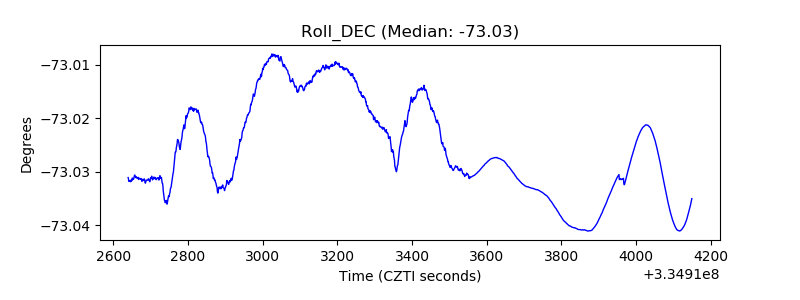 |
| _Roll_RA |  |
| Veto Counter | 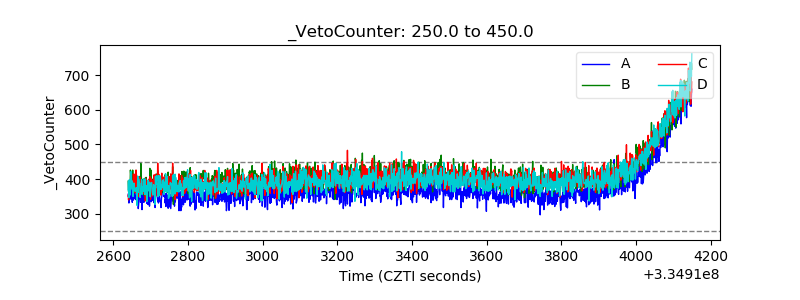 |