| Param | Original file | Final file |
|---|---|---|
| Filename | modeM0/AS1A09_038T04_9000003802cztM0_level2.fits | modeM0/AS1A09_038T04_9000003802cztM0_level2_quad_clean.evt |
| Size (bytes) | 54,956,160 | 59,535,360 |
| Size | 52.4 MB | 56.8 MB |
| Events in quadrant A | 332,394 | 366,745 |
| Events in quadrant B | 321,110 | 366,287 |
| Events in quadrant C | 312,902 | 331,729 |
| Events in quadrant D | 285,590 | 325,141 |
| Mode M0 | |||
|---|---|---|---|
| Quadrant | BADHDUFLAG | Total packets | Discarded packets |
| A | 0 | 11995 | 0 |
| B | 0 | 12069 | 0 |
| C | 0 | 18374 | 0 |
| D | 0 | 15058 | 0 |
| Mode SS | |||
|---|---|---|---|
| Quadrant | BADHDUFLAG | Total packets | Discarded packets |
| A | 0 | 120 | 0 |
| B | 0 | 120 | 0 |
| C | 0 | 120 | 0 |
| D | 0 | 120 | 0 |
| Mode M9 | |||
|---|---|---|---|
| Quadrant | BADHDUFLAG | Total packets | Discarded packets |
| A | 0 | 1 | 0 |
| B | 0 | 1 | 0 |
| C | 0 | 1 | 0 |
| D | 0 | 1 | 0 |
| Quadrant | Total seconds | Saturated seconds | Saturation percentage |
|---|---|---|---|
| A | 5899 | 99 | 1.678251% |
| B | 5899 | 103 | 1.746059% |
| C | 5899 | 581 | 9.849127% |
| D | 5899 | 136 | 2.305476% |
Noise dominated data is calculated using 1-second bins in cleaned event files. If a bin has >2000 counts, and if more than 50% of those come from <1% of pixels, then it is considered to be noise-dominated and hence unusable.
| Quadrant | # 1 sec bins | Bins with >0 counts | Bins with >2000 counts | High rate bins dominated by noise | Noise dominated (total time) | Noise dominated (detector-on time) | Marked lightcurve |
|---|---|---|---|---|---|---|---|
| A | 5899 | 5899 | 0 | 0 | 0.00% | 0.00% |  |
| B | 5899 | 5899 | 0 | 0 | 0.00% | 0.00% |  |
| C | 5899 | 5899 | 0 | 0 | 0.00% | 0.00% | 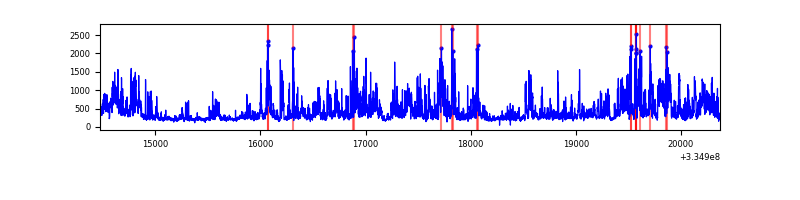 |
| D | 5899 | 5899 | 0 | 0 | 0.00% | 0.00% |  |
Top three noisy pixels from each quadrant. If the there are fewer than three noisy pixels in the level2.evt file, extra rows are filled as -1
| Pixel properties | Quadrant properties | ||||||
|---|---|---|---|---|---|---|---|
| Quadrant | DetID | PixID | Counts | Sigma | Mean | Median | Sigma |
| A | 0 | 29 | 336 | 10.74 | 86 | 81 | 23.8 |
| A | 0 | 30 | 251 | 7.16 | 86 | 81 | 23.8 |
| A | 14 | 95 | 250 | 7.11 | 86 | 81 | 23.8 |
| B | 2 | 9 | 278 | 10.14 | 84 | 80 | 19.5 |
| B | 5 | 225 | 230 | 7.68 | 84 | 80 | 19.5 |
| B | 2 | 8 | 228 | 7.58 | 84 | 80 | 19.5 |
| C | 9 | 209 | 230 | 6.75 | 82 | 77 | 22.7 |
| C | 3 | 235 | 222 | 6.4 | 82 | 77 | 22.7 |
| C | 3 | 126 | 215 | 6.09 | 82 | 77 | 22.7 |
| D | 7 | 3 | 217 | 6.07 | 81 | 73 | 23.7 |
| D | 4 | 160 | 206 | 5.61 | 81 | 73 | 23.7 |
| D | 12 | 235 | 201 | 5.39 | 81 | 73 | 23.7 |
Histogram calculated using DETX and DETY for each event in the final _common_clean file
| Quadrant A |  |
 |
Quadrant B |
|---|---|---|---|
| Quadrant D |  |
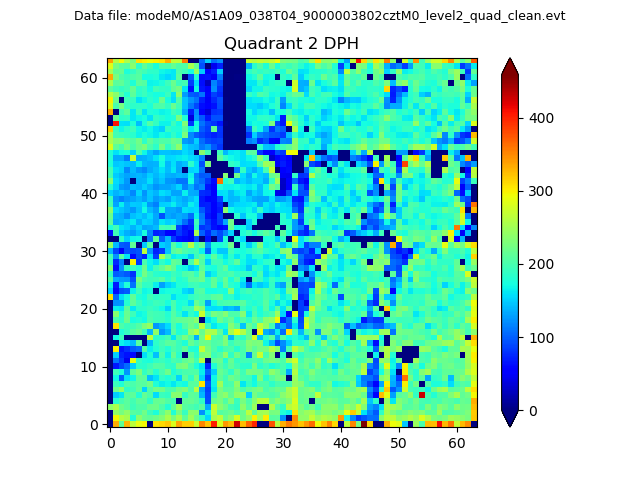 |
Quadrant C |
| Plot type | Count rate plots | Images |
|---|---|---|
| Comparison with Poisson distribution Blue bars denote a histogram of data divided into 1 sec bins. Red curve is a Poisson curve with rate = median count rate of data. |
 |
 |
| Quadrant-wise count rates Data is divided into 100 sec bins |
 |
|
| Module-wise count rates for Quadrant A Data is divided into 100 sec bins |
 |
 |
| Module-wise count rates for Quadrant B Data is divided into 100 sec bins |
 |
 |
| Module-wise count rates for Quadrant C Data is divided into 100 sec bins |
 |
 |
| Module-wise count rates for Quadrant D Data is divided into 100 sec bins |
 |
 |
| Parameter | Plot |
|---|---|
| CZT HV Monitor |  |
| D_VDD |  |
| Temperature 1 |  |
| Veto HV Monitor |  |
| Veto LLD |  |
| Alpha Counter |  |
| _CPM_Rate |  |
| CZT Counter |  |
| +2.5 Volts monitor |  |
| +5 Volts monitor |  |
| _ROLL_ROT |  |
| _Roll_DEC | 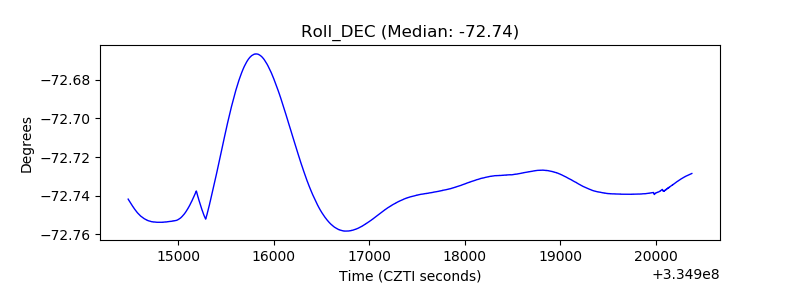 |
| _Roll_RA |  |
| Veto Counter |  |