| Param | Original file | Final file |
|---|---|---|
| Filename | modeM0/AS1A09_038T04_9000003802_26350cztM0_level2.evt | modeM0/AS1A09_038T04_9000003802_26350cztM0_level2_quad_clean.evt |
| Size (bytes) | 477,599,040 | 109,457,280 |
| Size | 455.5 MB | 104.4 MB |
| Events in quadrant A | 2,678,643 | 735,518 |
| Events in quadrant B | 2,769,169 | 748,114 |
| Events in quadrant C | 4,851,163 | 701,618 |
| Events in quadrant D | 3,764,570 | 717,325 |
| Mode M0 | |||
|---|---|---|---|
| Quadrant | BADHDUFLAG | Total packets | Discarded packets |
| A | 0 | 11995 | 0 |
| B | 0 | 12069 | 0 |
| C | 0 | 18374 | 0 |
| D | 0 | 15058 | 0 |
| Mode M9 | |||
|---|---|---|---|
| Quadrant | BADHDUFLAG | Total packets | Discarded packets |
| A | 0 | 1 | 0 |
| B | 0 | 1 | 0 |
| C | 0 | 1 | 0 |
| D | 0 | 1 | 0 |
| Quadrant | Total seconds | Saturated seconds | Saturation percentage |
|---|---|---|---|
| A | 5899 | 99 | 1.678251% |
| B | 5899 | 103 | 1.746059% |
| C | 5899 | 581 | 9.849127% |
| D | 5899 | 136 | 2.305476% |
Noise dominated data is calculated using 1-second bins in cleaned event files. If a bin has >2000 counts, and if more than 50% of those come from <1% of pixels, then it is considered to be noise-dominated and hence unusable.
| Quadrant | # 1 sec bins | Bins with >0 counts | Bins with >2000 counts | High rate bins dominated by noise | Noise dominated (total time) | Noise dominated (detector-on time) | Marked lightcurve |
|---|---|---|---|---|---|---|---|
| A | 5899 | 5899 | 0 | 0 | 0.00% | 0.00% | 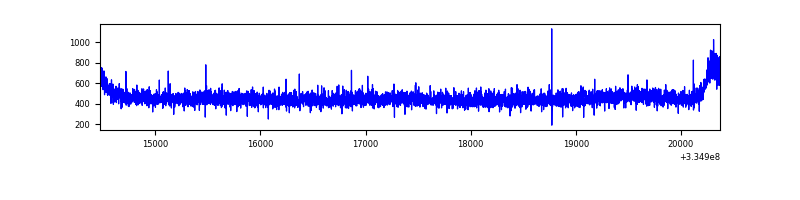 |
| B | 5899 | 5899 | 1 | 1 | 0.02% | 0.02% | 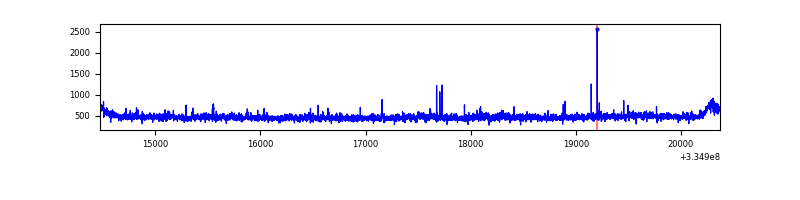 |
| C | 5899 | 5899 | 188 | 188 | 3.19% | 3.19% | 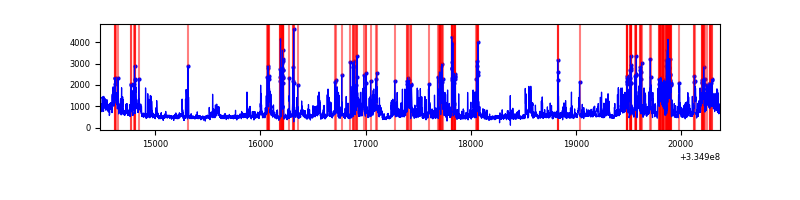 |
| D | 5899 | 5899 | 38 | 38 | 0.64% | 0.64% | 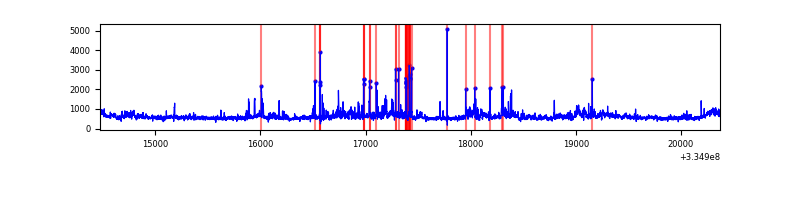 |
Top three noisy pixels from each quadrant. If the there are fewer than three noisy pixels in the level2.evt file, extra rows are filled as -1
| Pixel properties | Quadrant properties | ||||||
|---|---|---|---|---|---|---|---|
| Quadrant | DetID | PixID | Counts | Sigma | Mean | Median | Sigma |
| A | 13 | 254 | 9364 | 61.74 | 694 | 677 | 140.7 |
| A | 3 | 137 | 6532 | 41.61 | 694 | 677 | 140.7 |
| A | 0 | 226 | 5814 | 36.51 | 694 | 677 | 140.7 |
| B | 0 | 230 | 39845 | 292.34 | 693 | 673 | 134.0 |
| B | 12 | 111 | 16202 | 115.89 | 693 | 673 | 134.0 |
| B | 11 | 111 | 14431 | 102.67 | 693 | 673 | 134.0 |
| C | 3 | 233 | 2177870 | 14174.81 | 655 | 657 | 153.6 |
| C | 14 | 238 | 104117 | 673.58 | 655 | 657 | 153.6 |
| C | 0 | 239 | 8048 | 48.12 | 655 | 657 | 153.6 |
| D | 1 | 52 | 1120553 | 6953.51 | 678 | 660 | 161.1 |
| D | 2 | 234 | 27644 | 167.55 | 678 | 660 | 161.1 |
| D | 13 | 168 | 26531 | 160.64 | 678 | 660 | 161.1 |
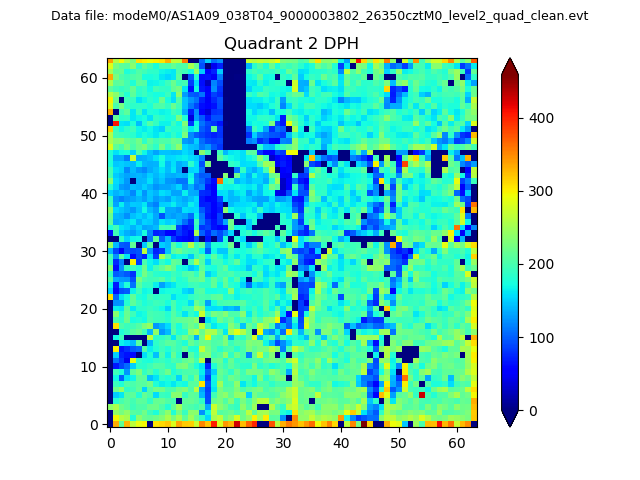
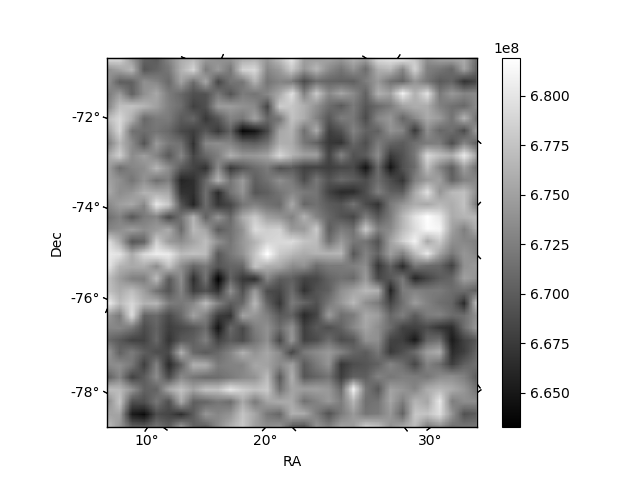
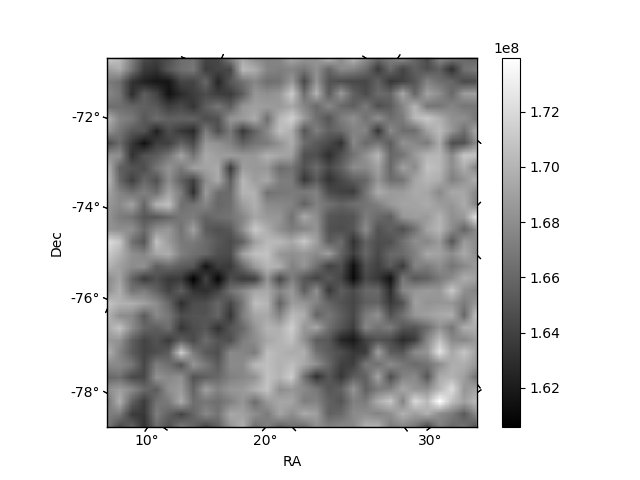
Histogram calculated using DETX and DETY for each event in the final _common_clean file
| Quadrant A | 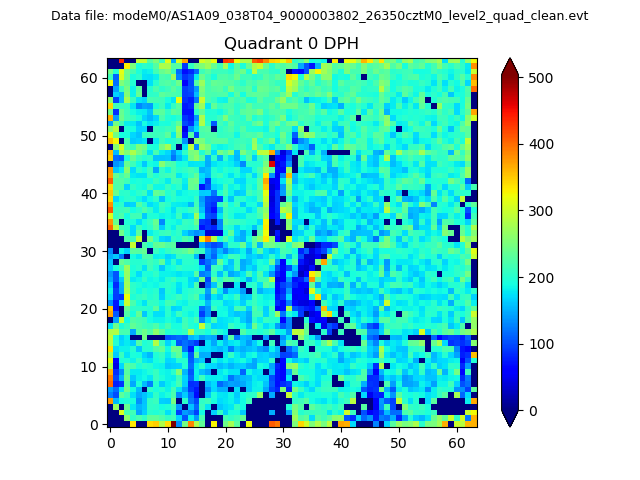 |
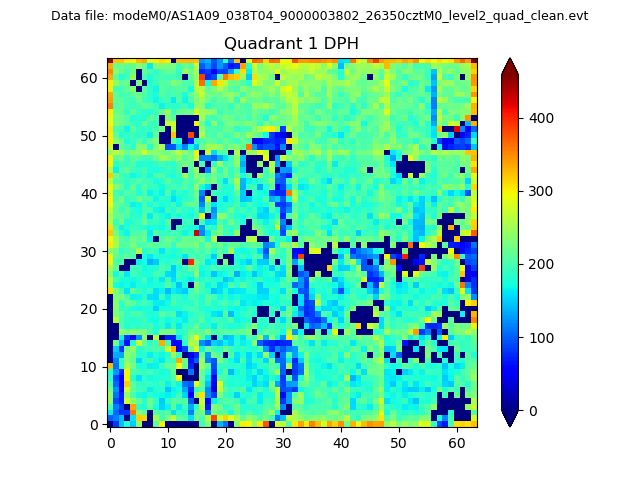 |
Quadrant B |
|---|---|---|---|
| Quadrant D | 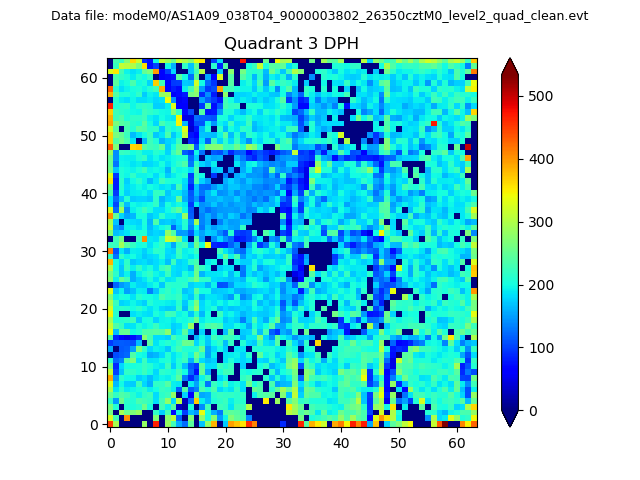 |
 |
Quadrant C |
| Plot type | Count rate plots | Images |
|---|---|---|
| Comparison with Poisson distribution Blue bars denote a histogram of data divided into 1 sec bins. Red curve is a Poisson curve with rate = median count rate of data. |
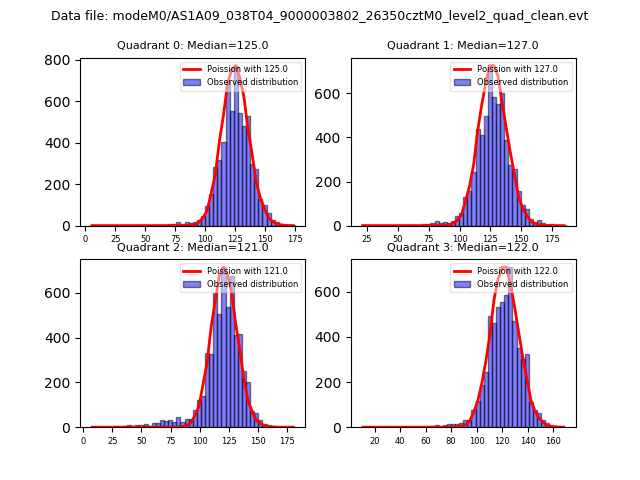 |
 |
| Quadrant-wise count rates Data is divided into 100 sec bins |
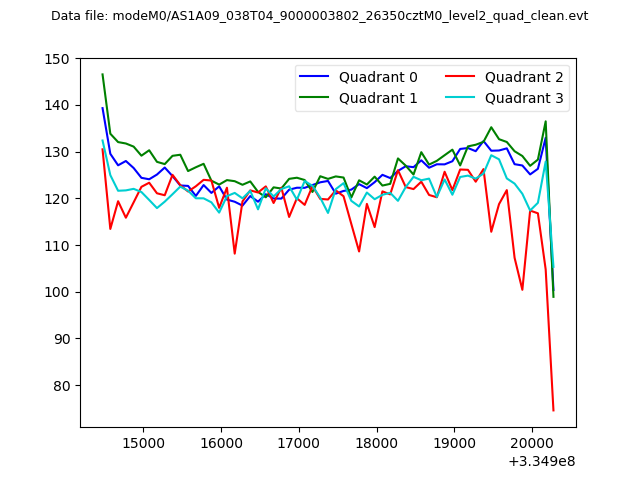 |
|
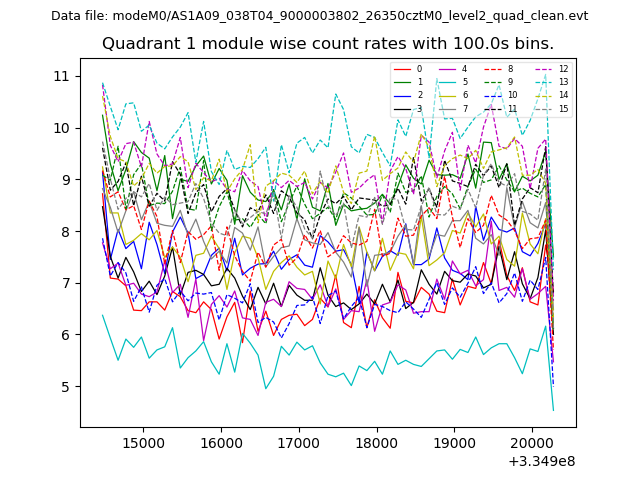
| Module-wise count rates for Quadrant A Data is divided into 100 sec bins |
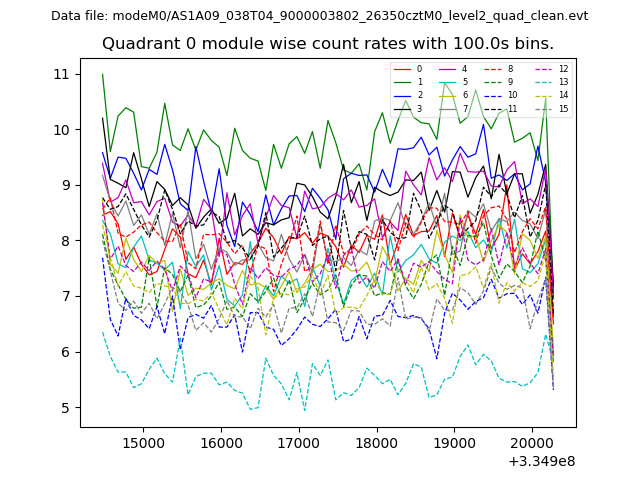 |
 |
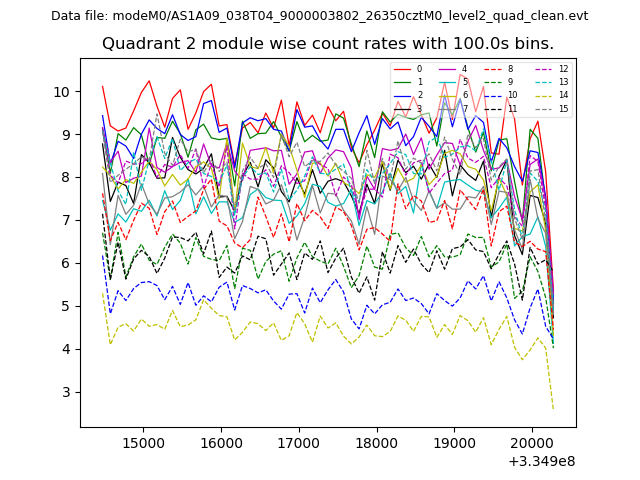
| Module-wise count rates for Quadrant B Data is divided into 100 sec bins |
 |
 |
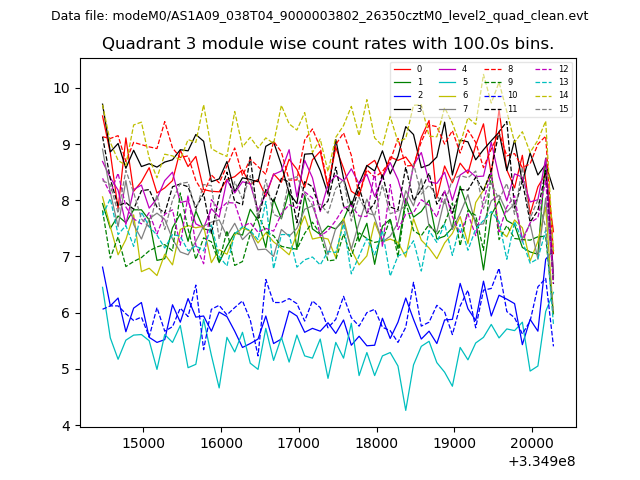
| Module-wise count rates for Quadrant C Data is divided into 100 sec bins |
 |
 |
| Module-wise count rates for Quadrant D Data is divided into 100 sec bins |
 |
 |
| Parameter | Plot |
|---|---|
| CZT HV Monitor | 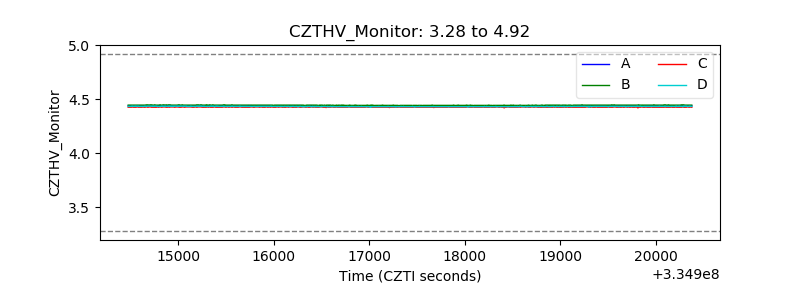 |
| D_VDD | 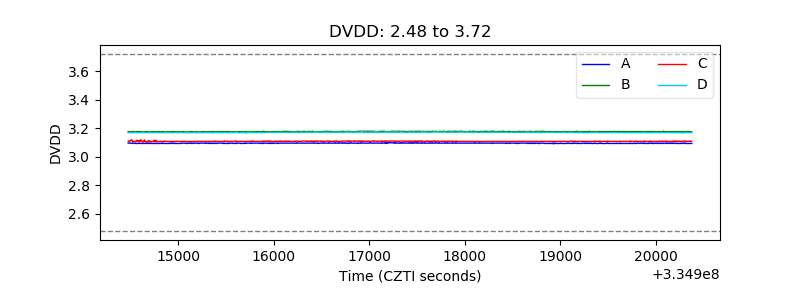 |
| Temperature 1 | 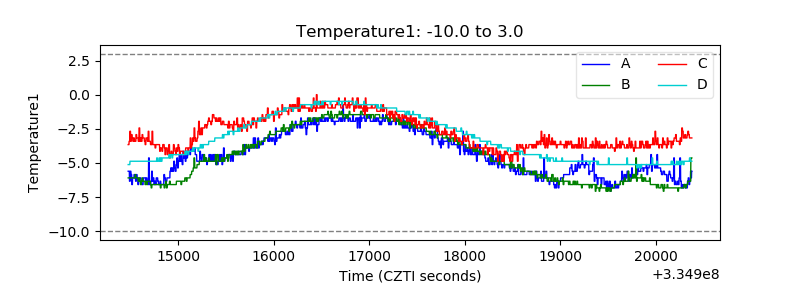 |
| Veto HV Monitor | 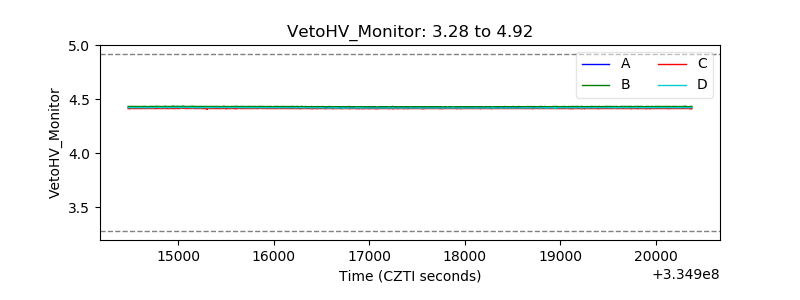 |
| Veto LLD | 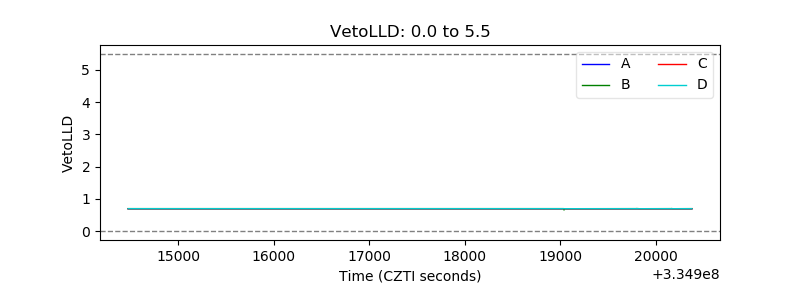 |
| Alpha Counter | 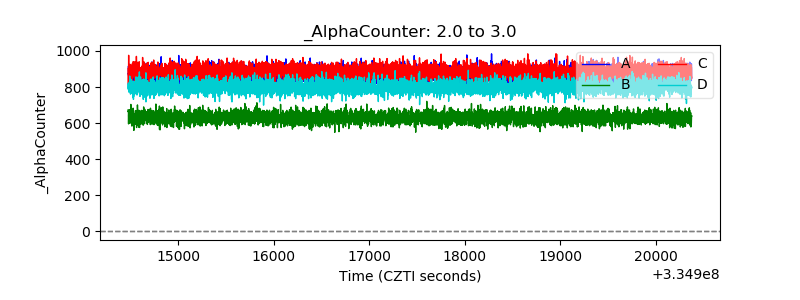 |
| _CPM_Rate | 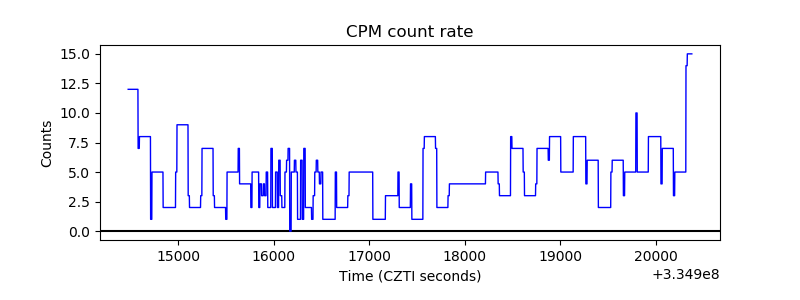 |
| CZT Counter | 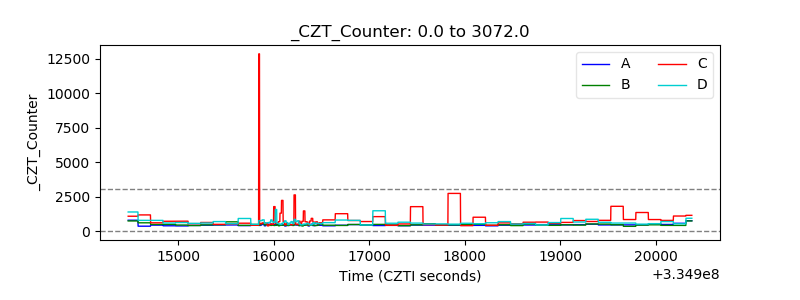 |
| +2.5 Volts monitor |  |
| +5 Volts monitor |  |
| _ROLL_ROT | 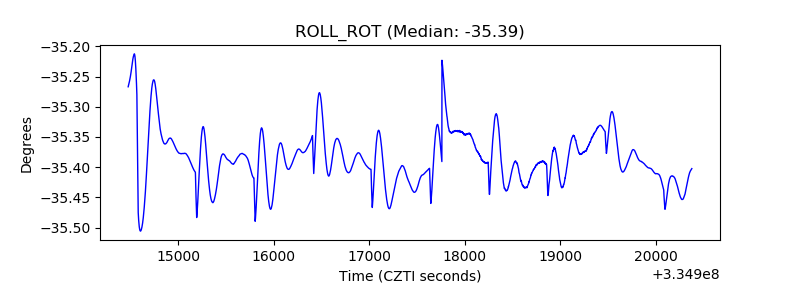 |
| _Roll_DEC |  |
| _Roll_RA | 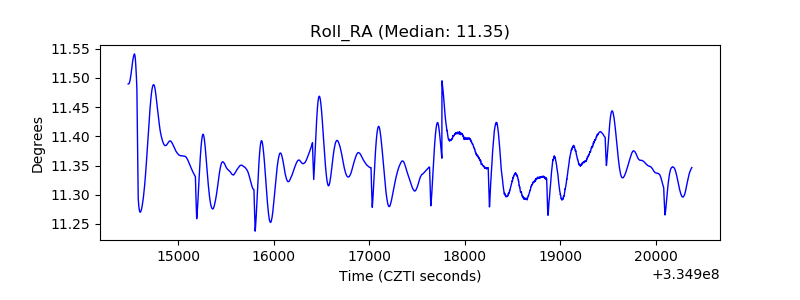 |
| Veto Counter |  |