| Param | Original file | Final file |
|---|---|---|
| Filename | modeM0/AS1A09_088T01_9000003808cztM0_level2.fits | modeM0/AS1A09_088T01_9000003808cztM0_level2_quad_clean.evt |
| Size (bytes) | 1,490,374,080 | 1,472,644,800 |
| Size | 1.4 GB | 1.4 GB |
| Events in quadrant A | 9,578,022 | 9,469,943 |
| Events in quadrant B | 9,238,274 | 9,640,738 |
| Events in quadrant C | 8,507,006 | 7,811,326 |
| Events in quadrant D | 7,247,692 | 7,136,897 |
| Mode M9 | |||
|---|---|---|---|
| Quadrant | BADHDUFLAG | Total packets | Discarded packets |
| A | 0 | 263 | 0 |
| B | 0 | 263 | 0 |
| C | 0 | 263 | 0 |
| D | 0 | 263 | 0 |
| Mode SS | |||
|---|---|---|---|
| Quadrant | BADHDUFLAG | Total packets | Discarded packets |
| A | 0 | 3138 | 0 |
| B | 0 | 3138 | 0 |
| C | 0 | 3138 | 0 |
| D | 0 | 3138 | 0 |
| Mode M0 | |||
|---|---|---|---|
| Quadrant | BADHDUFLAG | Total packets | Discarded packets |
| A | 0 | 329976 | 0 |
| B | 0 | 322311 | 0 |
| C | 0 | 554922 | 0 |
| D | 0 | 644889 | 0 |
| Quadrant | Total seconds | Saturated seconds | Saturation percentage |
|---|---|---|---|
| A | 153798 | 2326 | 1.512373% |
| B | 153798 | 1945 | 1.264646% |
| C | 153798 | 27896 | 18.138077% |
| D | 153798 | 34484 | 22.421618% |
Noise dominated data is calculated using 1-second bins in cleaned event files. If a bin has >2000 counts, and if more than 50% of those come from <1% of pixels, then it is considered to be noise-dominated and hence unusable.
| Quadrant | # 1 sec bins | Bins with >0 counts | Bins with >2000 counts | High rate bins dominated by noise | Noise dominated (total time) | Noise dominated (detector-on time) | Marked lightcurve |
|---|---|---|---|---|---|---|---|
| A | 180258 | 153784 | 0 | 0 | 0.00% | 0.00% |  |
| B | 180258 | 153789 | 0 | 0 | 0.00% | 0.00% |  |
| C | 180258 | 153625 | 0 | 0 | 0.00% | 0.00% |  |
| D | 180258 | 153168 | 0 | 0 | 0.00% | 0.00% |  |
Top three noisy pixels from each quadrant. If the there are fewer than three noisy pixels in the level2.evt file, extra rows are filled as -1
| Pixel properties | Quadrant properties | ||||||
|---|---|---|---|---|---|---|---|
| Quadrant | DetID | PixID | Counts | Sigma | Mean | Median | Sigma |
| A | 0 | 29 | 7827 | 8.92 | 2497 | 2351 | 613.6 |
| A | 7 | 110 | 7538 | 8.45 | 2497 | 2351 | 613.6 |
| A | 9 | 19 | 7274 | 8.02 | 2497 | 2351 | 613.6 |
| B | 2 | 9 | 7348 | 10.85 | 2441 | 2344 | 461.1 |
| B | 2 | 8 | 6105 | 8.16 | 2441 | 2344 | 461.1 |
| B | 5 | 128 | 6029 | 7.99 | 2441 | 2344 | 461.1 |
| C | 12 | 241 | 5998 | 6.85 | 2254 | 2122 | 566.1 |
| C | 9 | 209 | 5696 | 6.31 | 2254 | 2122 | 566.1 |
| C | 3 | 126 | 5640 | 6.21 | 2254 | 2122 | 566.1 |
| D | 3 | 14 | 5174 | 6.02 | 2066 | 1887 | 545.7 |
| D | 6 | 231 | 5162 | 6.0 | 2066 | 1887 | 545.7 |
| D | 15 | 46 | 5110 | 5.91 | 2066 | 1887 | 545.7 |
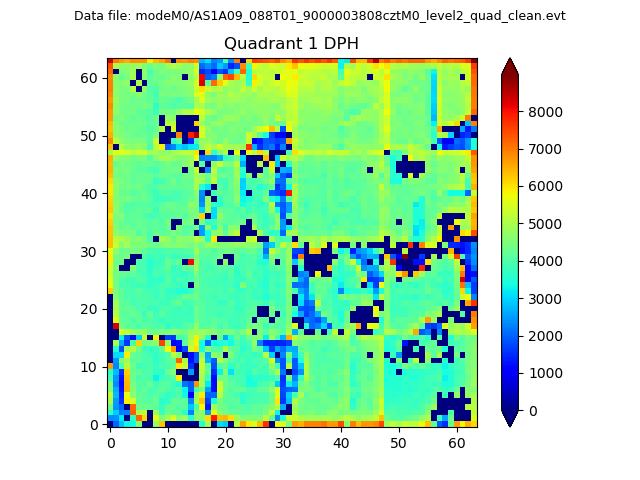
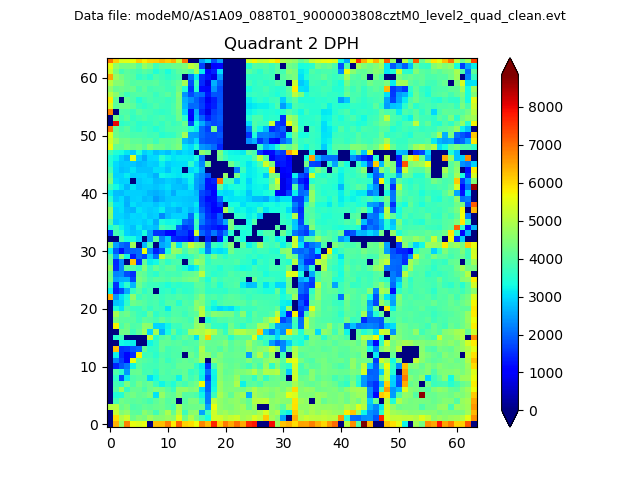
Histogram calculated using DETX and DETY for each event in the final _common_clean file
| Quadrant A |  |
 |
Quadrant B |
|---|---|---|---|
| Quadrant D |  |
 |
Quadrant C |
| Plot type | Count rate plots | Images |
|---|---|---|
| Comparison with Poisson distribution Blue bars denote a histogram of data divided into 1 sec bins. Red curve is a Poisson curve with rate = median count rate of data. |
 |
 |
| Quadrant-wise count rates Data is divided into 100 sec bins |
 |
|
| Module-wise count rates for Quadrant A Data is divided into 100 sec bins |
 |
 |
| Module-wise count rates for Quadrant B Data is divided into 100 sec bins |
 |
 |
| Module-wise count rates for Quadrant C Data is divided into 100 sec bins |
 |
 |
| Module-wise count rates for Quadrant D Data is divided into 100 sec bins |
 |
 |
| Parameter | Plot |
|---|---|
| CZT HV Monitor |  |
| D_VDD |  |
| Temperature 1 |  |
| Veto HV Monitor |  |
| Veto LLD |  |
| Alpha Counter |  |
| _CPM_Rate |  |
| CZT Counter |  |
| +2.5 Volts monitor |  |
| +5 Volts monitor |  |
| _ROLL_ROT |  |
| _Roll_DEC |  |
| _Roll_RA |  |
| Veto Counter |  |