| Param | Original file | Final file |
|---|---|---|
| Filename | modeM0/AS1A09_088T01_9000003808_26356cztM0_level2.evt | modeM0/AS1A09_088T01_9000003808_26356cztM0_level2_quad_clean.evt |
| Size (bytes) | 198,417,600 | 31,495,680 |
| Size | 189.2 MB | 30.0 MB |
| Events in quadrant A | 1,299,794 | 197,528 |
| Events in quadrant B | 1,307,655 | 204,009 |
| Events in quadrant C | 1,767,770 | 191,196 |
| Events in quadrant D | 1,474,047 | 192,966 |
| Mode M9 | |||
|---|---|---|---|
| Quadrant | BADHDUFLAG | Total packets | Discarded packets |
| A | 0 | 12 | 0 |
| B | 0 | 12 | 0 |
| C | 0 | 12 | 0 |
| D | 0 | 12 | 0 |
| Mode M0 | |||
|---|---|---|---|
| Quadrant | BADHDUFLAG | Total packets | Discarded packets |
| A | 0 | 5391 | 0 |
| B | 0 | 5350 | 0 |
| C | 0 | 6858 | 0 |
| D | 0 | 5884 | 0 |
| Quadrant | Total seconds | Saturated seconds | Saturation percentage |
|---|---|---|---|
| A | 2326 | 40 | 1.719690% |
| B | 2326 | 50 | 2.149613% |
| C | 2326 | 128 | 5.503009% |
| D | 2326 | 58 | 2.493551% |
Noise dominated data is calculated using 1-second bins in cleaned event files. If a bin has >2000 counts, and if more than 50% of those come from <1% of pixels, then it is considered to be noise-dominated and hence unusable.
| Quadrant | # 1 sec bins | Bins with >0 counts | Bins with >2000 counts | High rate bins dominated by noise | Noise dominated (total time) | Noise dominated (detector-on time) | Marked lightcurve |
|---|---|---|---|---|---|---|---|
| A | 3531 | 2327 | 5 | 5 | 0.14% | 0.21% | 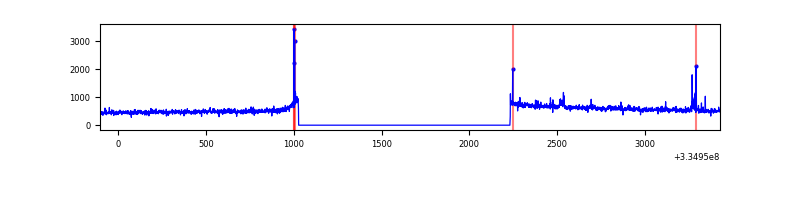 |
| B | 3531 | 2327 | 4 | 4 | 0.11% | 0.17% | 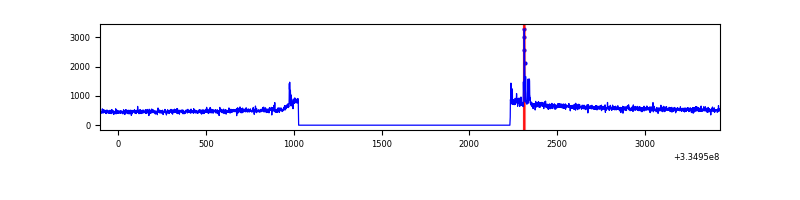 |
| C | 3531 | 2327 | 18 | 18 | 0.51% | 0.77% | 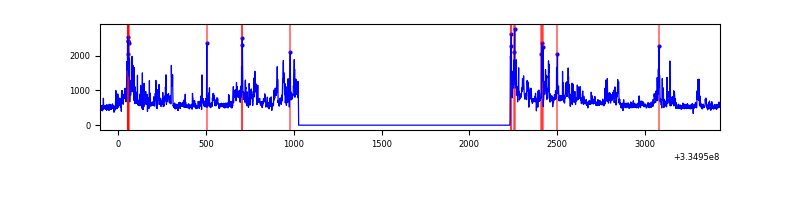 |
| D | 3531 | 2327 | 21 | 21 | 0.59% | 0.90% | 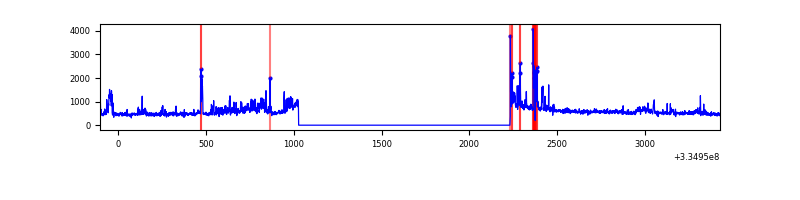 |
Top three noisy pixels from each quadrant. If the there are fewer than three noisy pixels in the level2.evt file, extra rows are filled as -1
| Pixel properties | Quadrant properties | ||||||
|---|---|---|---|---|---|---|---|
| Quadrant | DetID | PixID | Counts | Sigma | Mean | Median | Sigma |
| A | 0 | 13 | 38004 | 572.03 | 327 | 320 | 65.9 |
| A | 13 | 254 | 3760 | 52.22 | 327 | 320 | 65.9 |
| A | 0 | 226 | 2919 | 39.45 | 327 | 320 | 65.9 |
| B | 5 | 172 | 29921 | 472.79 | 325 | 318 | 62.6 |
| B | 0 | 230 | 12558 | 195.49 | 325 | 318 | 62.6 |
| B | 12 | 111 | 6838 | 104.13 | 325 | 318 | 62.6 |
| C | 3 | 233 | 474990 | 6630.66 | 308 | 309 | 71.6 |
| C | 14 | 238 | 49867 | 692.25 | 308 | 309 | 71.6 |
| C | 2 | 16 | 26918 | 371.69 | 308 | 309 | 71.6 |
| D | 1 | 52 | 154692 | 2034.07 | 315 | 306 | 75.9 |
| D | 7 | 80 | 117833 | 1548.45 | 315 | 306 | 75.9 |
| D | 2 | 234 | 10158 | 129.8 | 315 | 306 | 75.9 |
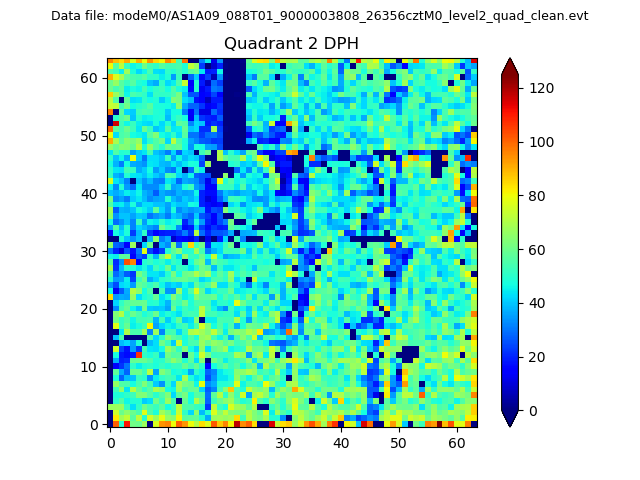
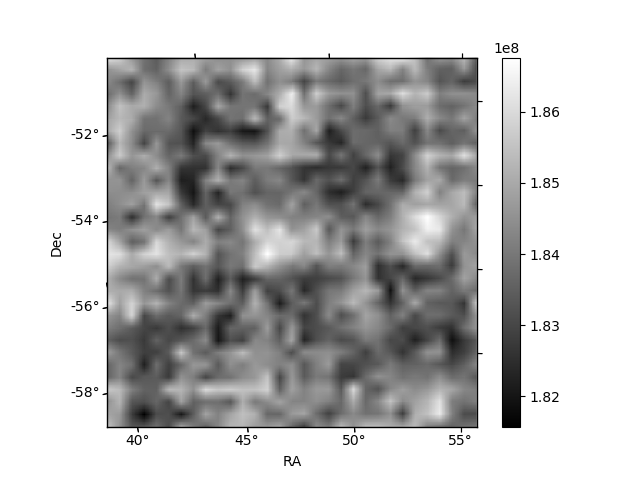
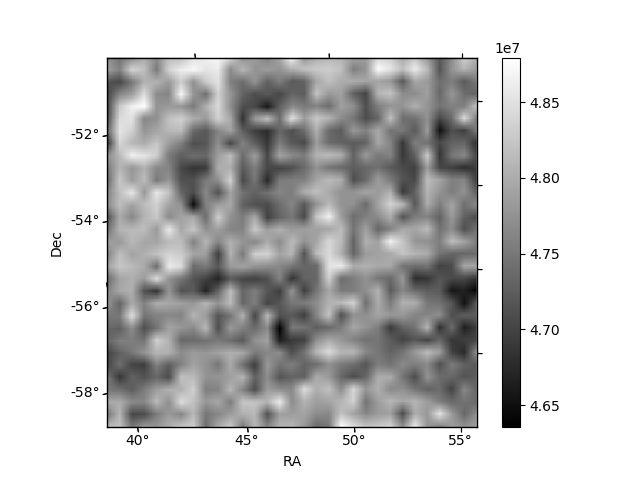
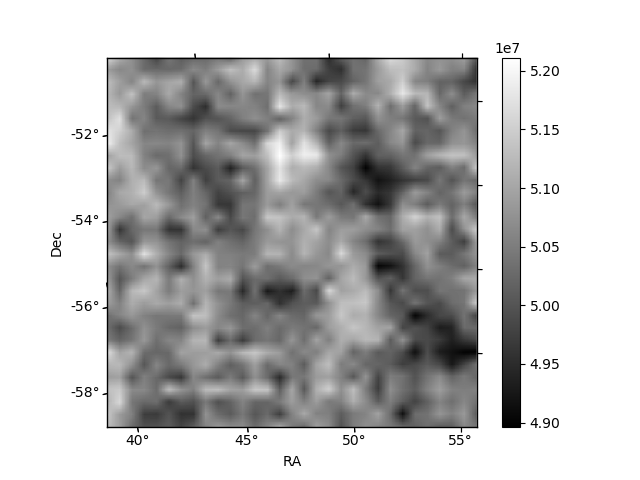
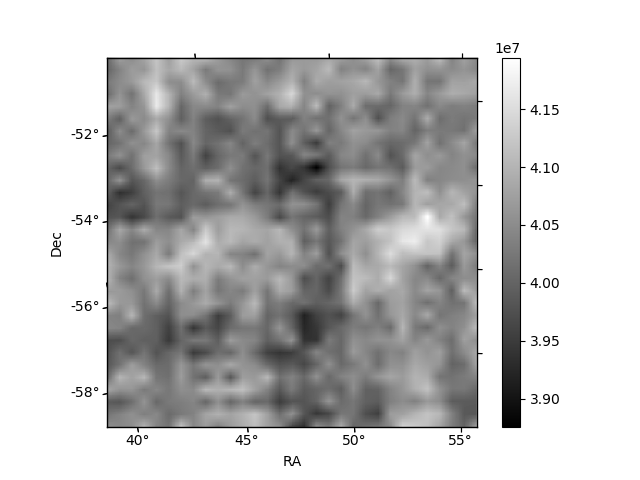
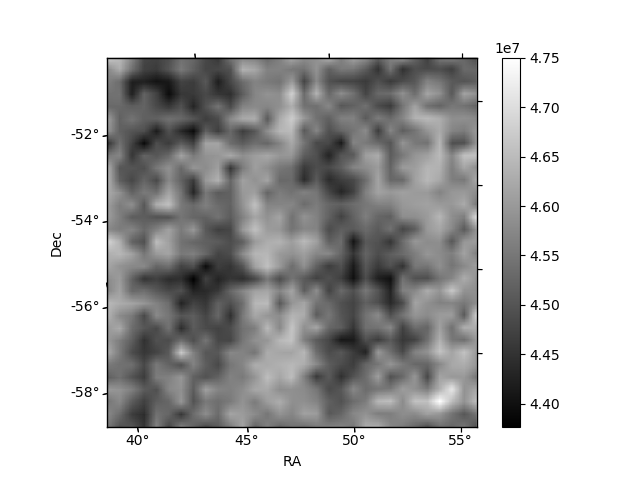
Histogram calculated using DETX and DETY for each event in the final _common_clean file
| Quadrant A | 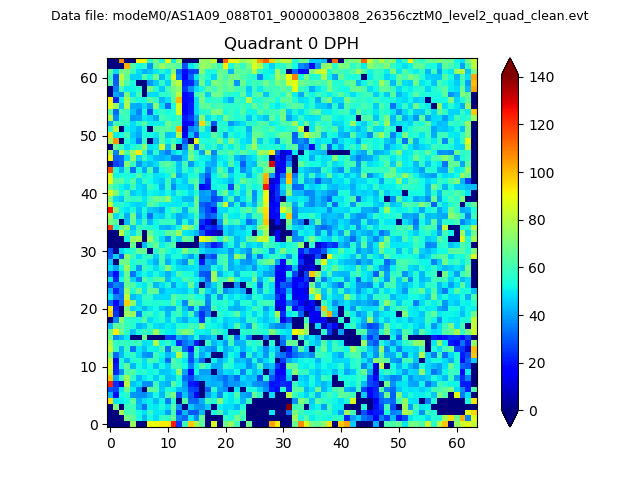 |
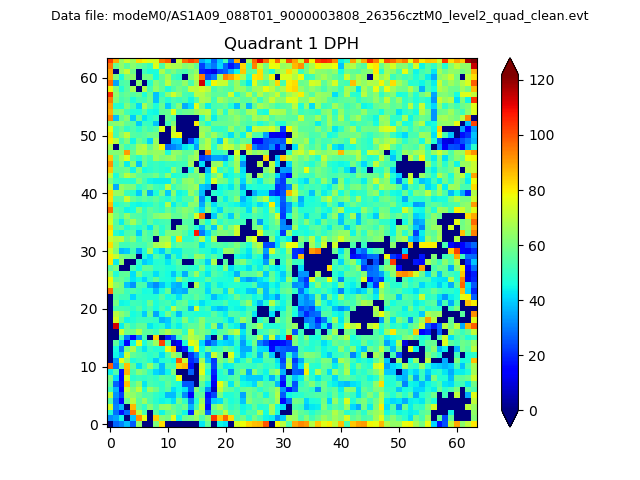 |
Quadrant B |
|---|---|---|---|
| Quadrant D | 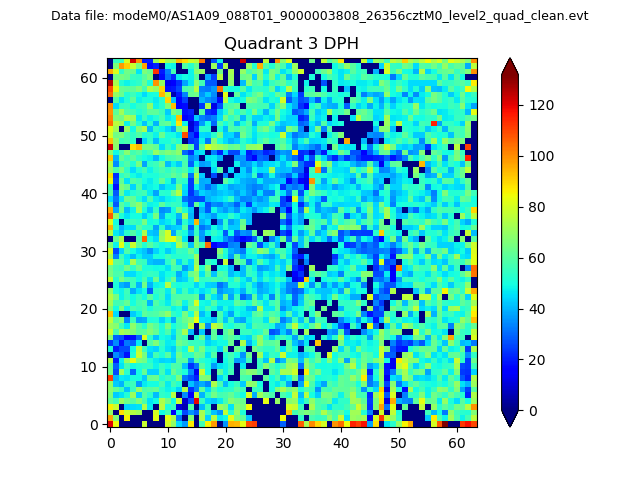 |
 |
Quadrant C |
| Plot type | Count rate plots | Images |
|---|---|---|
| Comparison with Poisson distribution Blue bars denote a histogram of data divided into 1 sec bins. Red curve is a Poisson curve with rate = median count rate of data. |
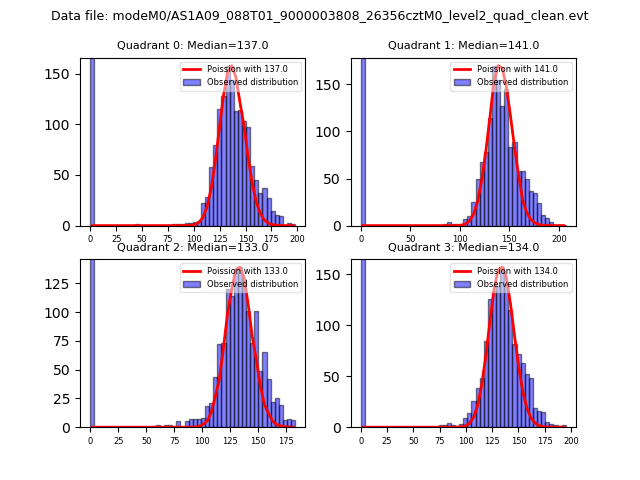 |
 |
| Quadrant-wise count rates Data is divided into 100 sec bins |
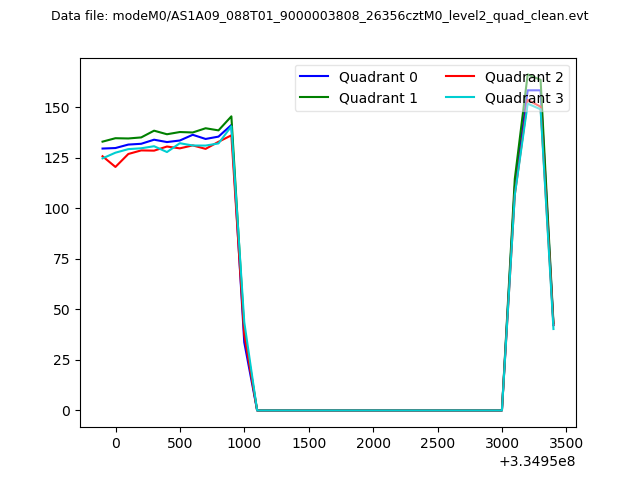 |
|
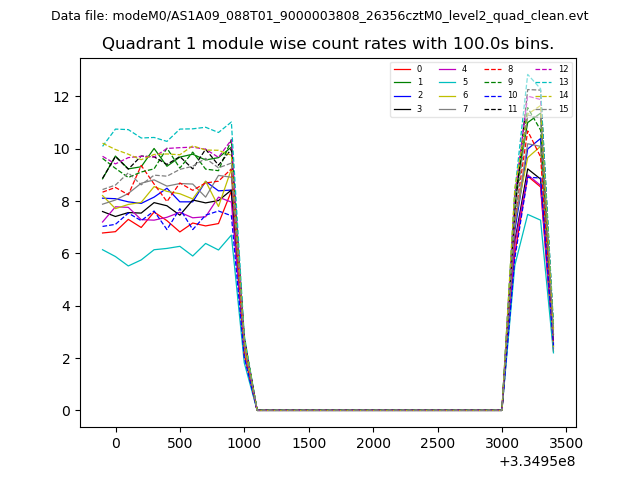
| Module-wise count rates for Quadrant A Data is divided into 100 sec bins |
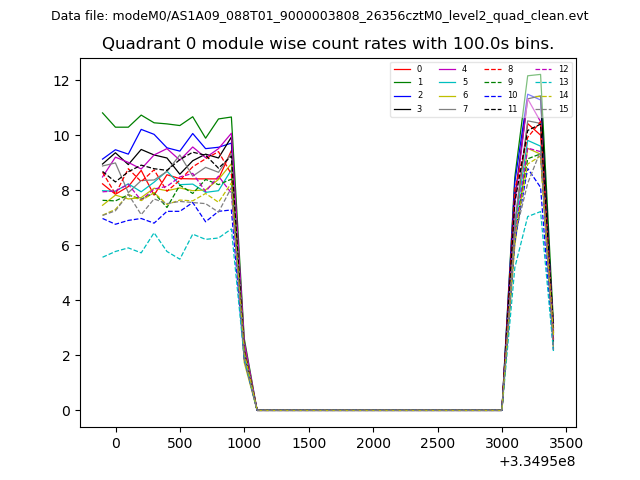 |
 |
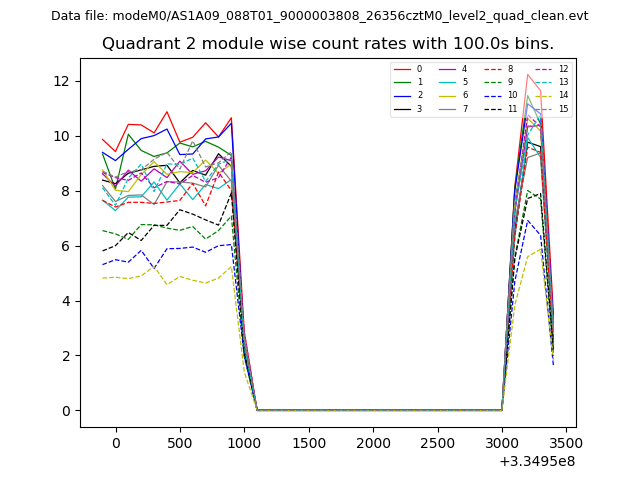
| Module-wise count rates for Quadrant B Data is divided into 100 sec bins |
 |
 |
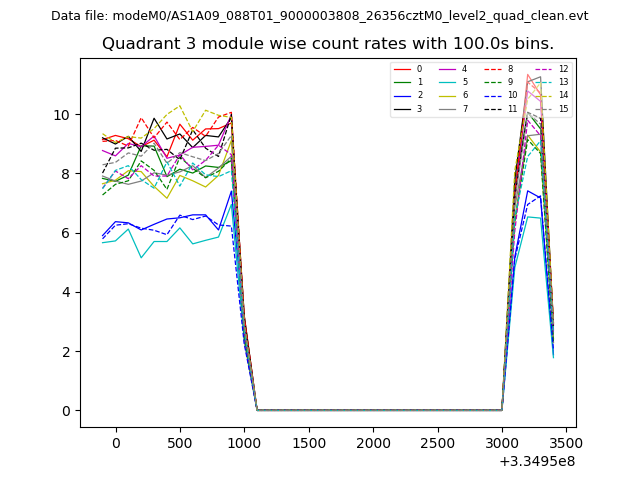
| Module-wise count rates for Quadrant C Data is divided into 100 sec bins |
 |
 |
| Module-wise count rates for Quadrant D Data is divided into 100 sec bins |
 |
 |
| Parameter | Plot |
|---|---|
| CZT HV Monitor | 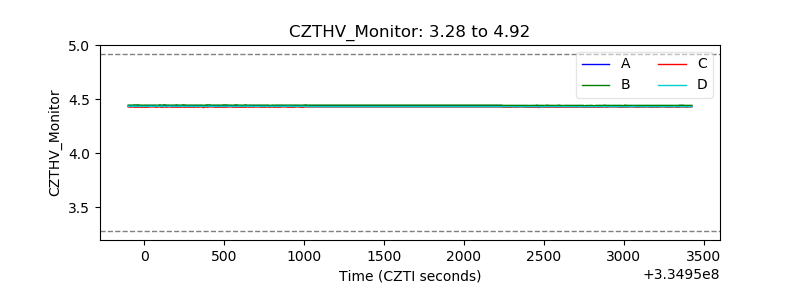 |
| D_VDD | 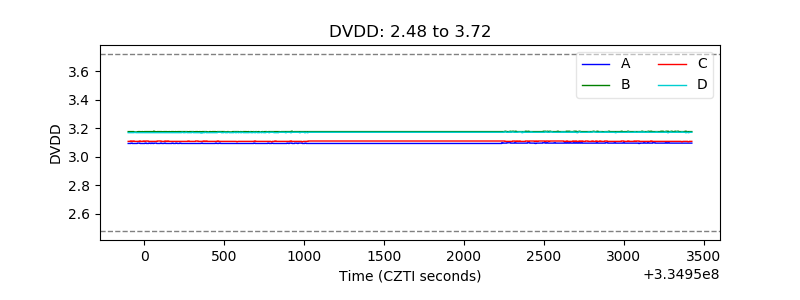 |
| Temperature 1 | 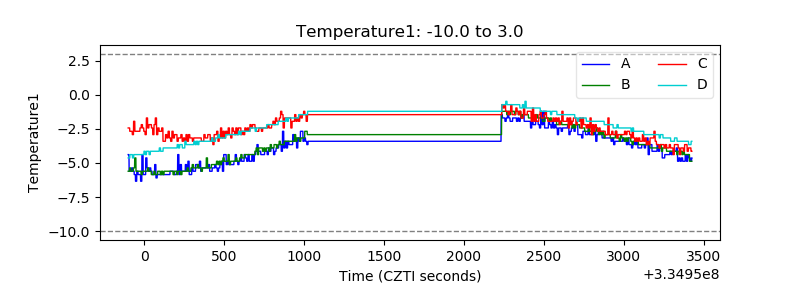 |
| Veto HV Monitor | 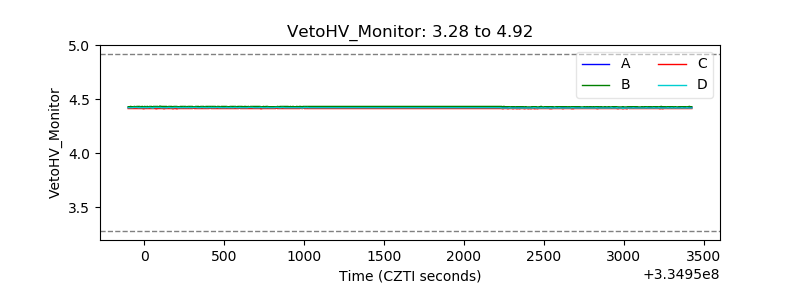 |
| Veto LLD | 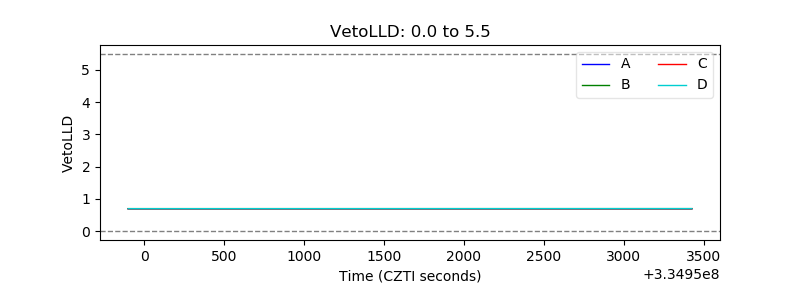 |
| Alpha Counter | 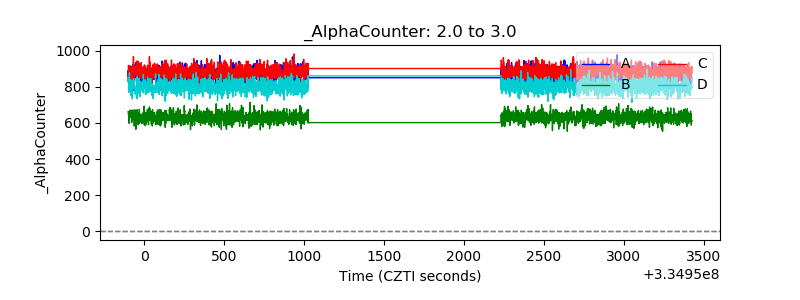 |
| _CPM_Rate | 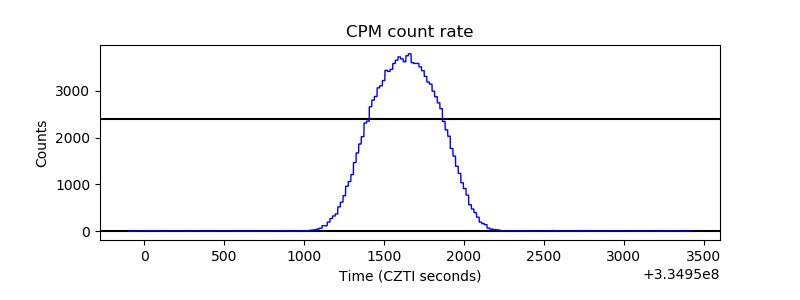 |
| CZT Counter | 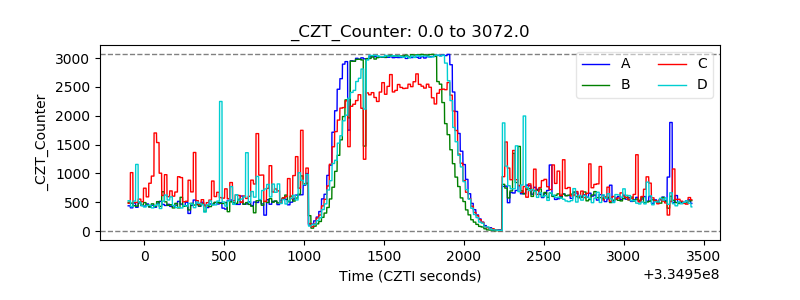 |
| +2.5 Volts monitor |  |
| +5 Volts monitor | 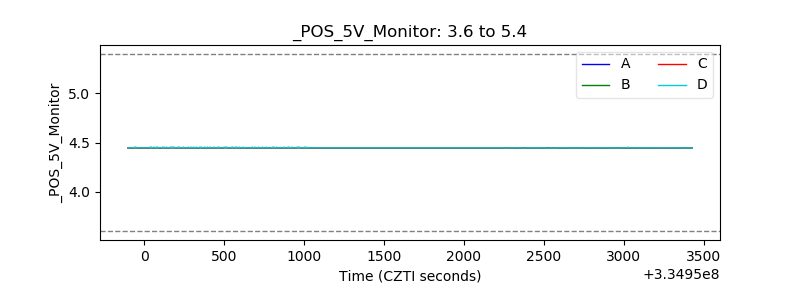 |
| _ROLL_ROT | 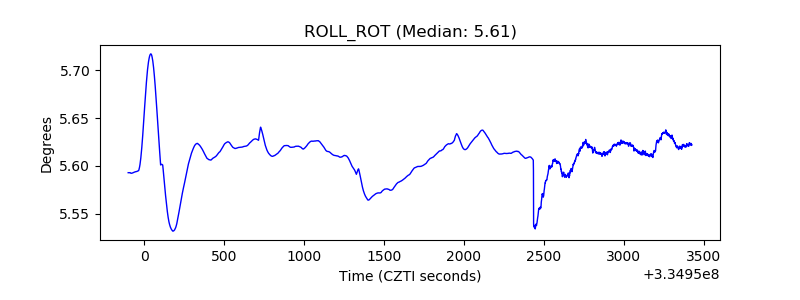 |
| _Roll_DEC | 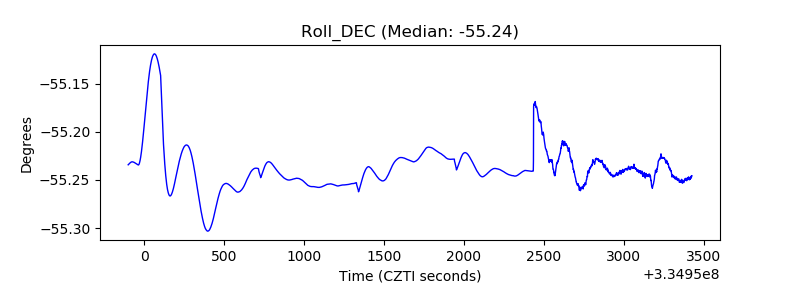 |
| _Roll_RA | 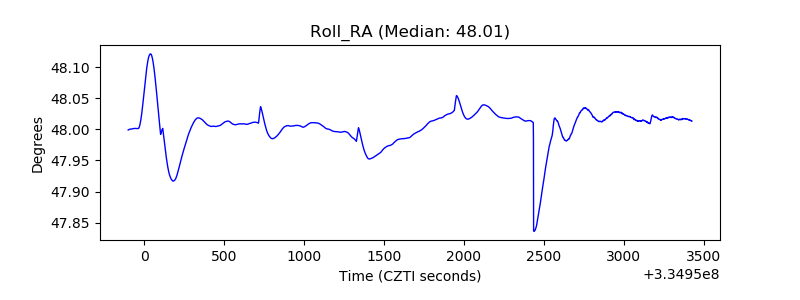 |
| Veto Counter | 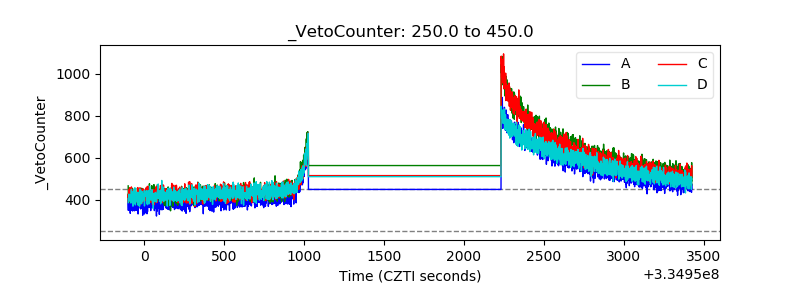 |