| Param | Original file | Final file |
|---|---|---|
| Filename | modeM0/AS1A09_088T01_9000003808_26357cztM0_level2.evt | modeM0/AS1A09_088T01_9000003808_26357cztM0_level2_quad_clean.evt |
| Size (bytes) | 536,276,160 | 105,232,320 |
| Size | 511.4 MB | 100.4 MB |
| Events in quadrant A | 3,341,482 | 703,159 |
| Events in quadrant B | 3,494,409 | 723,119 |
| Events in quadrant C | 3,628,580 | 678,536 |
| Events in quadrant D | 5,356,353 | 649,219 |
| Mode M9 | |||
|---|---|---|---|
| Quadrant | BADHDUFLAG | Total packets | Discarded packets |
| A | 0 | 14 | 0 |
| B | 0 | 15 | 0 |
| C | 0 | 15 | 0 |
| D | 0 | 15 | 0 |
| Mode M0 | |||
|---|---|---|---|
| Quadrant | BADHDUFLAG | Total packets | Discarded packets |
| A | 0 | 13984 | 0 |
| B | 0 | 14316 | 0 |
| C | 0 | 14665 | 0 |
| D | 0 | 20115 | 0 |
| Quadrant | Total seconds | Saturated seconds | Saturation percentage |
|---|---|---|---|
| A | 6203 | 46 | 0.741577% |
| B | 6203 | 141 | 2.273094% |
| C | 6203 | 96 | 1.547638% |
| D | 6202 | 623 | 10.045147% |
Noise dominated data is calculated using 1-second bins in cleaned event files. If a bin has >2000 counts, and if more than 50% of those come from <1% of pixels, then it is considered to be noise-dominated and hence unusable.
| Quadrant | # 1 sec bins | Bins with >0 counts | Bins with >2000 counts | High rate bins dominated by noise | Noise dominated (total time) | Noise dominated (detector-on time) | Marked lightcurve |
|---|---|---|---|---|---|---|---|
| A | 7503 | 6204 | 12 | 12 | 0.16% | 0.19% | 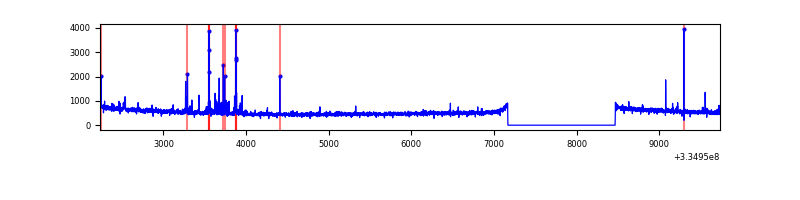 |
| B | 7503 | 6204 | 40 | 40 | 0.53% | 0.64% | 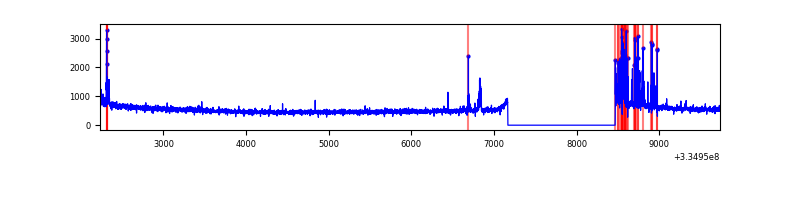 |
| C | 7503 | 6204 | 15 | 15 | 0.20% | 0.24% | 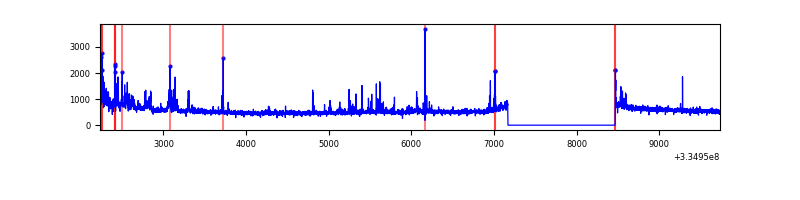 |
| D | 7502 | 6203 | 455 | 455 | 6.07% | 7.34% | 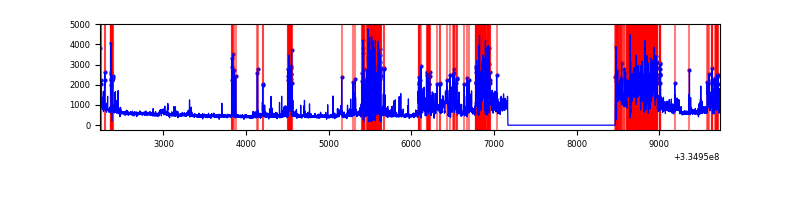 |
Top three noisy pixels from each quadrant. If the there are fewer than three noisy pixels in the level2.evt file, extra rows are filled as -1
| Pixel properties | Quadrant properties | ||||||
|---|---|---|---|---|---|---|---|
| Quadrant | DetID | PixID | Counts | Sigma | Mean | Median | Sigma |
| A | 0 | 13 | 130148 | 794.9 | 832 | 819 | 162.7 |
| A | 13 | 254 | 11106 | 63.23 | 832 | 819 | 162.7 |
| A | 0 | 226 | 7225 | 39.37 | 832 | 819 | 162.7 |
| B | 5 | 172 | 218892 | 1425.17 | 829 | 810 | 153.0 |
| B | 0 | 230 | 51750 | 332.89 | 829 | 810 | 153.0 |
| B | 12 | 111 | 17266 | 107.54 | 829 | 810 | 153.0 |
| C | 3 | 233 | 332961 | 1841.49 | 792 | 801 | 180.4 |
| C | 14 | 238 | 128974 | 710.59 | 792 | 801 | 180.4 |
| C | 2 | 16 | 58094 | 317.63 | 792 | 801 | 180.4 |
| D | 7 | 80 | 1888016 | 10264.11 | 771 | 751 | 183.9 |
| D | 1 | 52 | 450959 | 2448.51 | 771 | 751 | 183.9 |
| D | 8 | 195 | 35183 | 187.26 | 771 | 751 | 183.9 |
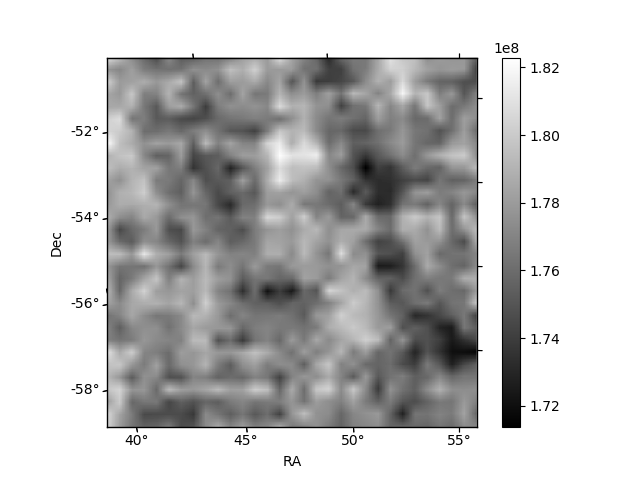
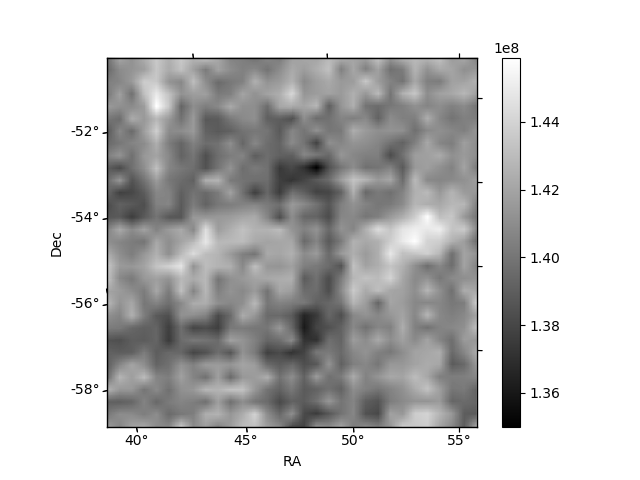
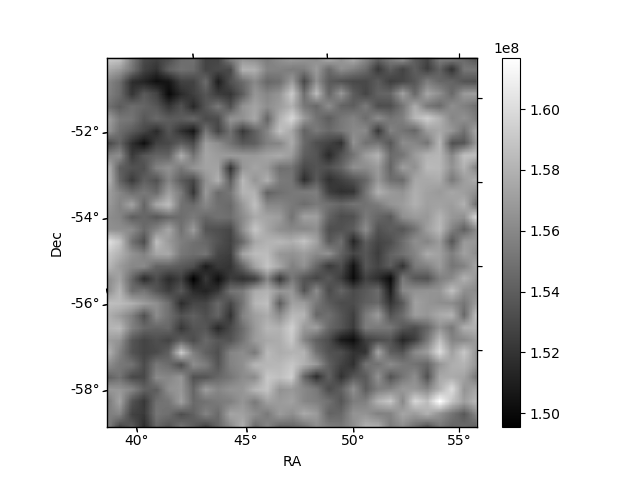
Histogram calculated using DETX and DETY for each event in the final _common_clean file
| Quadrant A | 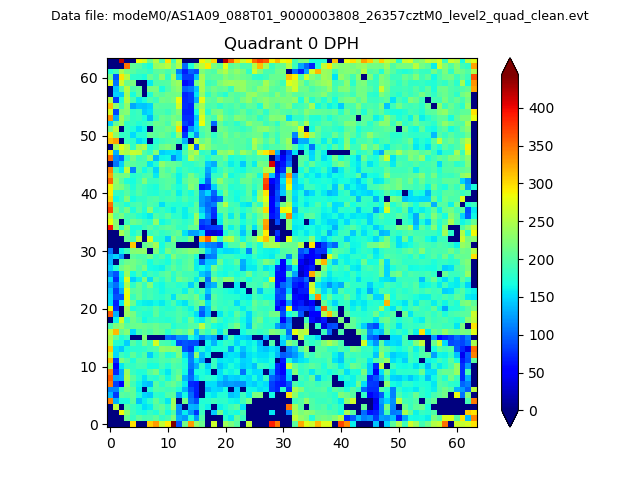 |
 |
Quadrant B |
|---|---|---|---|
| Quadrant D | 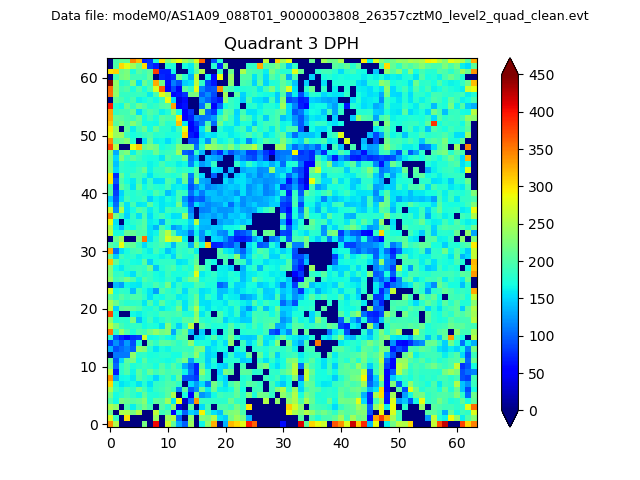 |
 |
Quadrant C |
| Plot type | Count rate plots | Images |
|---|---|---|
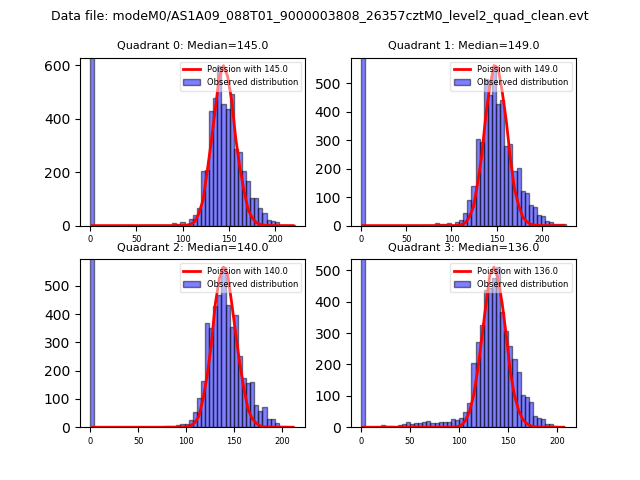
| Comparison with Poisson distribution Blue bars denote a histogram of data divided into 1 sec bins. Red curve is a Poisson curve with rate = median count rate of data. |
 |
 |
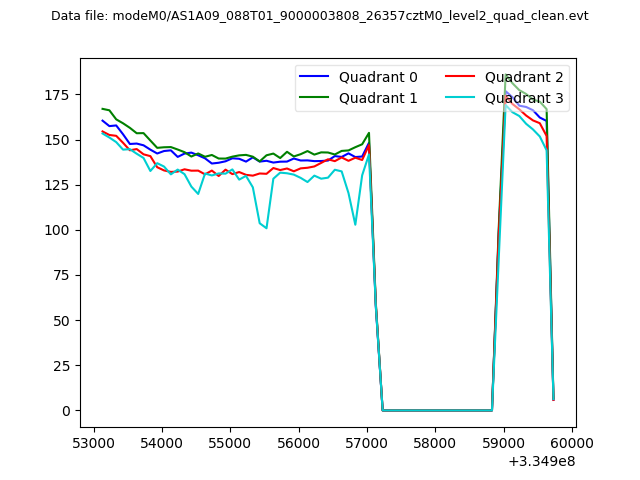
| Quadrant-wise count rates Data is divided into 100 sec bins |
 |
|
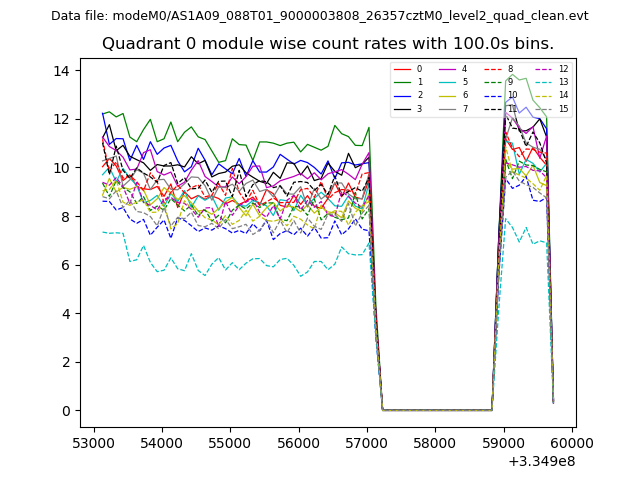
| Module-wise count rates for Quadrant A Data is divided into 100 sec bins |
 |
 |
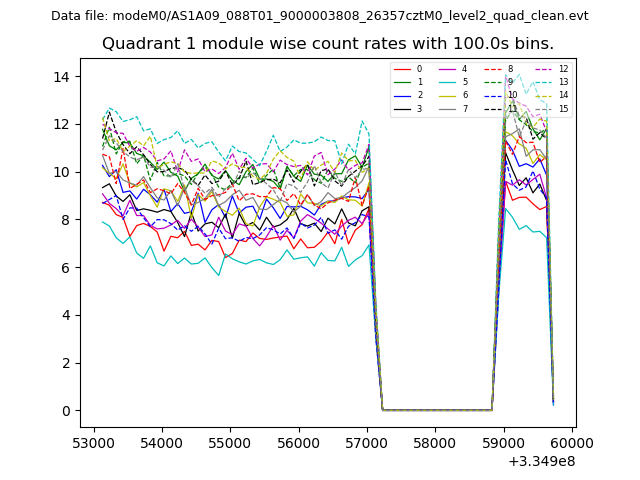
| Module-wise count rates for Quadrant B Data is divided into 100 sec bins |
 |
 |
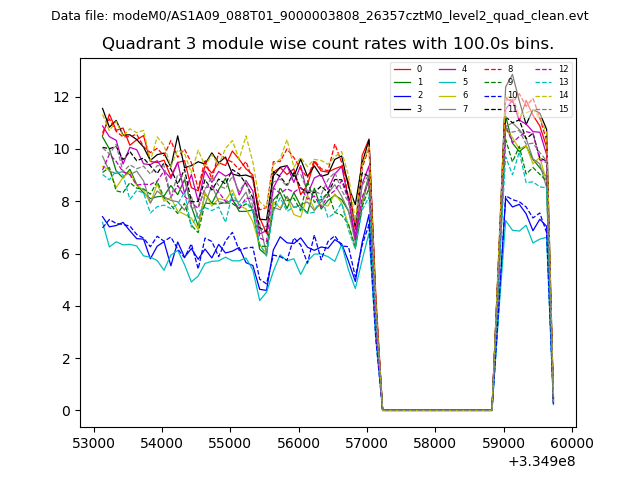
| Module-wise count rates for Quadrant C Data is divided into 100 sec bins |
 |
 |
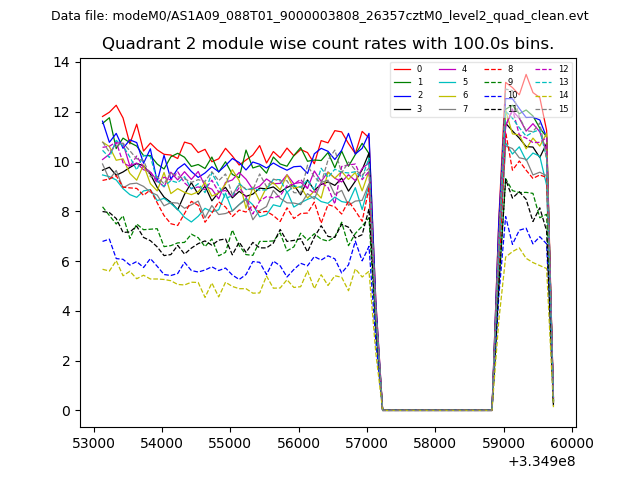
| Module-wise count rates for Quadrant D Data is divided into 100 sec bins |
 |
 |
| Parameter | Plot |
|---|---|
| CZT HV Monitor |  |
| D_VDD | 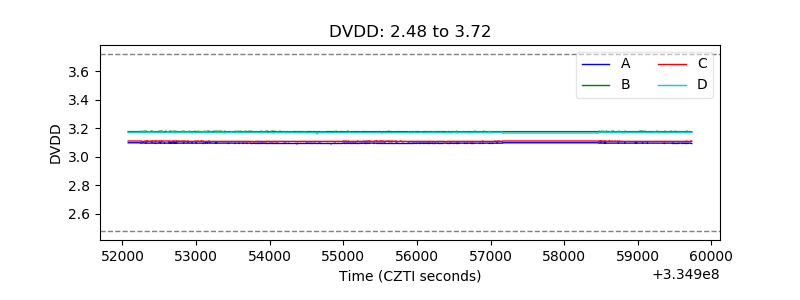 |
| Temperature 1 | 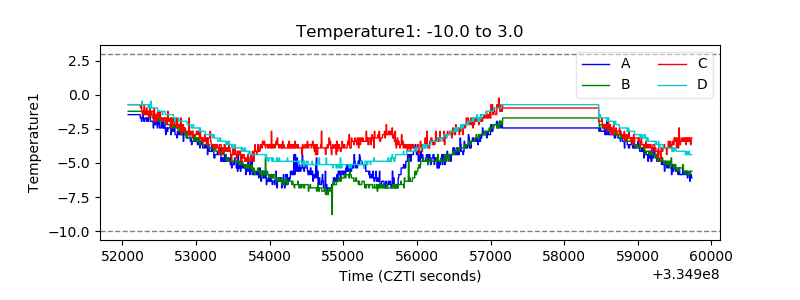 |
| Veto HV Monitor | 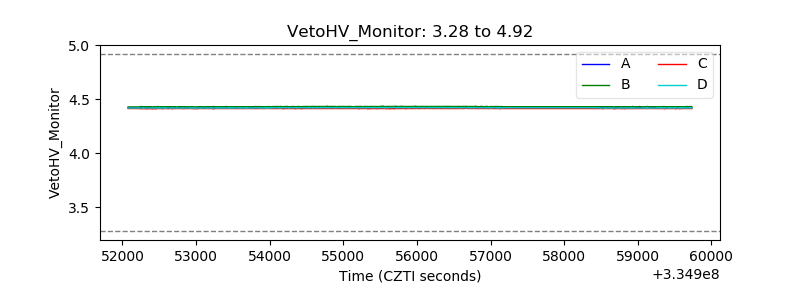 |
| Veto LLD | 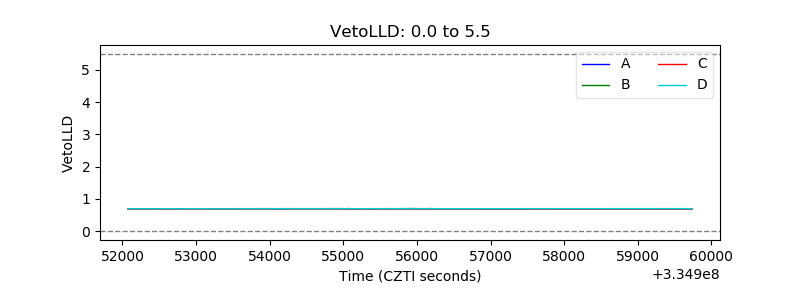 |
| Alpha Counter | 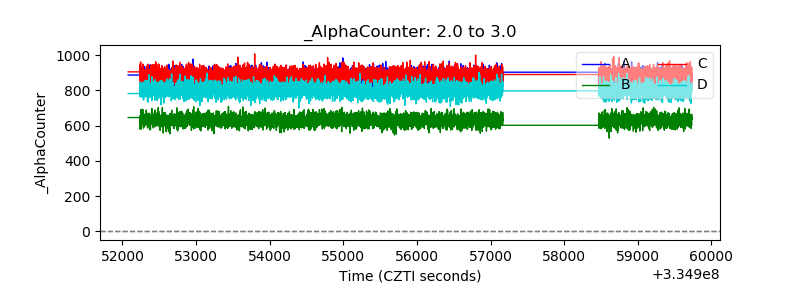 |
| _CPM_Rate | 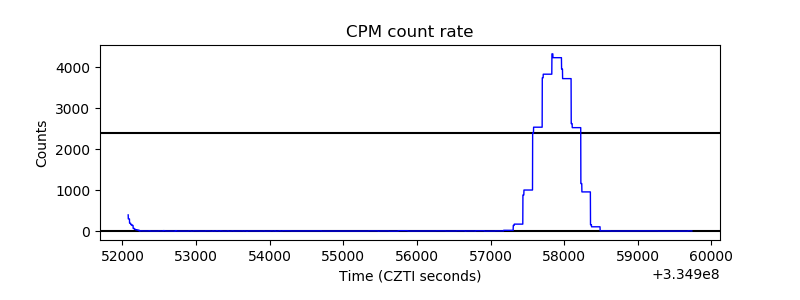 |
| CZT Counter | 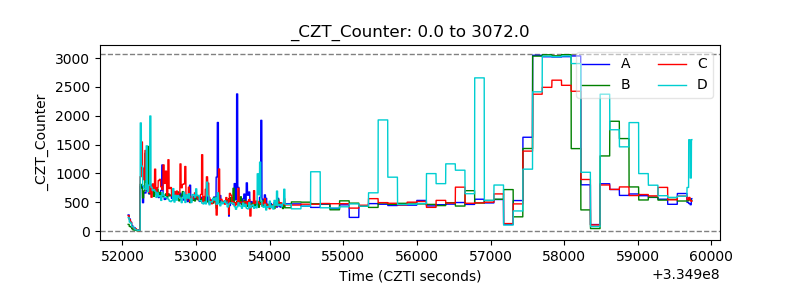 |
| +2.5 Volts monitor |  |
| +5 Volts monitor |  |
| _ROLL_ROT | 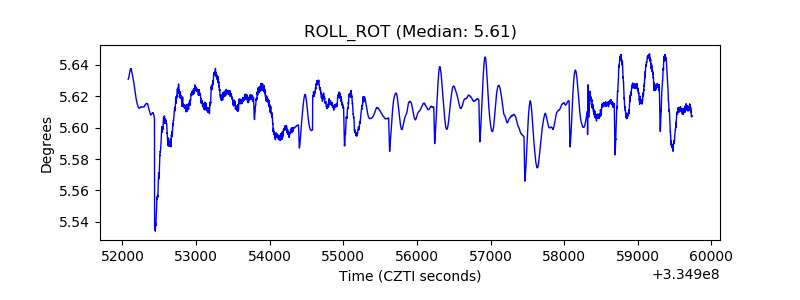 |
| _Roll_DEC | 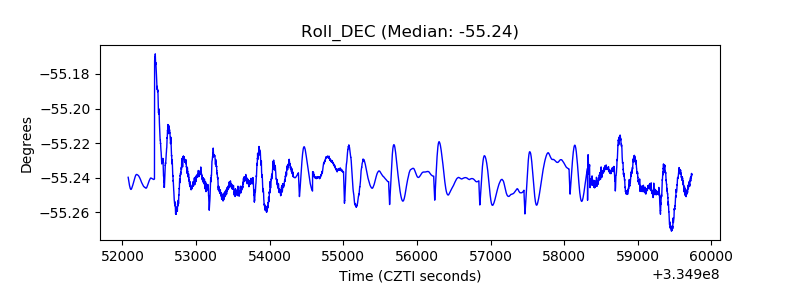 |
| _Roll_RA | 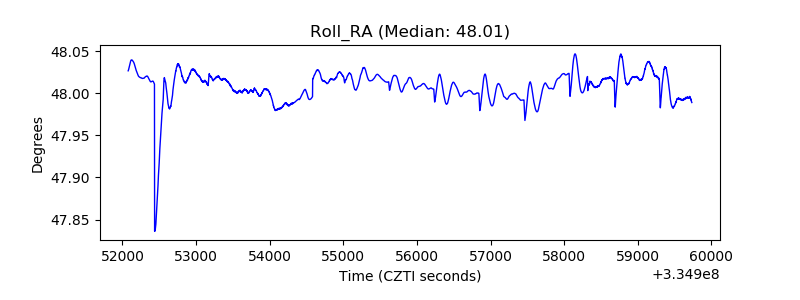 |
| Veto Counter | 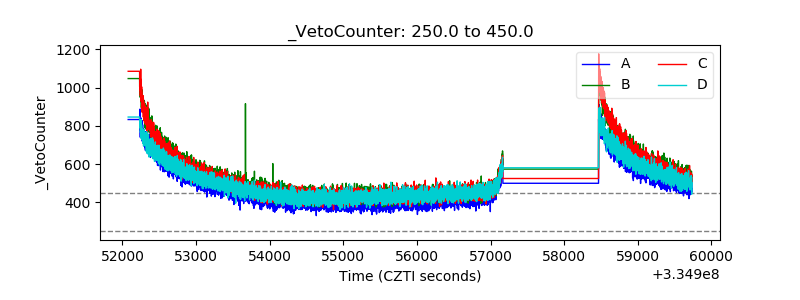 |