| Param | Original file | Final file |
|---|---|---|
| Filename | modeM0/AS1A09_088T01_9000003808_26358cztM0_level2.evt | modeM0/AS1A09_088T01_9000003808_26358cztM0_level2_quad_clean.evt |
| Size (bytes) | 557,510,400 | 125,141,760 |
| Size | 531.7 MB | 119.3 MB |
| Events in quadrant A | 3,345,737 | 855,352 |
| Events in quadrant B | 3,471,782 | 884,931 |
| Events in quadrant C | 3,465,570 | 836,601 |
| Events in quadrant D | 6,180,657 | 780,115 |
| Mode M9 | |||
|---|---|---|---|
| Quadrant | BADHDUFLAG | Total packets | Discarded packets |
| A | 0 | 14 | 0 |
| B | 0 | 14 | 0 |
| C | 0 | 14 | 0 |
| D | 0 | 14 | 0 |
| Mode M0 | |||
|---|---|---|---|
| Quadrant | BADHDUFLAG | Total packets | Discarded packets |
| A | 0 | 13916 | 0 |
| B | 0 | 14185 | 0 |
| C | 0 | 14122 | 0 |
| D | 0 | 22588 | 0 |
| Quadrant | Total seconds | Saturated seconds | Saturation percentage |
|---|---|---|---|
| A | 6215 | 53 | 0.852776% |
| B | 6215 | 134 | 2.156074% |
| C | 6216 | 80 | 1.287001% |
| D | 6216 | 768 | 12.355212% |
Noise dominated data is calculated using 1-second bins in cleaned event files. If a bin has >2000 counts, and if more than 50% of those come from <1% of pixels, then it is considered to be noise-dominated and hence unusable.
| Quadrant | # 1 sec bins | Bins with >0 counts | Bins with >2000 counts | High rate bins dominated by noise | Noise dominated (total time) | Noise dominated (detector-on time) | Marked lightcurve |
|---|---|---|---|---|---|---|---|
| A | 7580 | 6216 | 8 | 8 | 0.11% | 0.13% | 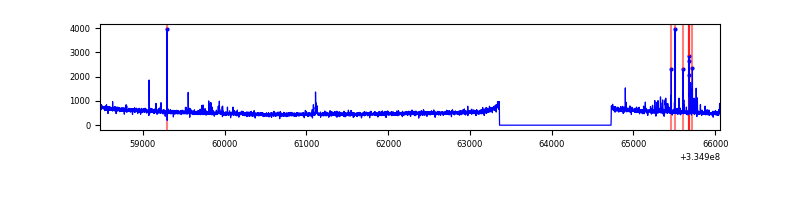 |
| B | 7580 | 6216 | 34 | 34 | 0.45% | 0.55% | 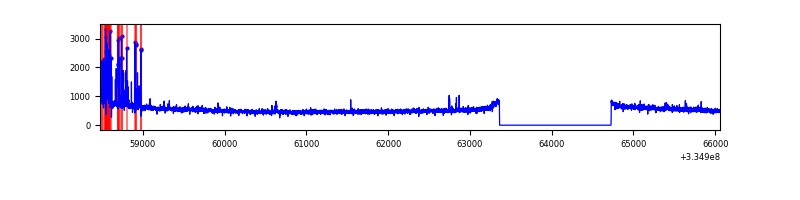 |
| C | 7581 | 6217 | 1 | 1 | 0.01% | 0.02% | 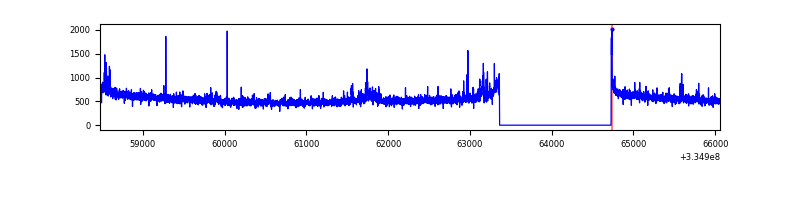 |
| D | 7581 | 6217 | 609 | 609 | 8.03% | 9.80% | 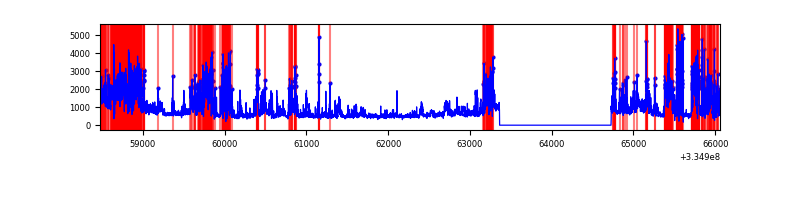 |
Top three noisy pixels from each quadrant. If the there are fewer than three noisy pixels in the level2.evt file, extra rows are filled as -1
| Pixel properties | Quadrant properties | ||||||
|---|---|---|---|---|---|---|---|
| Quadrant | DetID | PixID | Counts | Sigma | Mean | Median | Sigma |
| A | 0 | 13 | 124978 | 752.35 | 834 | 819 | 165.0 |
| A | 13 | 254 | 11144 | 62.57 | 834 | 819 | 165.0 |
| A | 0 | 226 | 7167 | 38.47 | 834 | 819 | 165.0 |
| B | 5 | 172 | 182024 | 1180.47 | 836 | 818 | 153.5 |
| B | 0 | 230 | 33863 | 215.27 | 836 | 818 | 153.5 |
| B | 12 | 111 | 17258 | 107.1 | 836 | 818 | 153.5 |
| C | 3 | 233 | 147153 | 792.18 | 809 | 818 | 184.7 |
| C | 14 | 238 | 132959 | 715.34 | 809 | 818 | 184.7 |
| C | 2 | 16 | 29349 | 154.45 | 809 | 818 | 184.7 |
| D | 7 | 80 | 2644107 | 14536.99 | 774 | 756 | 181.8 |
| D | 1 | 52 | 522561 | 2869.64 | 774 | 756 | 181.8 |
| D | 8 | 195 | 35255 | 189.73 | 774 | 756 | 181.8 |
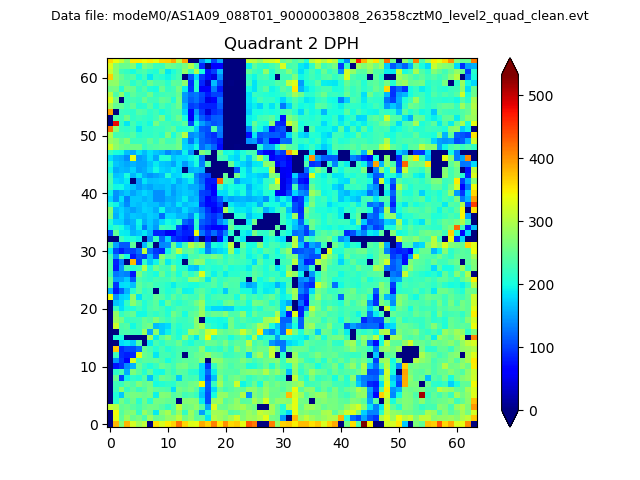
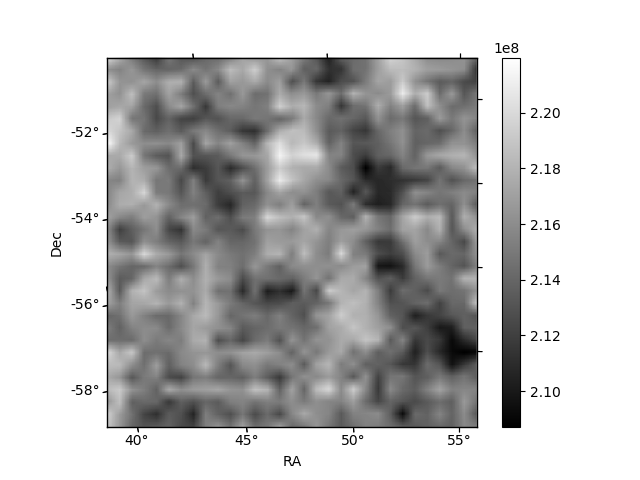
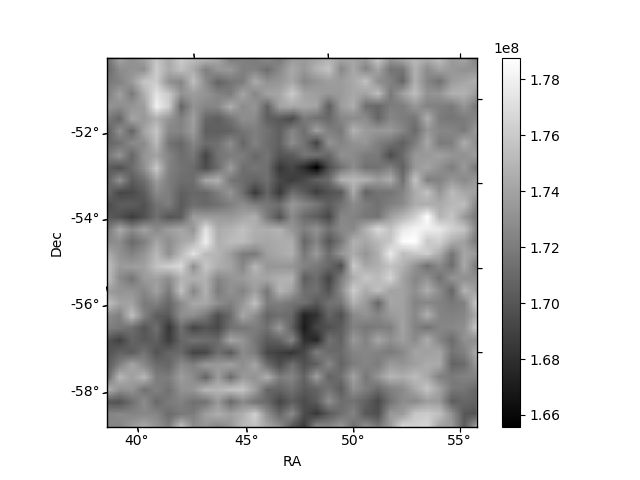
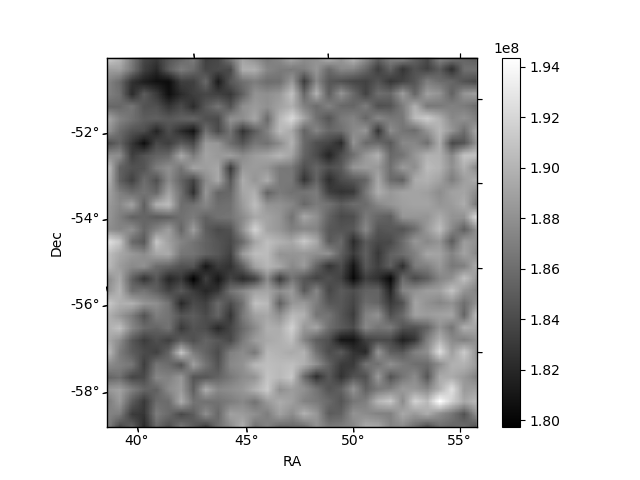
Histogram calculated using DETX and DETY for each event in the final _common_clean file
| Quadrant A | 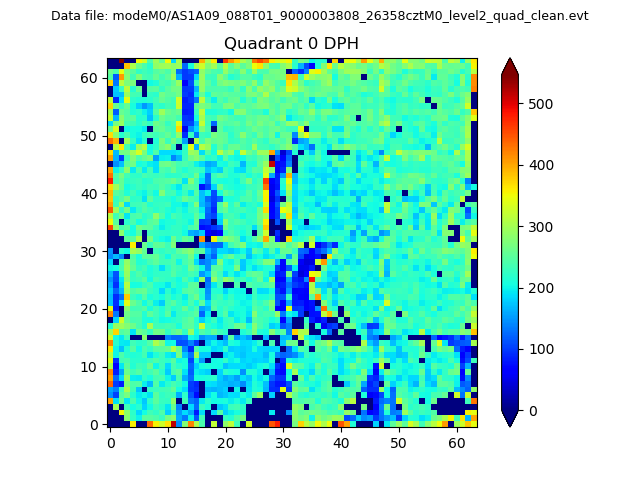 |
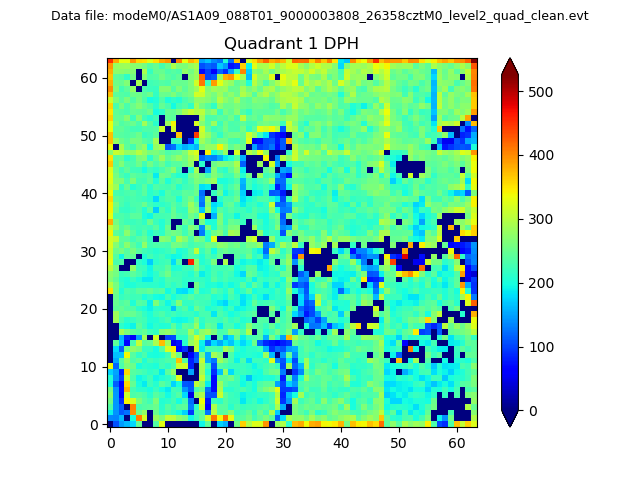 |
Quadrant B |
|---|---|---|---|
| Quadrant D | 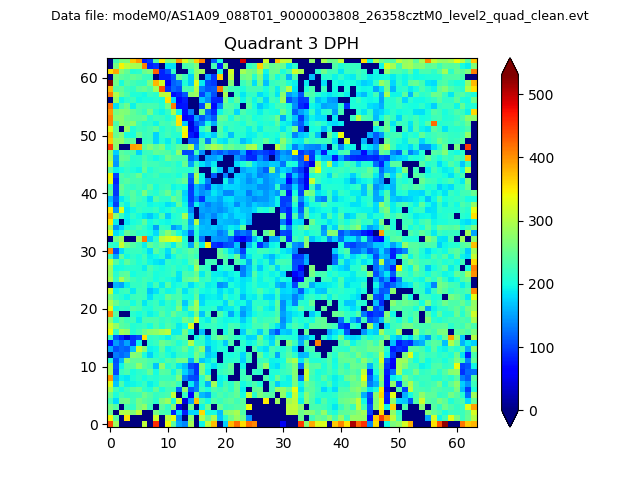 |
 |
Quadrant C |
| Plot type | Count rate plots | Images |
|---|---|---|
| Comparison with Poisson distribution Blue bars denote a histogram of data divided into 1 sec bins. Red curve is a Poisson curve with rate = median count rate of data. |
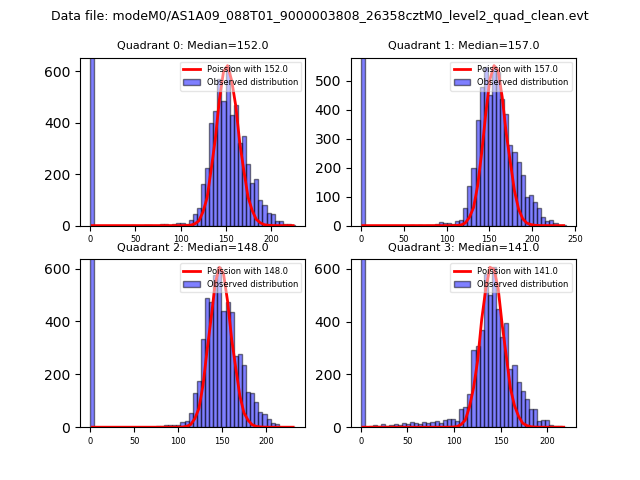 |
 |
| Quadrant-wise count rates Data is divided into 100 sec bins |
 |
|
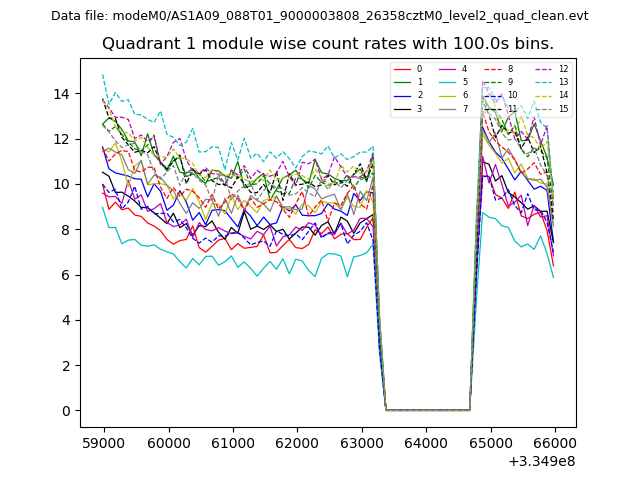
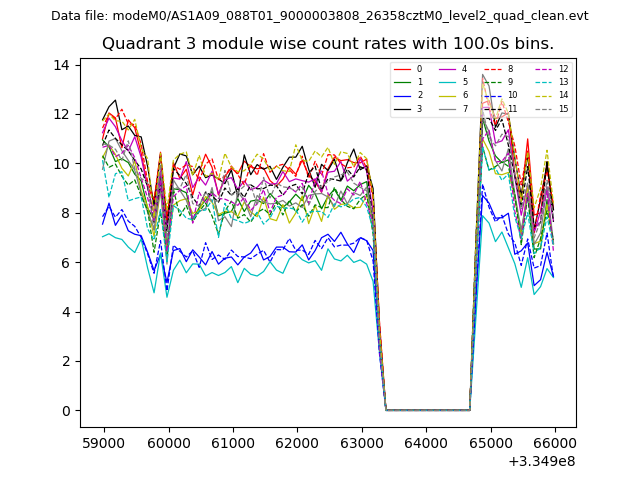
| Module-wise count rates for Quadrant A Data is divided into 100 sec bins |
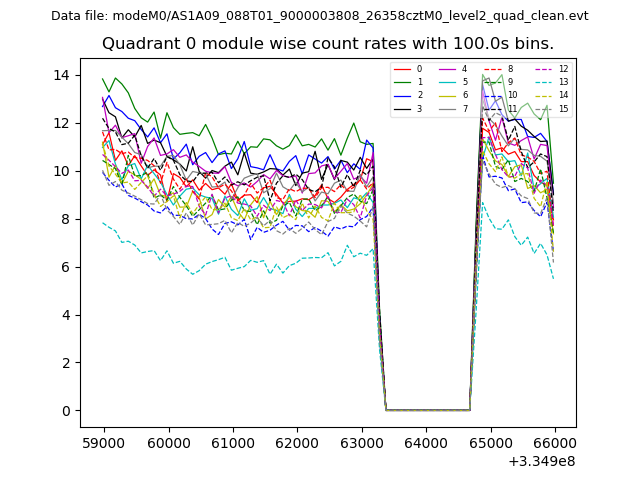 |
 |
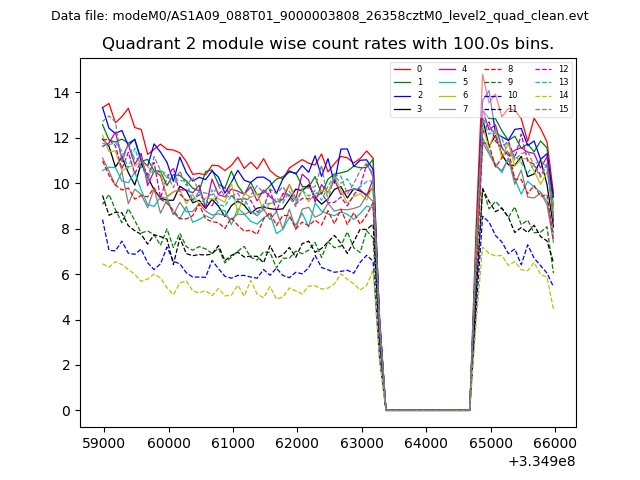
| Module-wise count rates for Quadrant B Data is divided into 100 sec bins |
 |
 |
| Module-wise count rates for Quadrant C Data is divided into 100 sec bins |
 |
 |
| Module-wise count rates for Quadrant D Data is divided into 100 sec bins |
 |
 |
| Parameter | Plot |
|---|---|
| CZT HV Monitor | 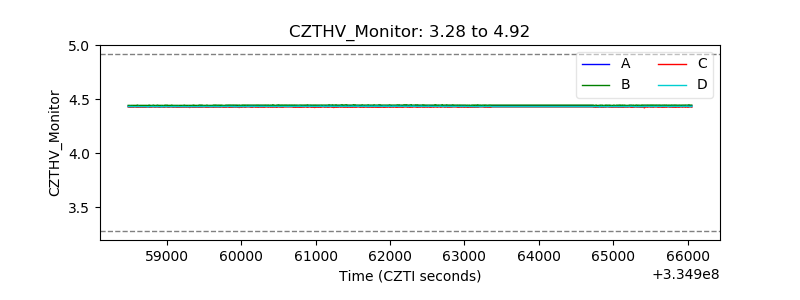 |
| D_VDD | 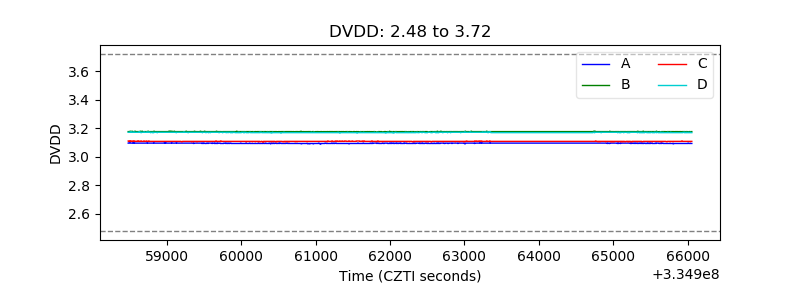 |
| Temperature 1 | 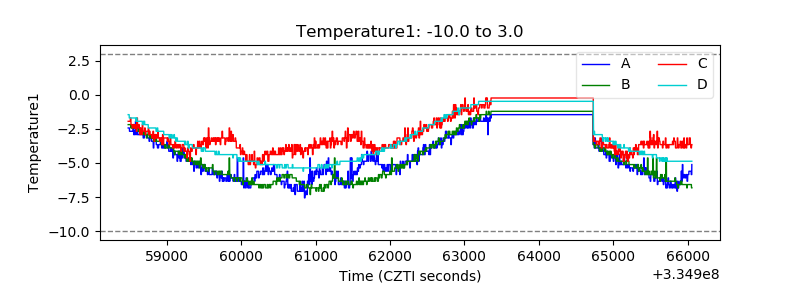 |
| Veto HV Monitor | 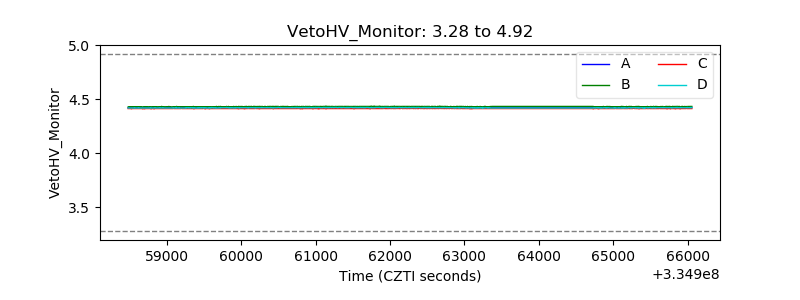 |
| Veto LLD | 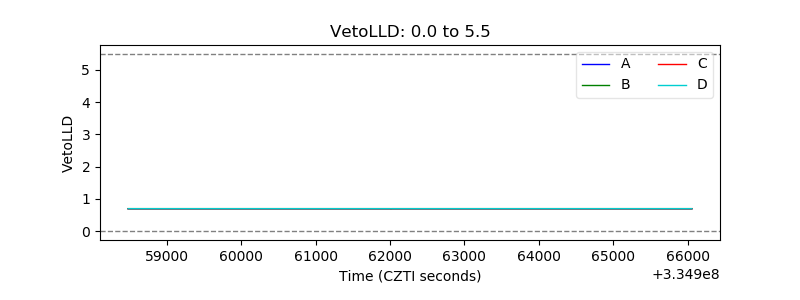 |
| Alpha Counter | 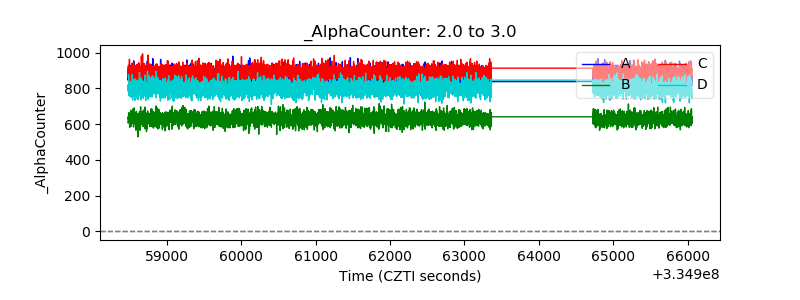 |
| _CPM_Rate | 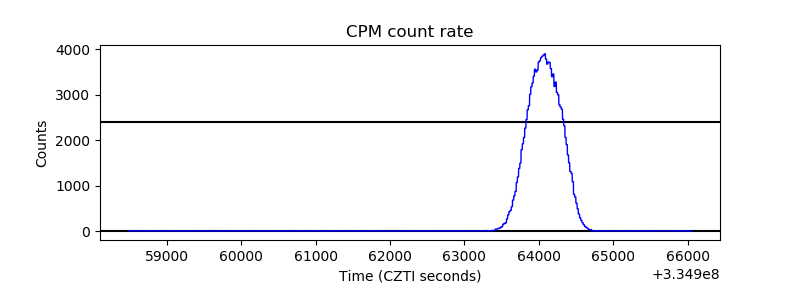 |
| CZT Counter | 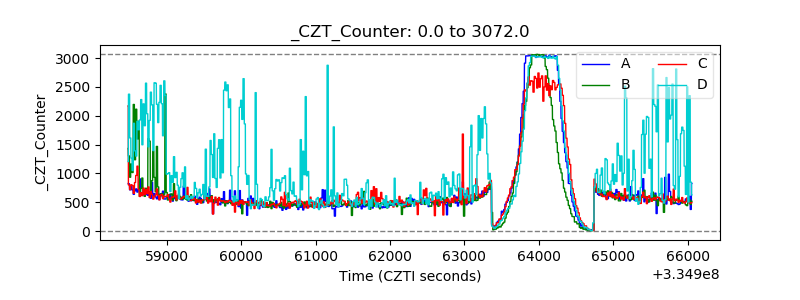 |
| +2.5 Volts monitor |  |
| +5 Volts monitor |  |
| _ROLL_ROT | 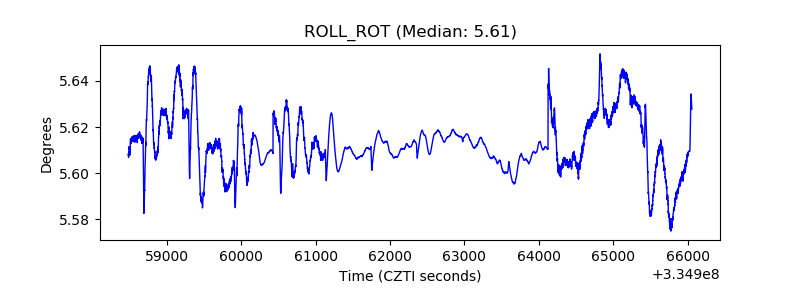 |
| _Roll_DEC | 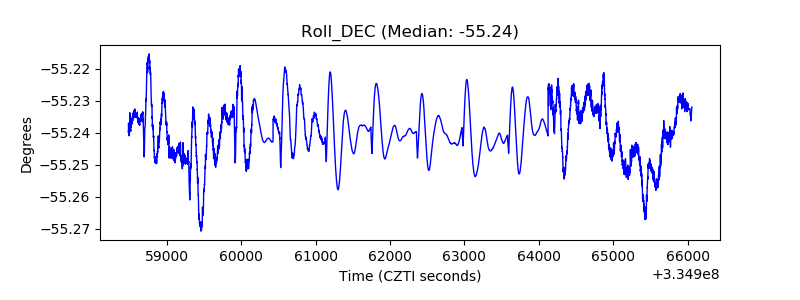 |
| _Roll_RA | 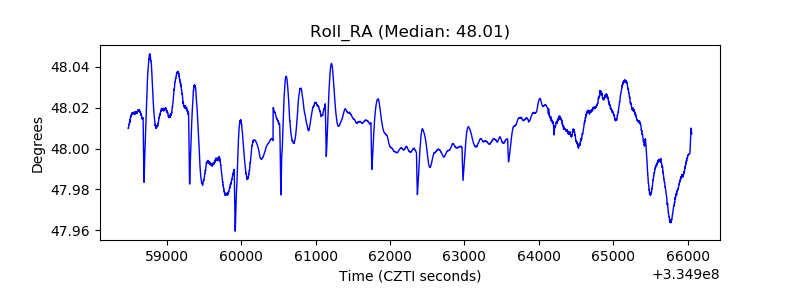 |
| Veto Counter | 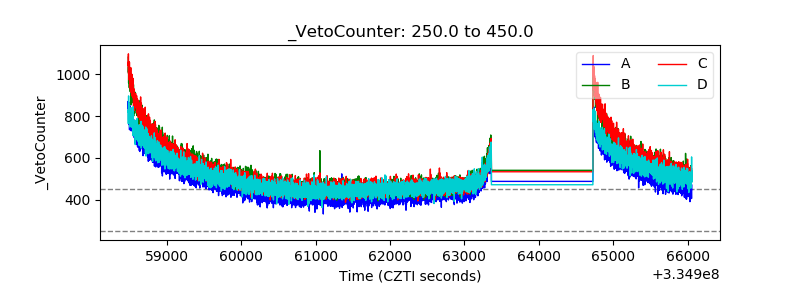 |