| Param | Original file | Final file |
|---|---|---|
| Filename | modeM0/AS1A09_088T01_9000003808_26359cztM0_level2.evt | modeM0/AS1A09_088T01_9000003808_26359cztM0_level2_quad_clean.evt |
| Size (bytes) | 556,372,800 | 123,318,720 |
| Size | 530.6 MB | 117.6 MB |
| Events in quadrant A | 3,198,460 | 843,734 |
| Events in quadrant B | 3,200,716 | 878,704 |
| Events in quadrant C | 3,451,565 | 834,400 |
| Events in quadrant D | 6,585,139 | 751,405 |
| Mode M9 | |||
|---|---|---|---|
| Quadrant | BADHDUFLAG | Total packets | Discarded packets |
| A | 0 | 14 | 0 |
| B | 0 | 14 | 0 |
| C | 0 | 14 | 0 |
| D | 0 | 14 | 0 |
| Mode M0 | |||
|---|---|---|---|
| Quadrant | BADHDUFLAG | Total packets | Discarded packets |
| A | 0 | 13308 | 0 |
| B | 0 | 13321 | 0 |
| C | 0 | 13963 | 0 |
| D | 0 | 23703 | 0 |
| Quadrant | Total seconds | Saturated seconds | Saturation percentage |
|---|---|---|---|
| A | 6110 | 50 | 0.818331% |
| B | 6111 | 42 | 0.687285% |
| C | 6111 | 108 | 1.767305% |
| D | 6110 | 1005 | 16.448445% |
Noise dominated data is calculated using 1-second bins in cleaned event files. If a bin has >2000 counts, and if more than 50% of those come from <1% of pixels, then it is considered to be noise-dominated and hence unusable.
| Quadrant | # 1 sec bins | Bins with >0 counts | Bins with >2000 counts | High rate bins dominated by noise | Noise dominated (total time) | Noise dominated (detector-on time) | Marked lightcurve |
|---|---|---|---|---|---|---|---|
| A | 7485 | 6111 | 9 | 9 | 0.12% | 0.15% | 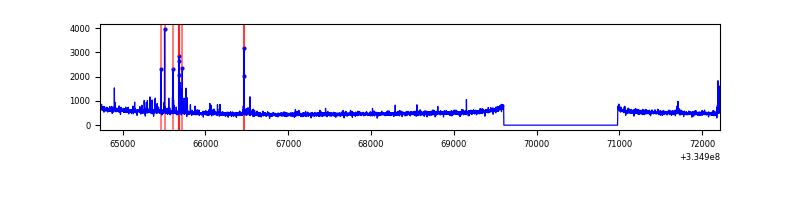 |
| B | 7486 | 6111 | 1 | 1 | 0.01% | 0.02% | 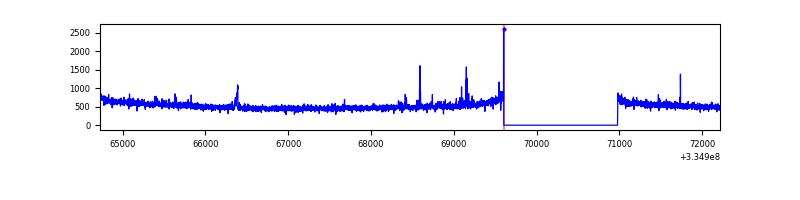 |
| C | 7486 | 6112 | 14 | 14 | 0.19% | 0.23% | 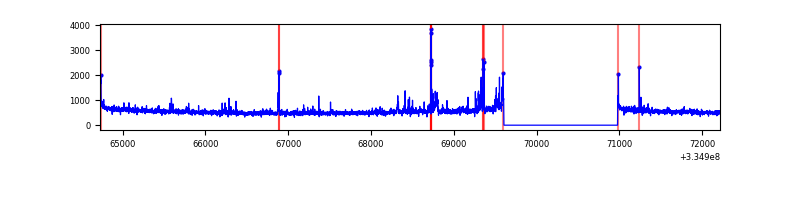 |
| D | 7485 | 6111 | 770 | 770 | 10.29% | 12.60% | 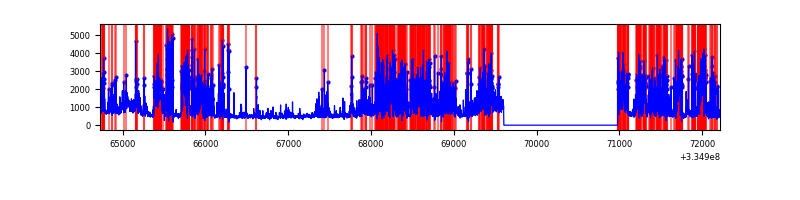 |
Top three noisy pixels from each quadrant. If the there are fewer than three noisy pixels in the level2.evt file, extra rows are filled as -1
| Pixel properties | Quadrant properties | ||||||
|---|---|---|---|---|---|---|---|
| Quadrant | DetID | PixID | Counts | Sigma | Mean | Median | Sigma |
| A | 0 | 13 | 117040 | 733.95 | 798 | 783 | 158.4 |
| A | 13 | 254 | 10073 | 58.65 | 798 | 783 | 158.4 |
| A | 0 | 226 | 6913 | 38.7 | 798 | 783 | 158.4 |
| B | 0 | 230 | 37939 | 250.31 | 805 | 786 | 148.4 |
| B | 12 | 32 | 20555 | 133.19 | 805 | 786 | 148.4 |
| B | 12 | 111 | 17421 | 112.08 | 805 | 786 | 148.4 |
| C | 3 | 233 | 192631 | 1065.83 | 781 | 791 | 180.0 |
| C | 14 | 238 | 127422 | 703.54 | 781 | 791 | 180.0 |
| C | 4 | 254 | 65241 | 358.07 | 781 | 791 | 180.0 |
| D | 7 | 80 | 3136313 | 18223.79 | 732 | 716 | 172.1 |
| D | 1 | 52 | 557245 | 3234.49 | 732 | 716 | 172.1 |
| D | 2 | 120 | 49283 | 282.27 | 732 | 716 | 172.1 |
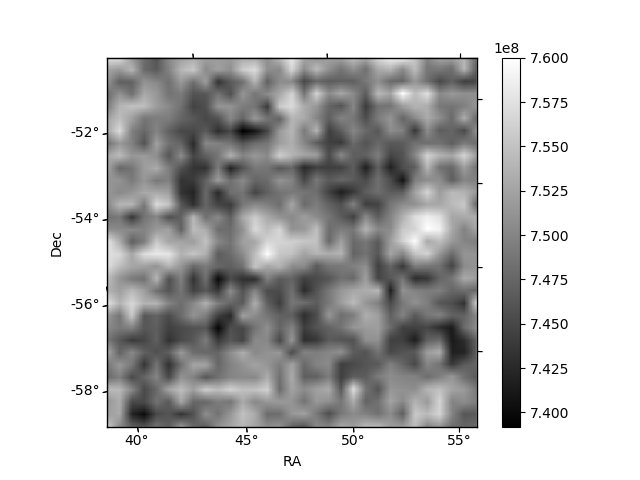
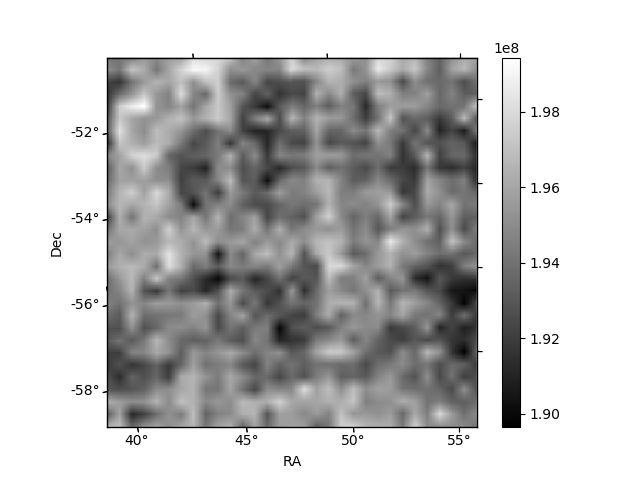
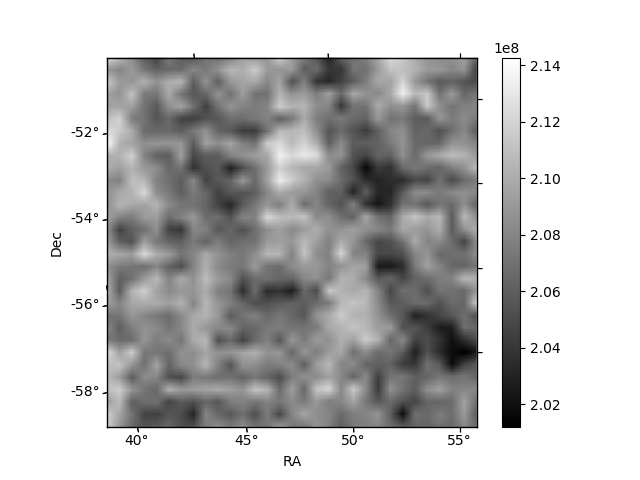
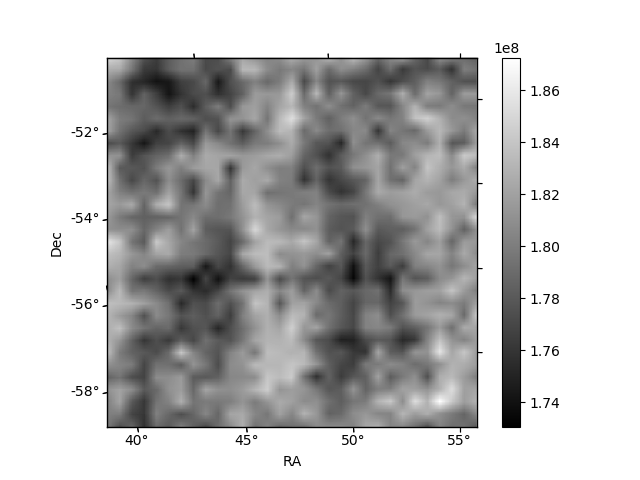
Histogram calculated using DETX and DETY for each event in the final _common_clean file
| Quadrant A | 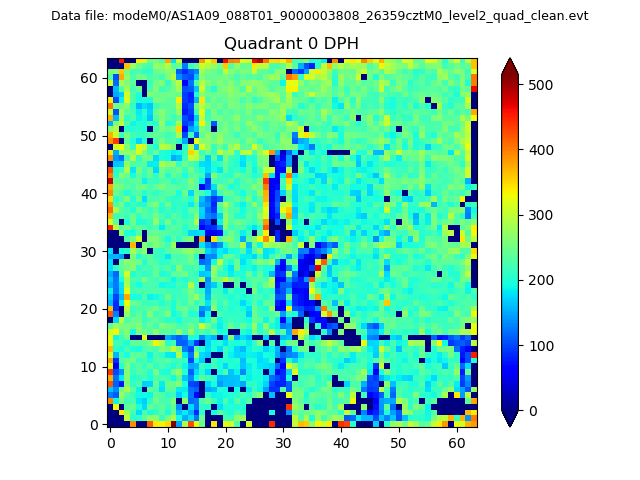 |
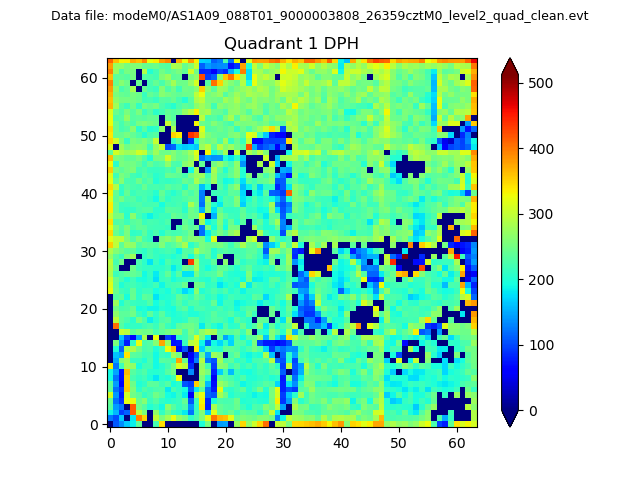 |
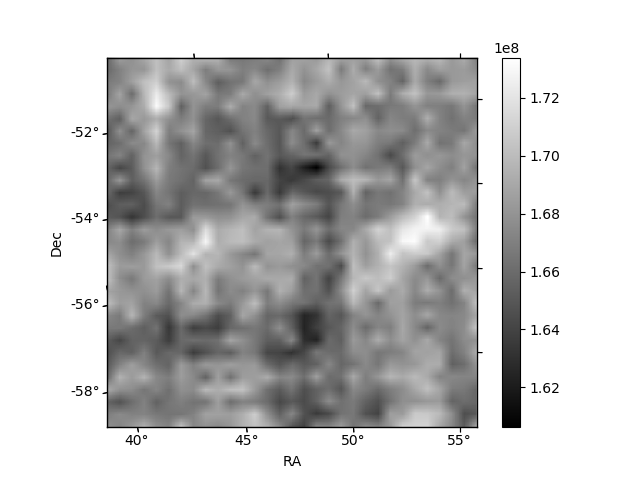
Quadrant B |
|---|---|---|---|
| Quadrant D | 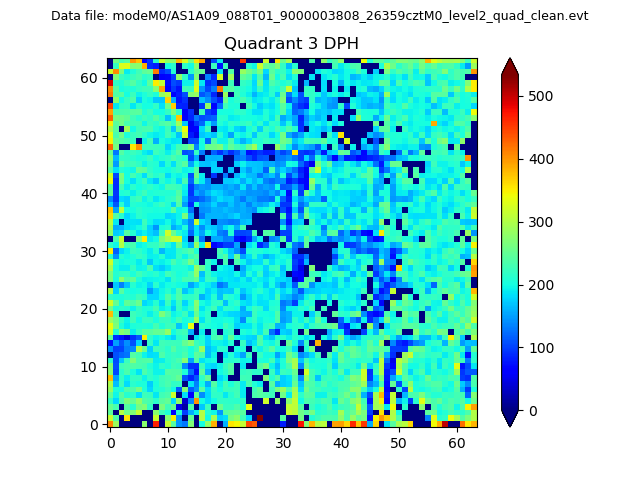 |
 |
Quadrant C |
| Plot type | Count rate plots | Images |
|---|---|---|
| Comparison with Poisson distribution Blue bars denote a histogram of data divided into 1 sec bins. Red curve is a Poisson curve with rate = median count rate of data. |
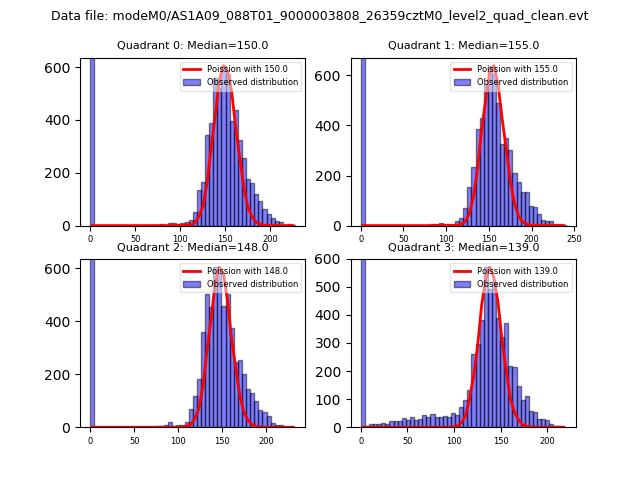 |
 |
| Quadrant-wise count rates Data is divided into 100 sec bins |
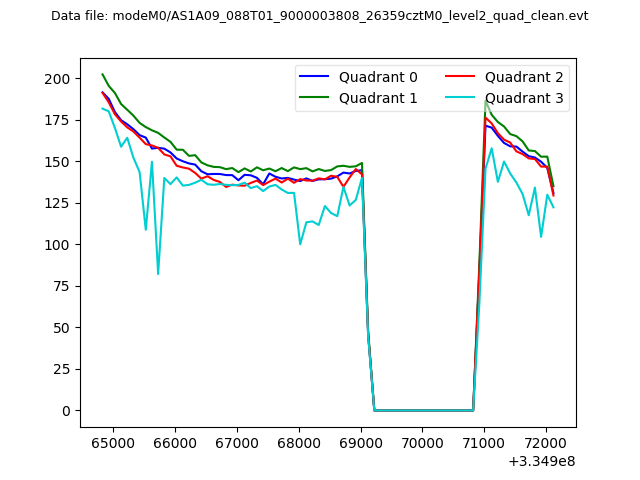 |
|
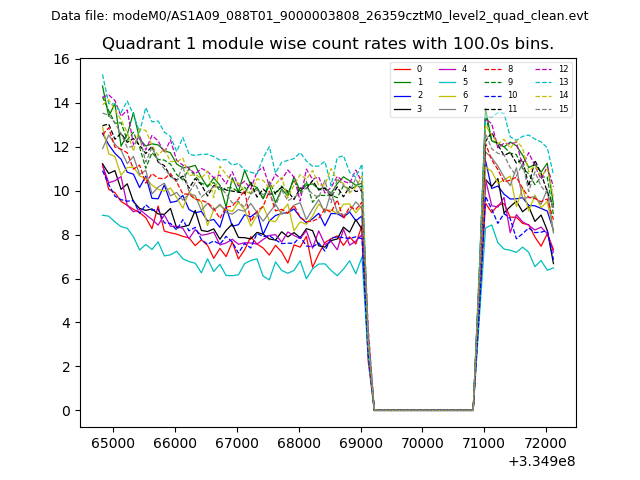
| Module-wise count rates for Quadrant A Data is divided into 100 sec bins |
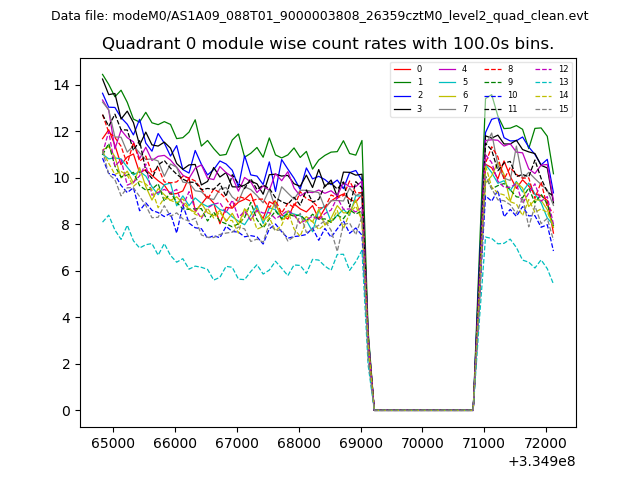 |
 |
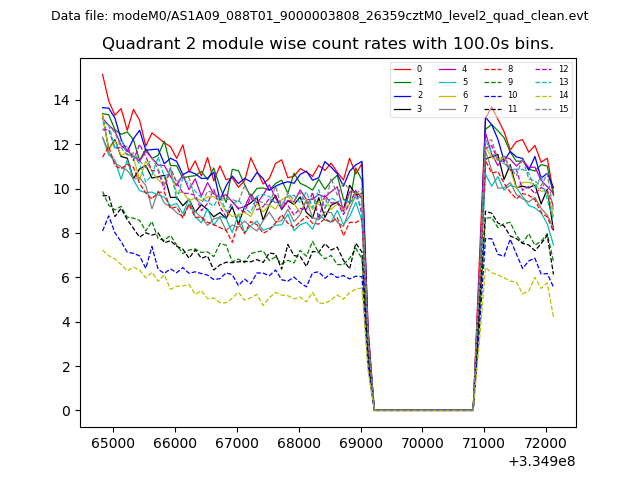
| Module-wise count rates for Quadrant B Data is divided into 100 sec bins |
 |
 |
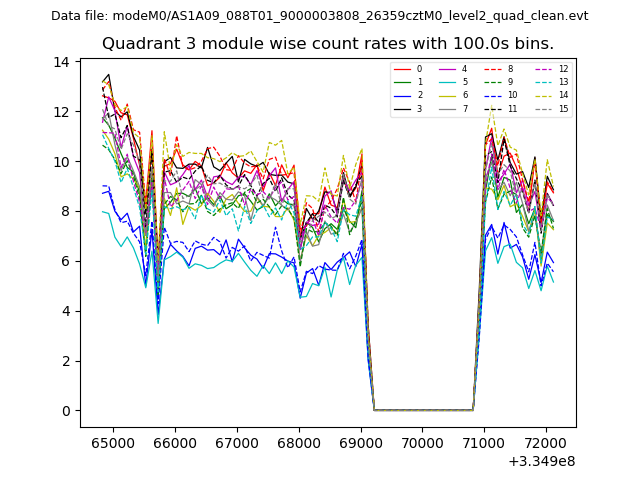
| Module-wise count rates for Quadrant C Data is divided into 100 sec bins |
 |
 |
| Module-wise count rates for Quadrant D Data is divided into 100 sec bins |
 |
 |
| Parameter | Plot |
|---|---|
| CZT HV Monitor | 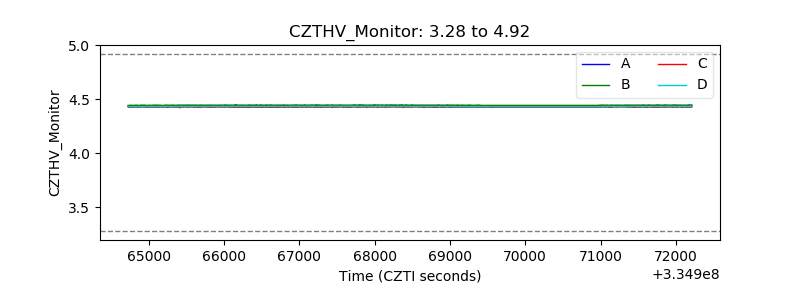 |
| D_VDD | 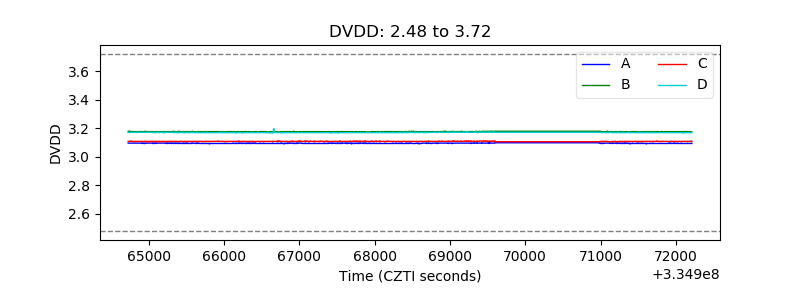 |
| Temperature 1 | 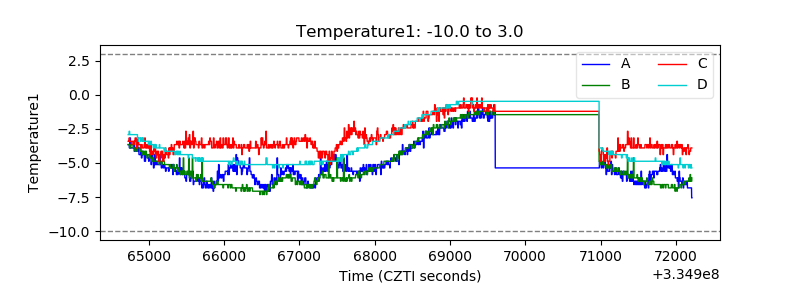 |
| Veto HV Monitor | 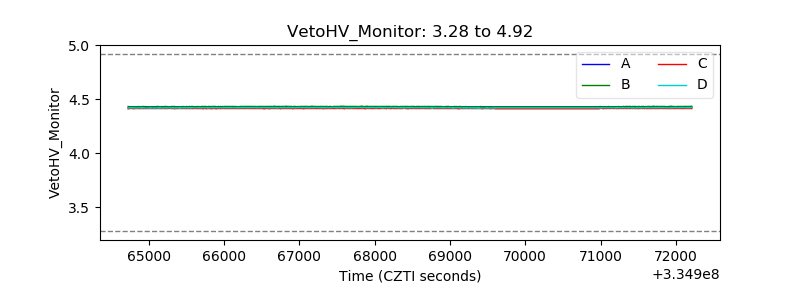 |
| Veto LLD | 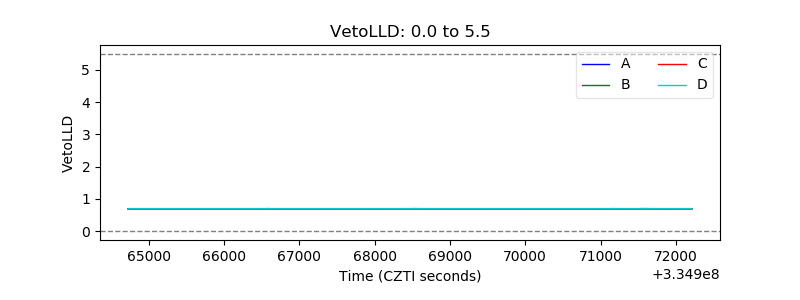 |
| Alpha Counter | 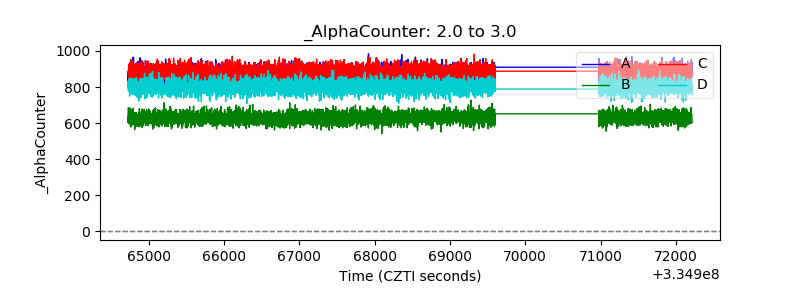 |
| _CPM_Rate | 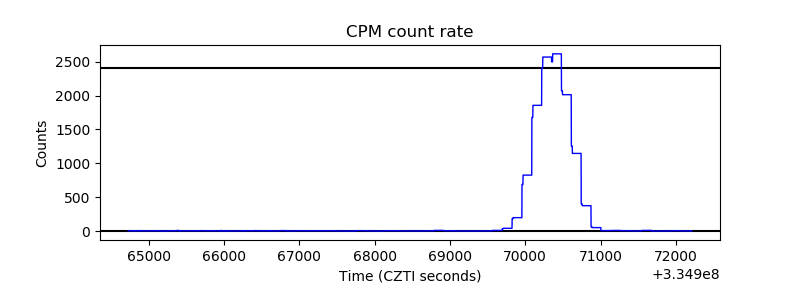 |
| CZT Counter |  |
| +2.5 Volts monitor |  |
| +5 Volts monitor | 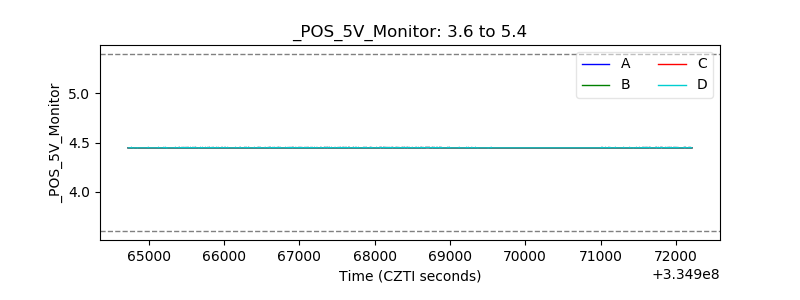 |
| _ROLL_ROT | 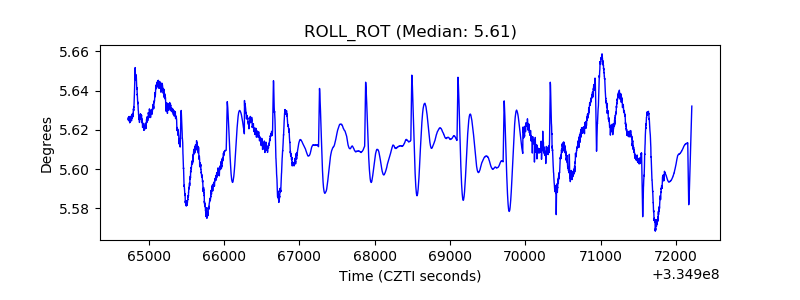 |
| _Roll_DEC | 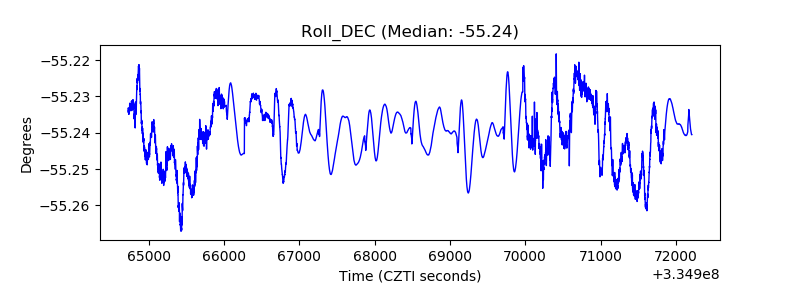 |
| _Roll_RA |  |
| Veto Counter | 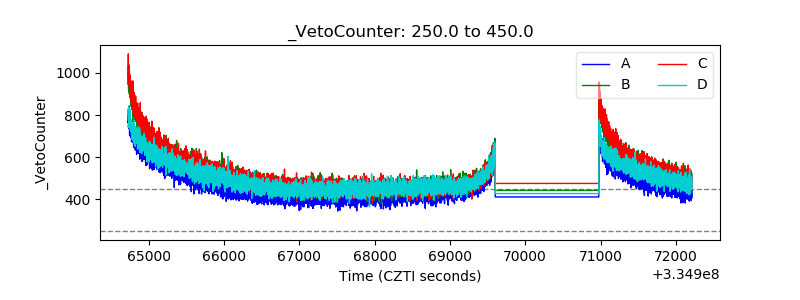 |