| Param | Original file | Final file |
|---|---|---|
| Filename | modeM0/AS1A09_088T01_9000003808_26371cztM0_level2.evt | modeM0/AS1A09_088T01_9000003808_26371cztM0_level2_quad_clean.evt |
| Size (bytes) | 691,470,720 | 87,984,000 |
| Size | 659.4 MB | 83.9 MB |
| Events in quadrant A | 3,291,241 | 600,057 |
| Events in quadrant B | 3,313,848 | 612,375 |
| Events in quadrant C | 6,531,895 | 505,724 |
| Events in quadrant D | 7,381,558 | 509,361 |
| Mode M9 | |||
|---|---|---|---|
| Quadrant | BADHDUFLAG | Total packets | Discarded packets |
| A | 0 | 15 | 0 |
| B | 0 | 16 | 0 |
| C | 0 | 16 | 0 |
| D | 0 | 16 | 0 |
| Mode M0 | |||
|---|---|---|---|
| Quadrant | BADHDUFLAG | Total packets | Discarded packets |
| A | 0 | 13885 | 0 |
| B | 0 | 13891 | 0 |
| C | 0 | 23667 | 0 |
| D | 0 | 26265 | 0 |
| Quadrant | Total seconds | Saturated seconds | Saturation percentage |
|---|---|---|---|
| A | 6256 | 46 | 0.735294% |
| B | 6256 | 54 | 0.863171% |
| C | 6256 | 1343 | 21.467391% |
| D | 6255 | 1293 | 20.671463% |
Noise dominated data is calculated using 1-second bins in cleaned event files. If a bin has >2000 counts, and if more than 50% of those come from <1% of pixels, then it is considered to be noise-dominated and hence unusable.
| Quadrant | # 1 sec bins | Bins with >0 counts | Bins with >2000 counts | High rate bins dominated by noise | Noise dominated (total time) | Noise dominated (detector-on time) | Marked lightcurve |
|---|---|---|---|---|---|---|---|
| A | 7506 | 6257 | 3 | 3 | 0.04% | 0.05% | 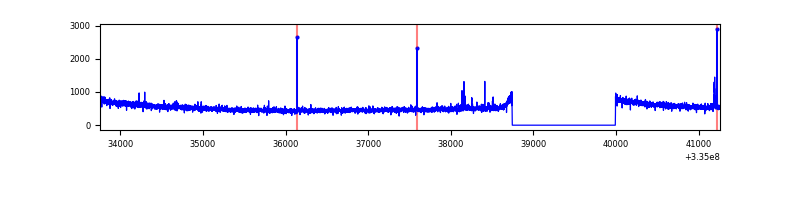 |
| B | 7506 | 6257 | 0 | 0 | 0.00% | 0.00% | 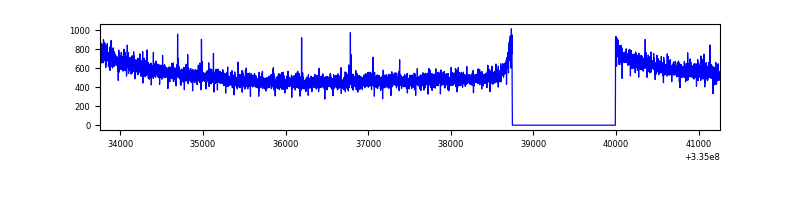 |
| C | 7506 | 6256 | 835 | 835 | 11.12% | 13.35% | 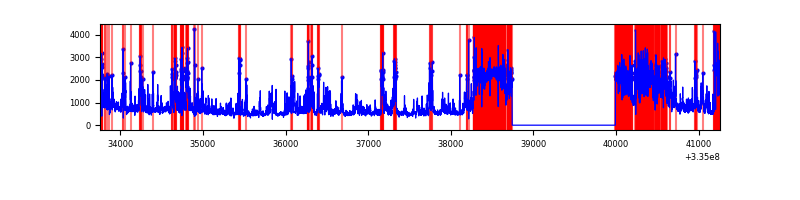 |
| D | 7505 | 6256 | 968 | 968 | 12.90% | 15.47% | 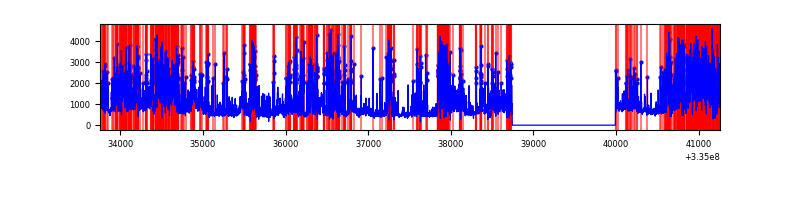 |
Top three noisy pixels from each quadrant. If the there are fewer than three noisy pixels in the level2.evt file, extra rows are filled as -1
| Pixel properties | Quadrant properties | ||||||
|---|---|---|---|---|---|---|---|
| Quadrant | DetID | PixID | Counts | Sigma | Mean | Median | Sigma |
| A | 0 | 13 | 38084 | 223.55 | 843 | 829 | 166.6 |
| A | 13 | 254 | 10136 | 55.85 | 843 | 829 | 166.6 |
| A | 0 | 226 | 7344 | 39.09 | 843 | 829 | 166.6 |
| B | 0 | 230 | 25504 | 159.22 | 843 | 825 | 155.0 |
| B | 12 | 111 | 17570 | 108.03 | 843 | 825 | 155.0 |
| B | 11 | 111 | 15798 | 96.6 | 843 | 825 | 155.0 |
| C | 3 | 233 | 3524275 | 21855.31 | 706 | 715 | 161.2 |
| C | 14 | 238 | 114729 | 707.19 | 706 | 715 | 161.2 |
| C | 2 | 16 | 103487 | 637.46 | 706 | 715 | 161.2 |
| D | 7 | 80 | 3727148 | 21449.92 | 735 | 716 | 173.7 |
| D | 1 | 52 | 586415 | 3371.37 | 735 | 716 | 173.7 |
| D | 11 | 176 | 154241 | 883.71 | 735 | 716 | 173.7 |
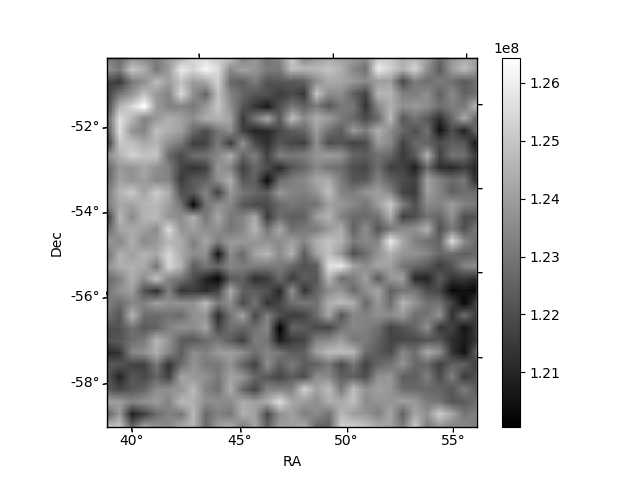
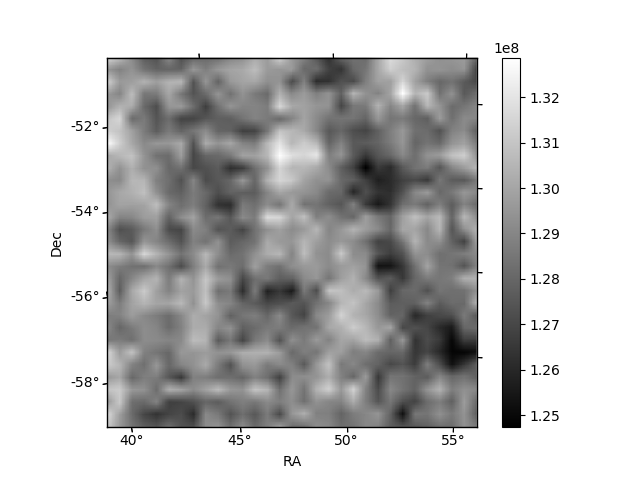
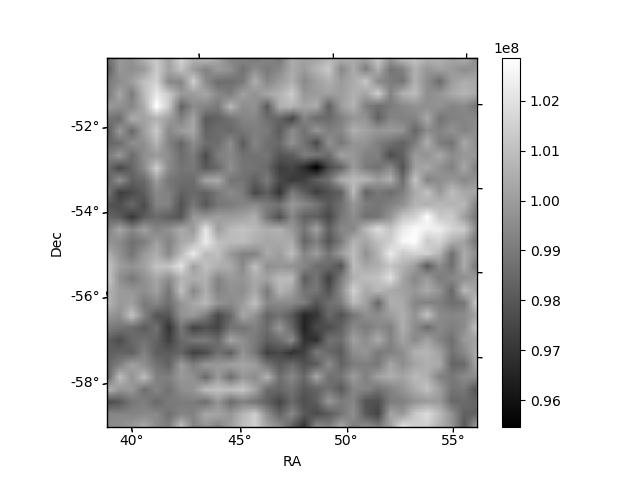
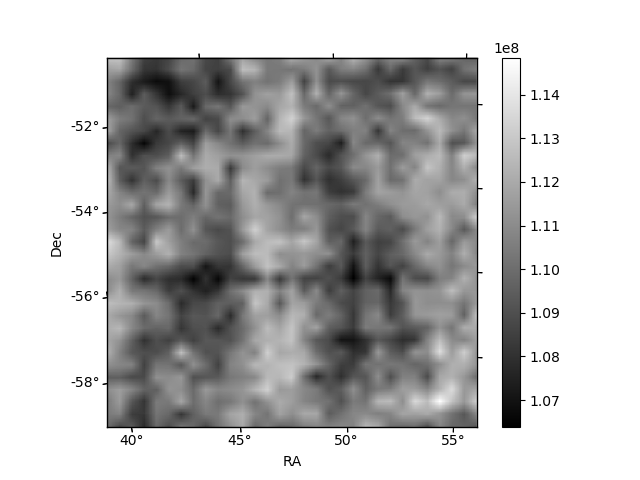
Histogram calculated using DETX and DETY for each event in the final _common_clean file
| Quadrant A | 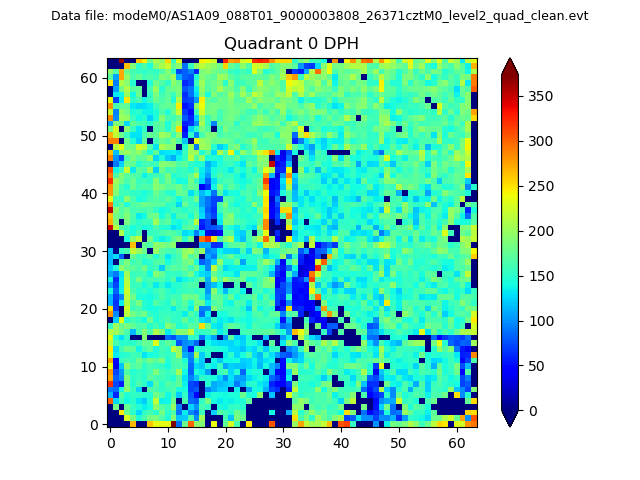 |
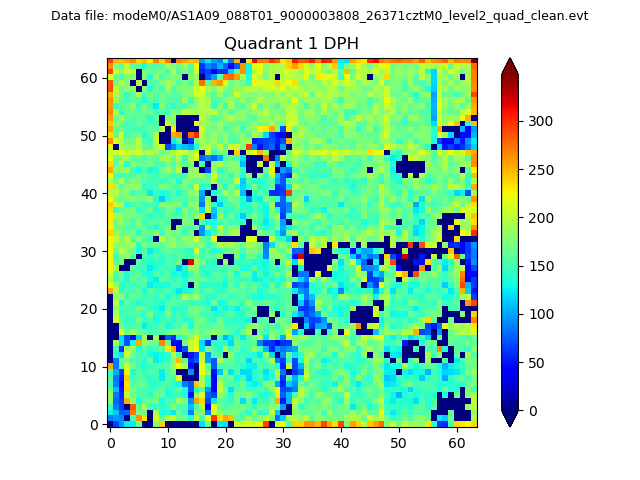 |
Quadrant B |
|---|---|---|---|
| Quadrant D | 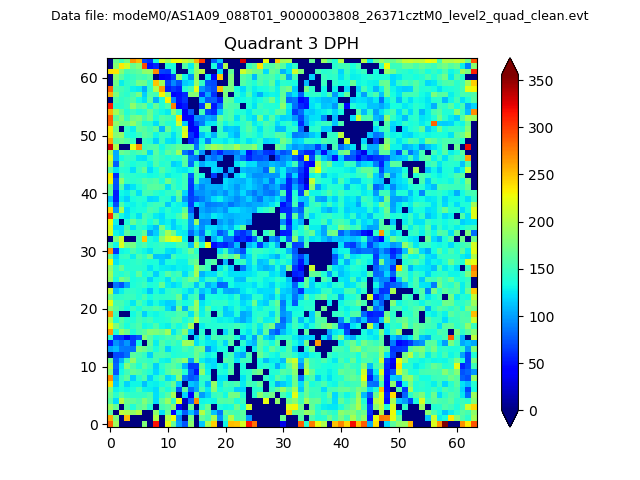 |
 |
Quadrant C |
| Plot type | Count rate plots | Images |
|---|---|---|
| Comparison with Poisson distribution Blue bars denote a histogram of data divided into 1 sec bins. Red curve is a Poisson curve with rate = median count rate of data. |
 |
 |
| Quadrant-wise count rates Data is divided into 100 sec bins |
 |
|
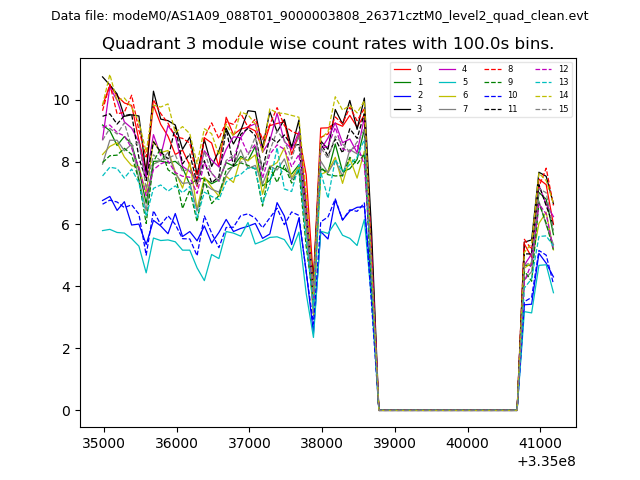
| Module-wise count rates for Quadrant A Data is divided into 100 sec bins |
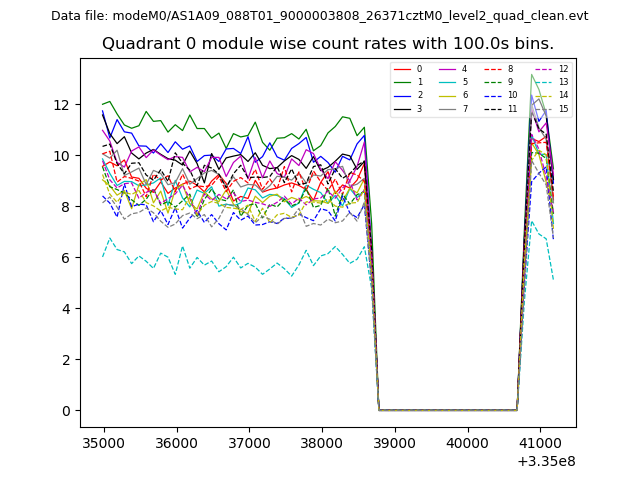 |
 |
| Module-wise count rates for Quadrant B Data is divided into 100 sec bins |
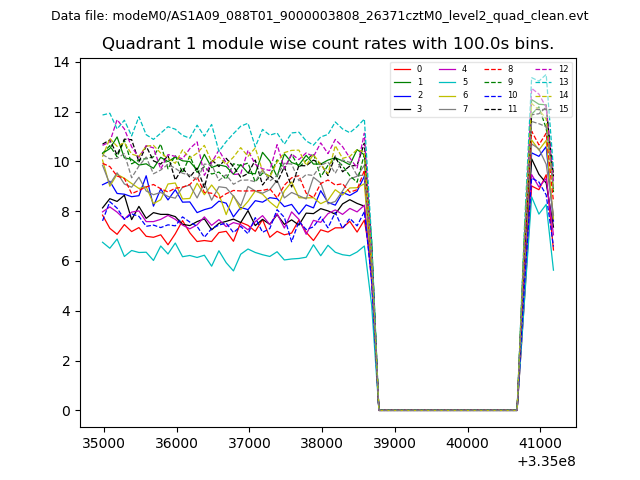 |
 |
| Module-wise count rates for Quadrant C Data is divided into 100 sec bins |
 |
 |
| Module-wise count rates for Quadrant D Data is divided into 100 sec bins |
 |
 |
| Parameter | Plot |
|---|---|
| CZT HV Monitor | 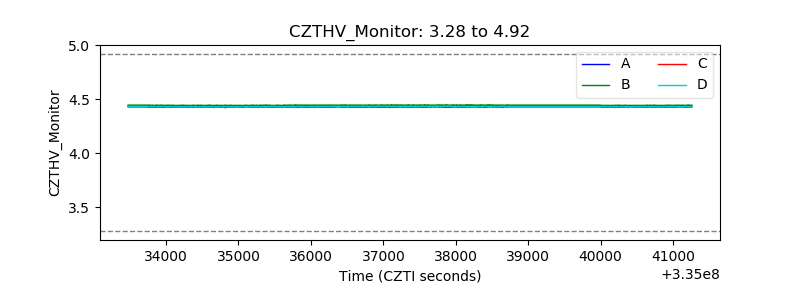 |
| D_VDD | 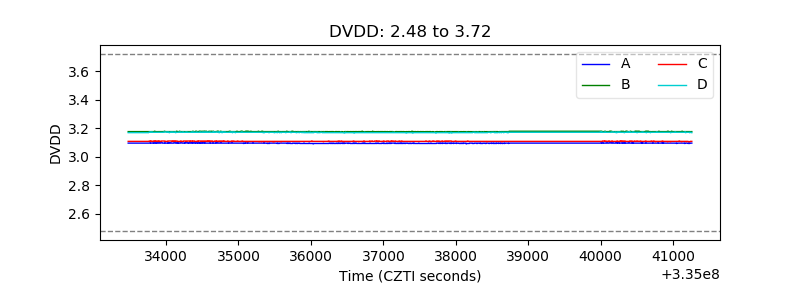 |
| Temperature 1 | 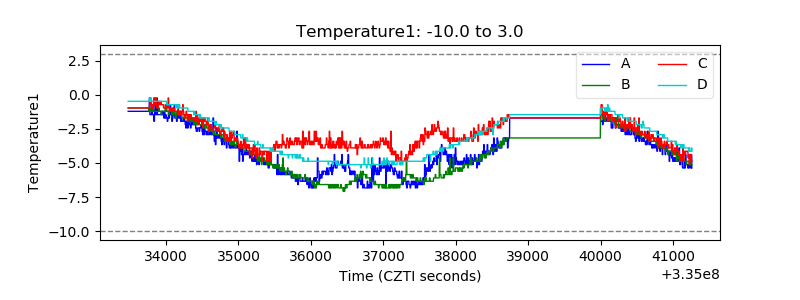 |
| Veto HV Monitor | 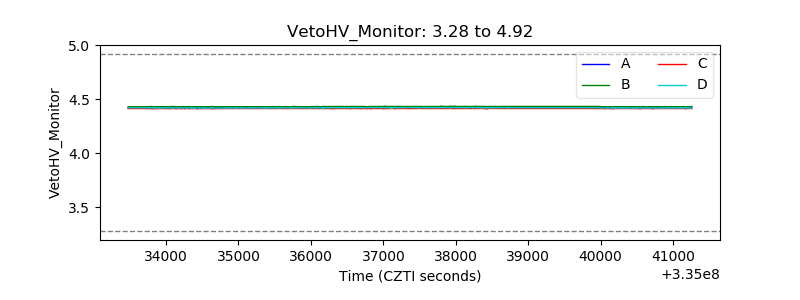 |
| Veto LLD |  |
| Alpha Counter | 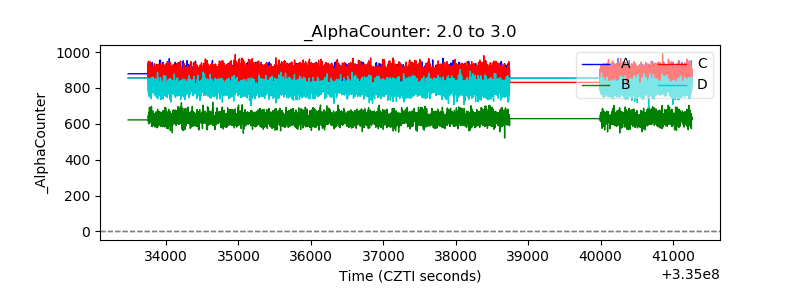 |
| _CPM_Rate | 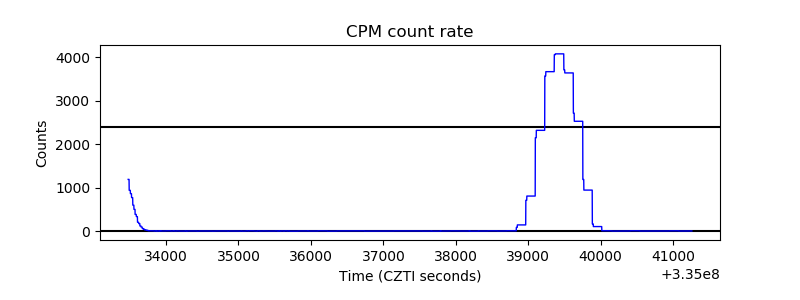 |
| CZT Counter |  |
| +2.5 Volts monitor |  |
| +5 Volts monitor |  |
| _ROLL_ROT | 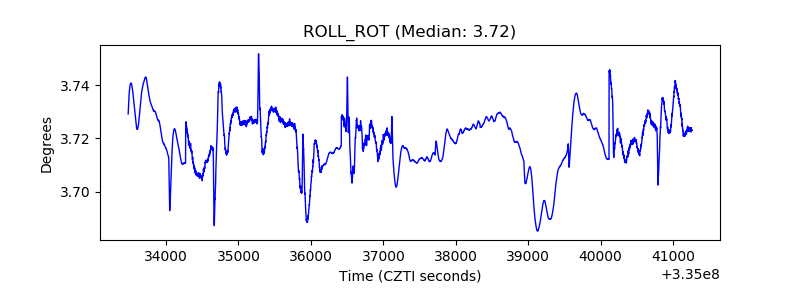 |
| _Roll_DEC | 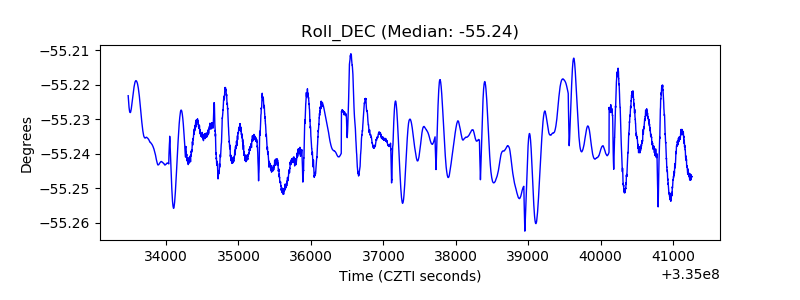 |
| _Roll_RA | 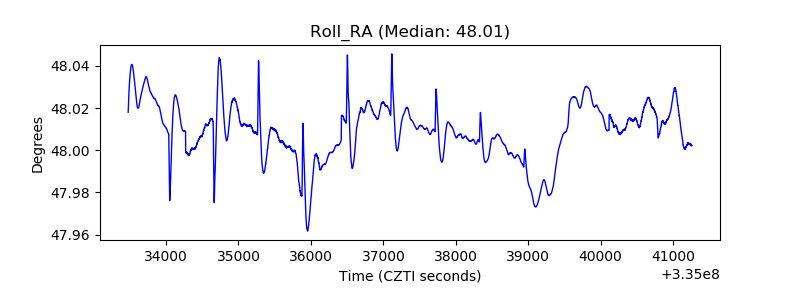 |
| Veto Counter | 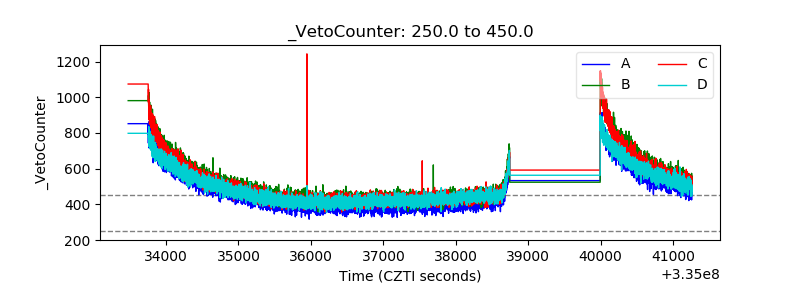 |