| Param | Original file | Final file |
|---|---|---|
| Filename | modeM0/AS1A09_088T01_9000003808_26374cztM0_level2.evt | modeM0/AS1A09_088T01_9000003808_26374cztM0_level2_quad_clean.evt |
| Size (bytes) | 685,235,520 | 121,605,120 |
| Size | 653.5 MB | 116.0 MB |
| Events in quadrant A | 3,129,209 | 845,839 |
| Events in quadrant B | 3,256,355 | 876,289 |
| Events in quadrant C | 6,528,017 | 780,447 |
| Events in quadrant D | 7,414,378 | 741,582 |
| Mode M9 | |||
|---|---|---|---|
| Quadrant | BADHDUFLAG | Total packets | Discarded packets |
| A | 0 | 16 | 0 |
| B | 0 | 17 | 0 |
| C | 0 | 17 | 0 |
| D | 0 | 17 | 0 |
| Mode M0 | |||
|---|---|---|---|
| Quadrant | BADHDUFLAG | Total packets | Discarded packets |
| A | 0 | 13155 | 0 |
| B | 0 | 13506 | 0 |
| C | 0 | 23804 | 0 |
| D | 0 | 26377 | 0 |
| Quadrant | Total seconds | Saturated seconds | Saturation percentage |
|---|---|---|---|
| A | 6280 | 42 | 0.668790% |
| B | 6280 | 56 | 0.891720% |
| C | 6279 | 1018 | 16.212773% |
| D | 6279 | 1337 | 21.293200% |
Noise dominated data is calculated using 1-second bins in cleaned event files. If a bin has >2000 counts, and if more than 50% of those come from <1% of pixels, then it is considered to be noise-dominated and hence unusable.
| Quadrant | # 1 sec bins | Bins with >0 counts | Bins with >2000 counts | High rate bins dominated by noise | Noise dominated (total time) | Noise dominated (detector-on time) | Marked lightcurve |
|---|---|---|---|---|---|---|---|
| A | 7595 | 6281 | 0 | 0 | 0.00% | 0.00% | 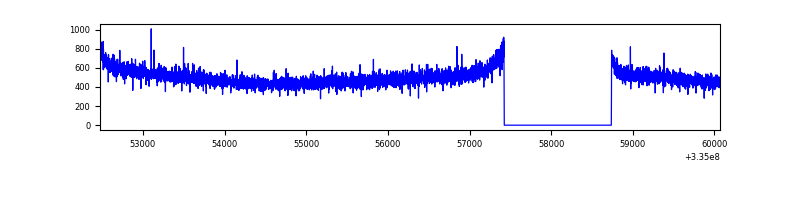 |
| B | 7595 | 6281 | 0 | 0 | 0.00% | 0.00% | 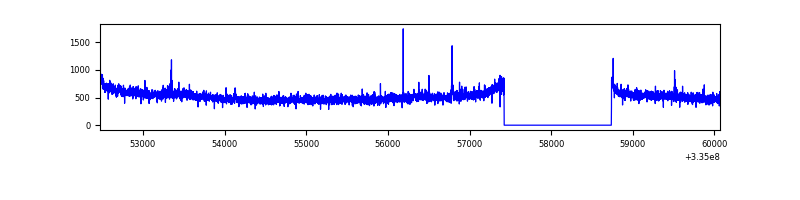 |
| C | 7594 | 6280 | 473 | 473 | 6.23% | 7.53% | 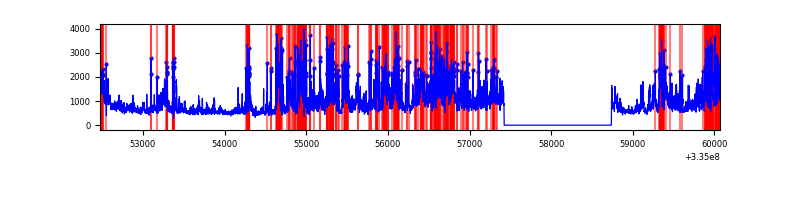 |
| D | 7594 | 6280 | 1045 | 1045 | 13.76% | 16.64% | 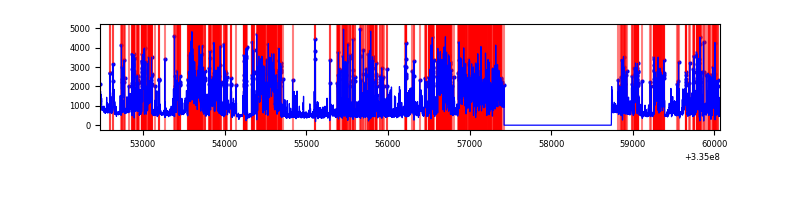 |
Top three noisy pixels from each quadrant. If the there are fewer than three noisy pixels in the level2.evt file, extra rows are filled as -1
| Pixel properties | Quadrant properties | ||||||
|---|---|---|---|---|---|---|---|
| Quadrant | DetID | PixID | Counts | Sigma | Mean | Median | Sigma |
| A | 13 | 254 | 9722 | 55.78 | 811 | 796 | 160.0 |
| A | 0 | 226 | 7005 | 38.8 | 811 | 796 | 160.0 |
| A | 3 | 137 | 6957 | 38.5 | 811 | 796 | 160.0 |
| B | 0 | 230 | 35239 | 227.71 | 820 | 803 | 151.2 |
| B | 0 | 219 | 17888 | 112.98 | 820 | 803 | 151.2 |
| B | 12 | 111 | 17656 | 111.44 | 820 | 803 | 151.2 |
| C | 3 | 233 | 3432893 | 19778.76 | 757 | 763 | 173.5 |
| C | 14 | 238 | 122692 | 702.66 | 757 | 763 | 173.5 |
| C | 2 | 16 | 19478 | 107.85 | 757 | 763 | 173.5 |
| D | 7 | 80 | 4186128 | 24218.87 | 732 | 717 | 172.8 |
| D | 1 | 52 | 277218 | 1599.97 | 732 | 717 | 172.8 |
| D | 11 | 176 | 70454 | 403.53 | 732 | 717 | 172.8 |
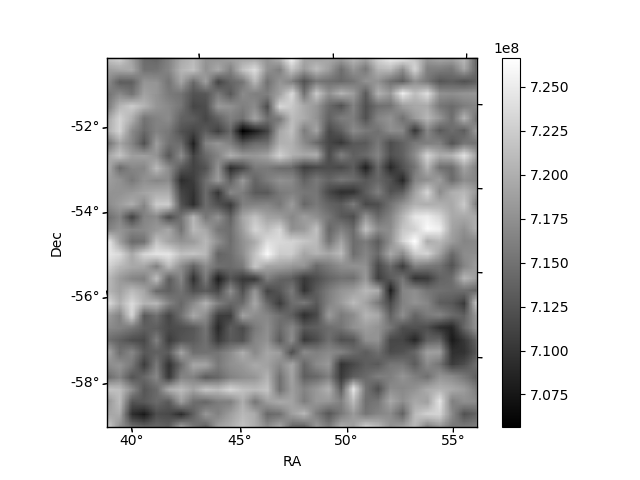
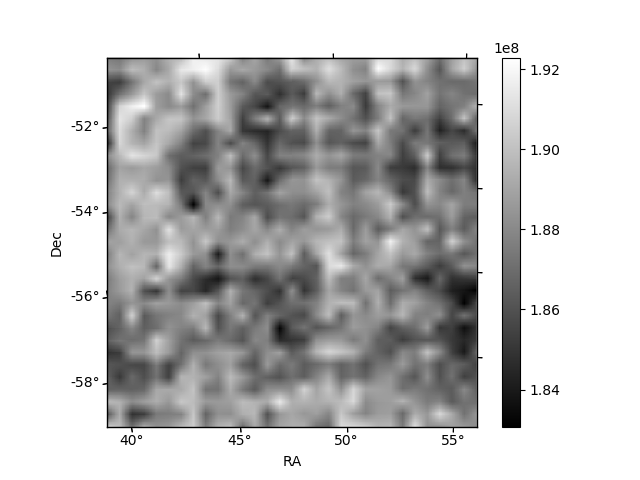
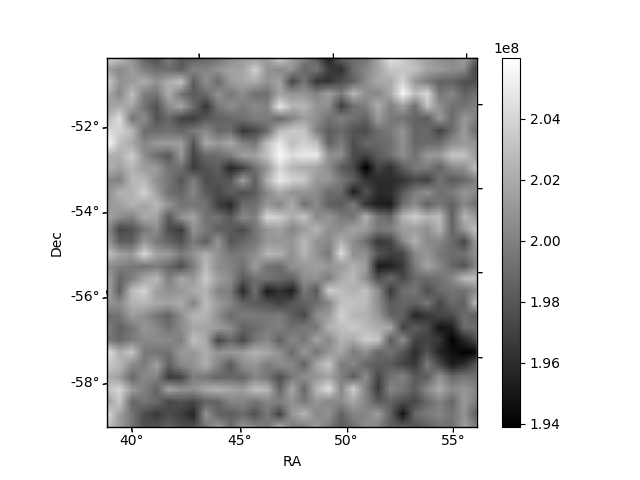
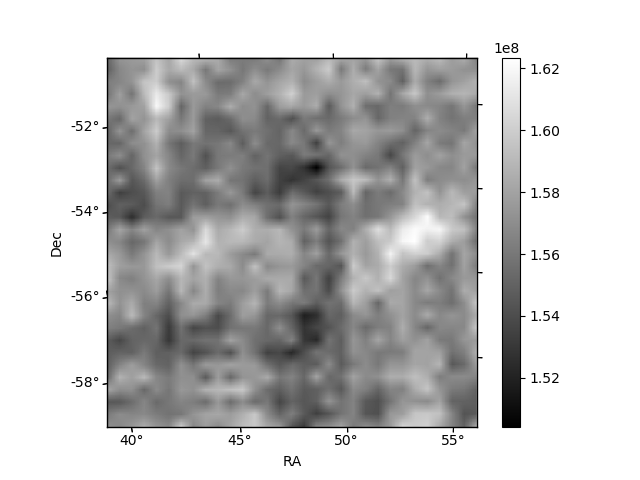
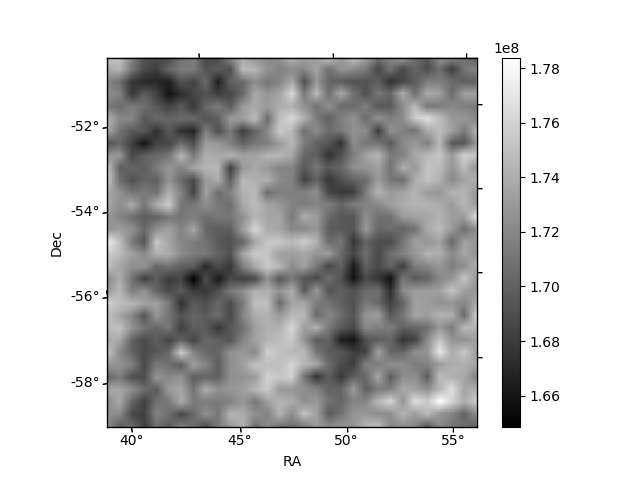
Histogram calculated using DETX and DETY for each event in the final _common_clean file
| Quadrant A |  |
 |
Quadrant B |
|---|---|---|---|
| Quadrant D |  |
 |
Quadrant C |
| Plot type | Count rate plots | Images |
|---|---|---|
| Comparison with Poisson distribution Blue bars denote a histogram of data divided into 1 sec bins. Red curve is a Poisson curve with rate = median count rate of data. |
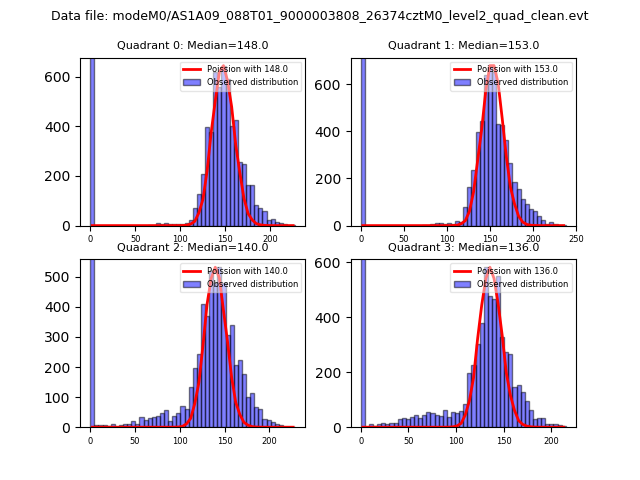 |
 |
| Quadrant-wise count rates Data is divided into 100 sec bins |
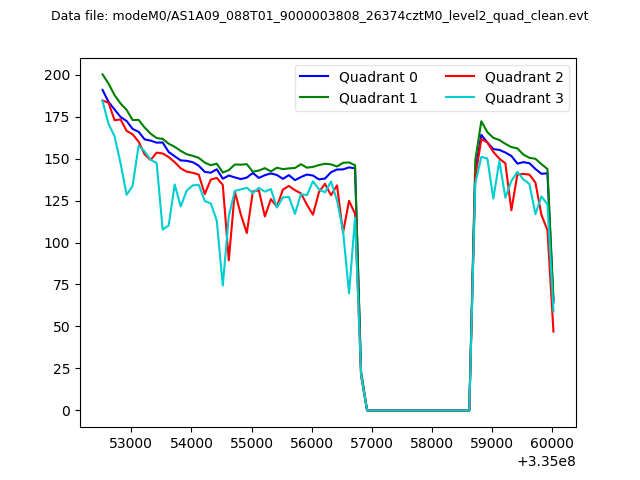 |
|
| Module-wise count rates for Quadrant A Data is divided into 100 sec bins |
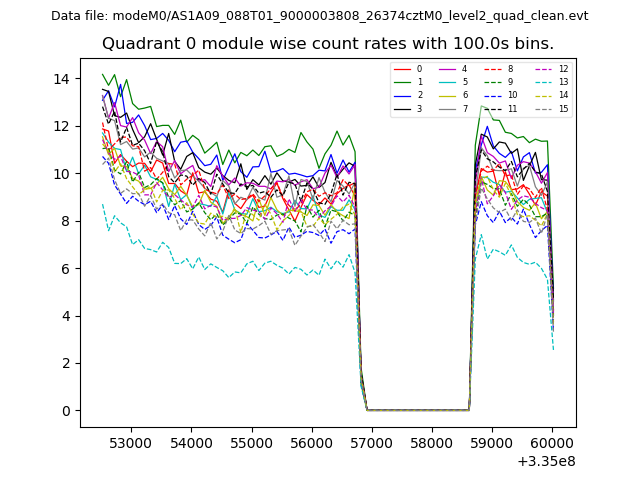 |
 |
| Module-wise count rates for Quadrant B Data is divided into 100 sec bins |
 |
 |
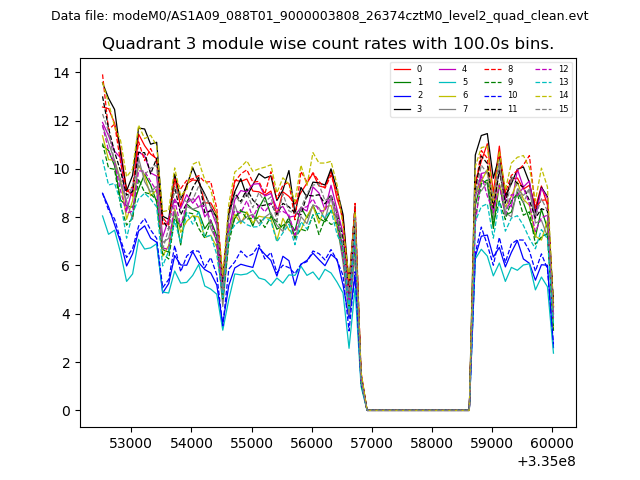
| Module-wise count rates for Quadrant C Data is divided into 100 sec bins |
 |
 |
| Module-wise count rates for Quadrant D Data is divided into 100 sec bins |
 |
 |
| Parameter | Plot |
|---|---|
| CZT HV Monitor |  |
| D_VDD | 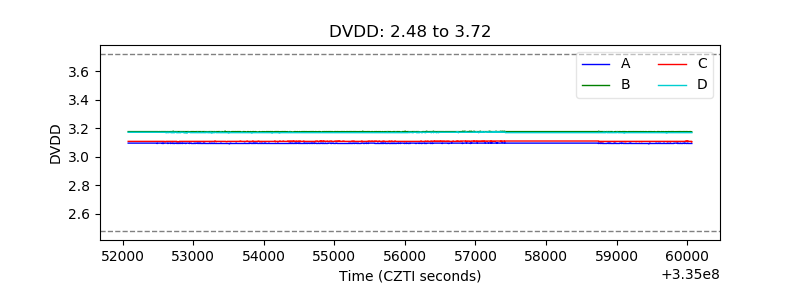 |
| Temperature 1 | 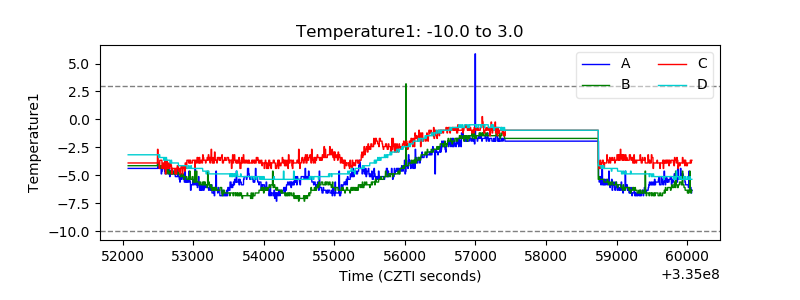 |
| Veto HV Monitor | 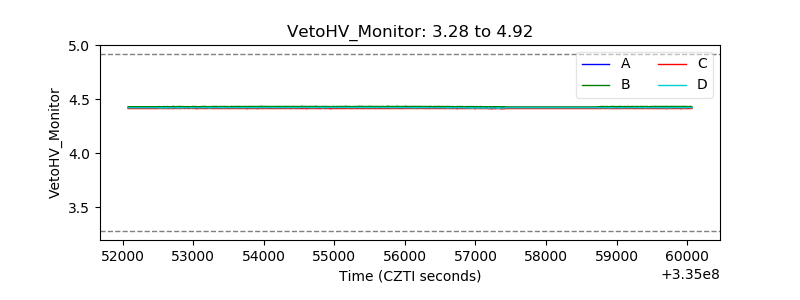 |
| Veto LLD | 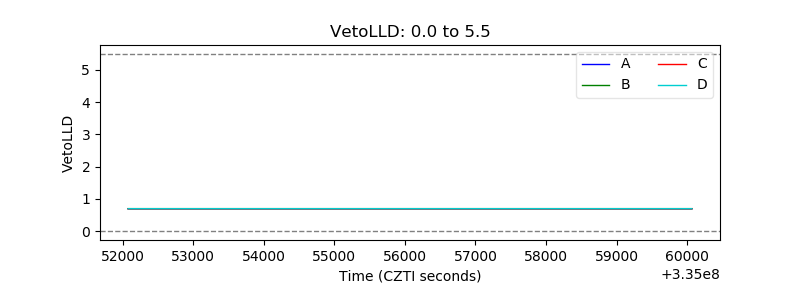 |
| Alpha Counter | 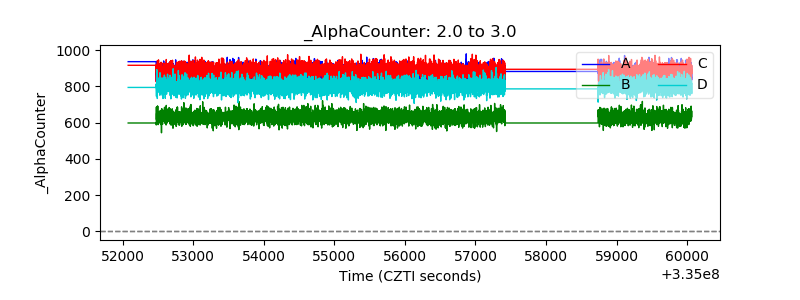 |
| _CPM_Rate | 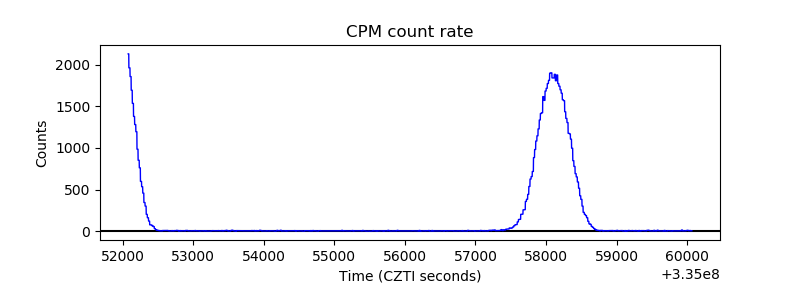 |
| CZT Counter | 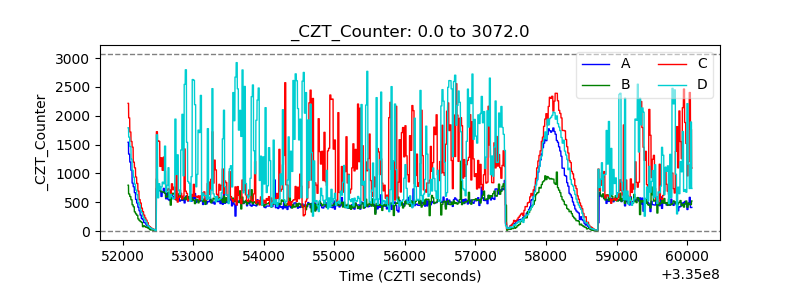 |
| +2.5 Volts monitor |  |
| +5 Volts monitor | 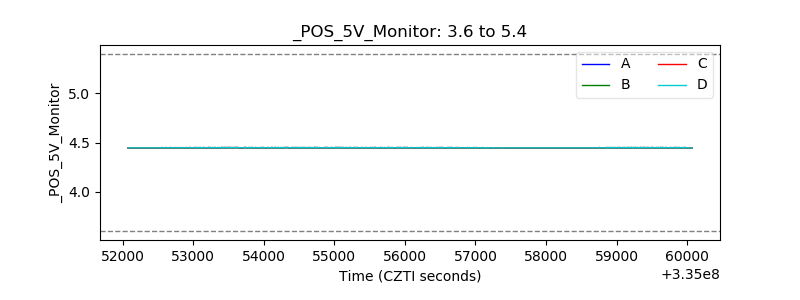 |
| _ROLL_ROT | 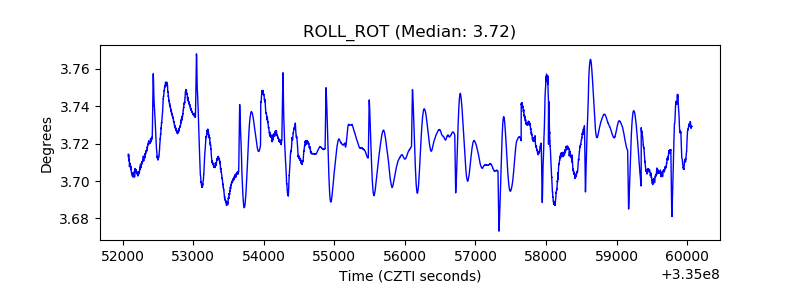 |
| _Roll_DEC | 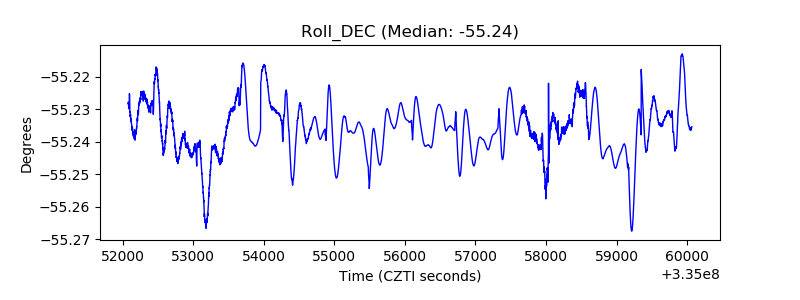 |
| _Roll_RA | 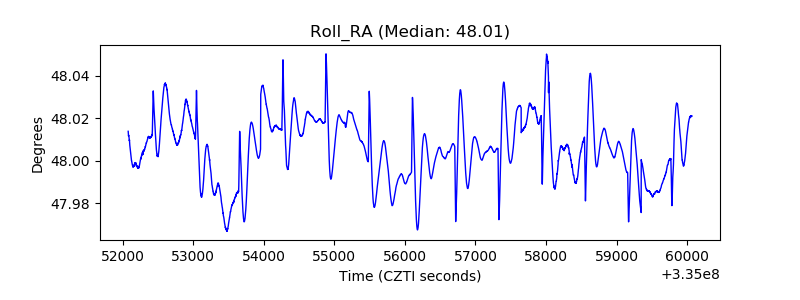 |
| Veto Counter | 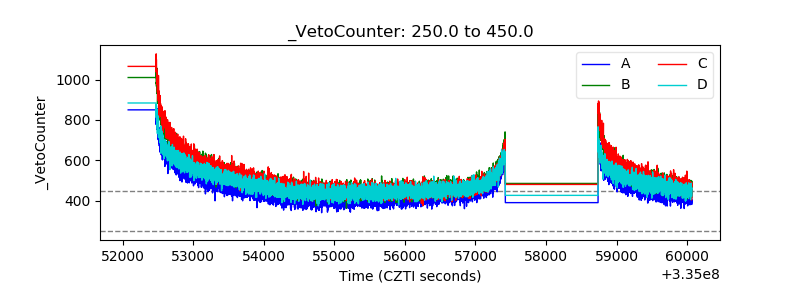 |