| Param | Original file | Final file |
|---|---|---|
| Filename | modeM0/AS1A09_088T01_9000003808_26382cztM0_level2.evt | modeM0/AS1A09_088T01_9000003808_26382cztM0_level2_quad_clean.evt |
| Size (bytes) | 2,383,747,200 | 297,498,240 |
| Size | 2.2 GB | 283.7 MB |
| Events in quadrant A | 11,332,347 | 1,949,471 |
| Events in quadrant B | 10,573,954 | 1,996,507 |
| Events in quadrant C | 26,904,722 | 1,708,116 |
| Events in quadrant D | 21,872,358 | 1,810,136 |
| Mode M9 | |||
|---|---|---|---|
| Quadrant | BADHDUFLAG | Total packets | Discarded packets |
| A | 0 | 27 | 0 |
| B | 0 | 27 | 0 |
| C | 0 | 27 | 0 |
| D | 0 | 27 | 0 |
| Mode M0 | |||
|---|---|---|---|
| Quadrant | BADHDUFLAG | Total packets | Discarded packets |
| A | 0 | 48540 | 0 |
| B | 0 | 45962 | 0 |
| C | 0 | 95590 | 0 |
| D | 0 | 80052 | 0 |
| Quadrant | Total seconds | Saturated seconds | Saturation percentage |
|---|---|---|---|
| A | 22436 | 488 | 2.175076% |
| B | 22436 | 306 | 1.363879% |
| C | 22436 | 5941 | 26.479765% |
| D | 22436 | 3017 | 13.447139% |
Noise dominated data is calculated using 1-second bins in cleaned event files. If a bin has >2000 counts, and if more than 50% of those come from <1% of pixels, then it is considered to be noise-dominated and hence unusable.
| Quadrant | # 1 sec bins | Bins with >0 counts | Bins with >2000 counts | High rate bins dominated by noise | Noise dominated (total time) | Noise dominated (detector-on time) | Marked lightcurve |
|---|---|---|---|---|---|---|---|
| A | 25111 | 22437 | 157 | 157 | 0.63% | 0.70% | 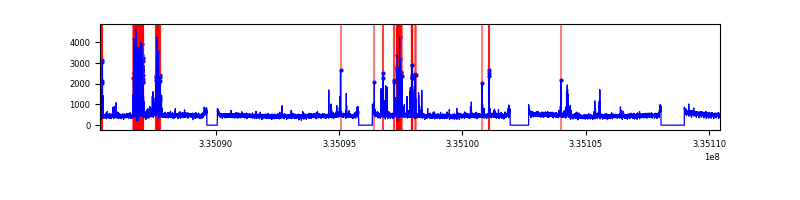 |
| B | 25111 | 22437 | 5 | 5 | 0.02% | 0.02% | 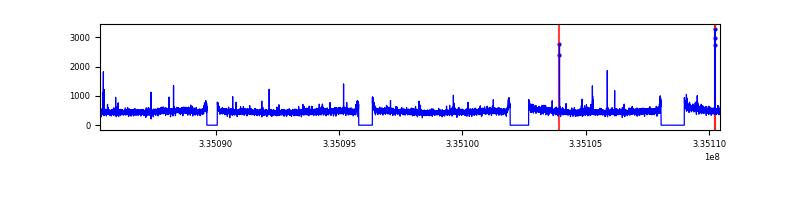 |
| C | 25111 | 22437 | 3465 | 3465 | 13.80% | 15.44% | 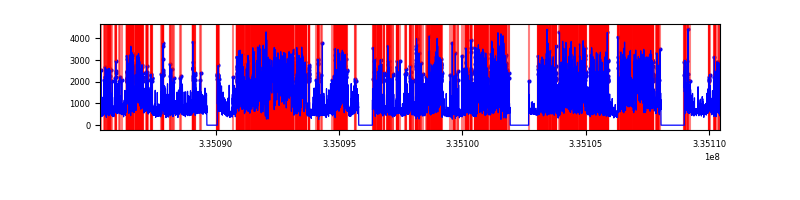 |
| D | 25111 | 22436 | 2438 | 2438 | 9.71% | 10.87% | 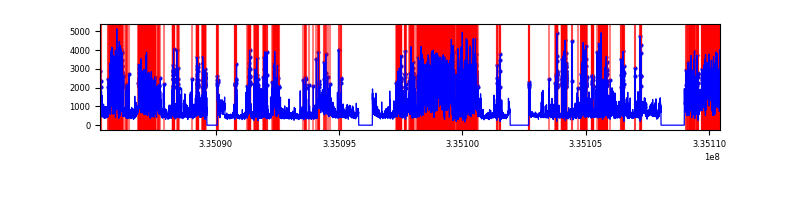 |
Top three noisy pixels from each quadrant. If the there are fewer than three noisy pixels in the level2.evt file, extra rows are filled as -1
| Pixel properties | Quadrant properties | ||||||
|---|---|---|---|---|---|---|---|
| Quadrant | DetID | PixID | Counts | Sigma | Mean | Median | Sigma |
| A | 0 | 13 | 1024877 | 1923.37 | 2671 | 2613 | 531.5 |
| A | 13 | 254 | 37128 | 64.94 | 2671 | 2613 | 531.5 |
| A | 3 | 137 | 25359 | 42.8 | 2671 | 2613 | 531.5 |
| B | 0 | 230 | 87649 | 167.7 | 2670 | 2601 | 507.1 |
| B | 12 | 111 | 62207 | 117.53 | 2670 | 2601 | 507.1 |
| B | 11 | 111 | 56099 | 105.49 | 2670 | 2601 | 507.1 |
| C | 3 | 233 | 17213603 | 31548.61 | 2342 | 2356 | 545.5 |
| C | 14 | 238 | 370334 | 674.51 | 2342 | 2356 | 545.5 |
| C | 2 | 16 | 123929 | 222.85 | 2342 | 2356 | 545.5 |
| D | 1 | 52 | 6155667 | 10438.99 | 2485 | 2421 | 589.4 |
| D | 7 | 80 | 5718491 | 9697.32 | 2485 | 2421 | 589.4 |
| D | 11 | 176 | 417888 | 704.84 | 2485 | 2421 | 589.4 |
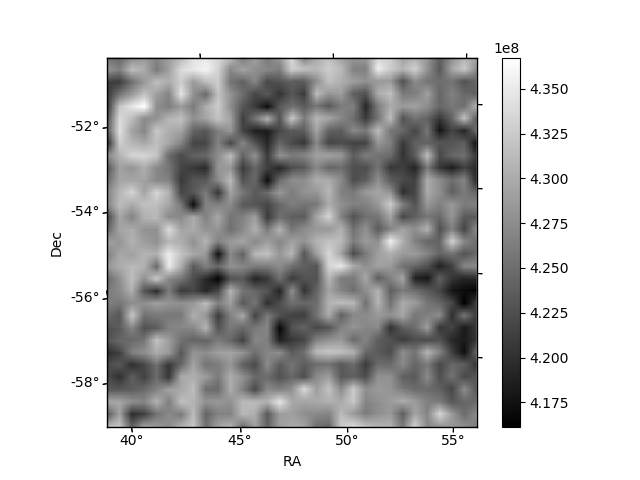
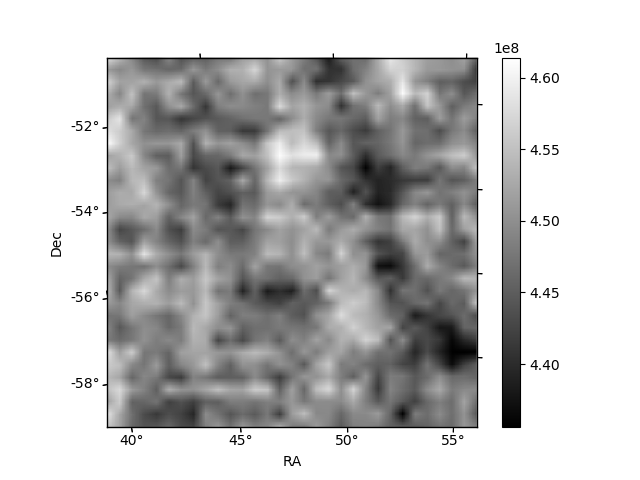
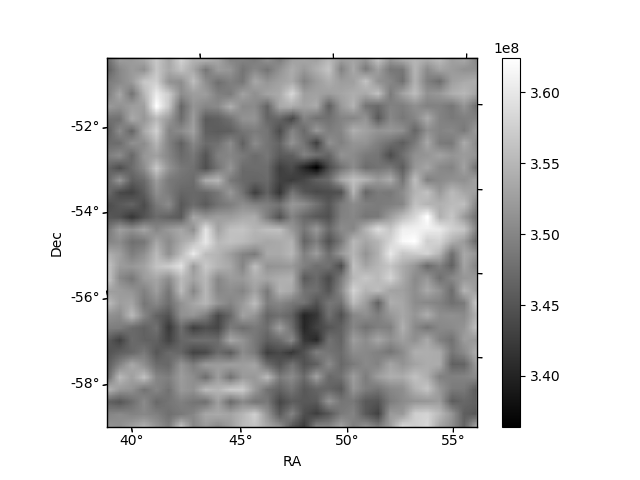
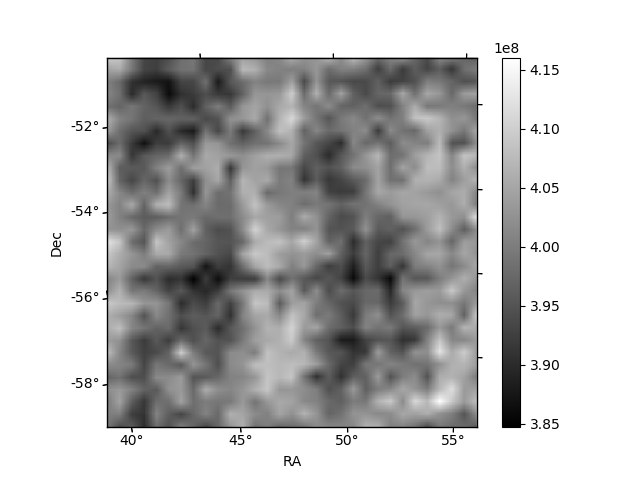
Histogram calculated using DETX and DETY for each event in the final _common_clean file
| Quadrant A | 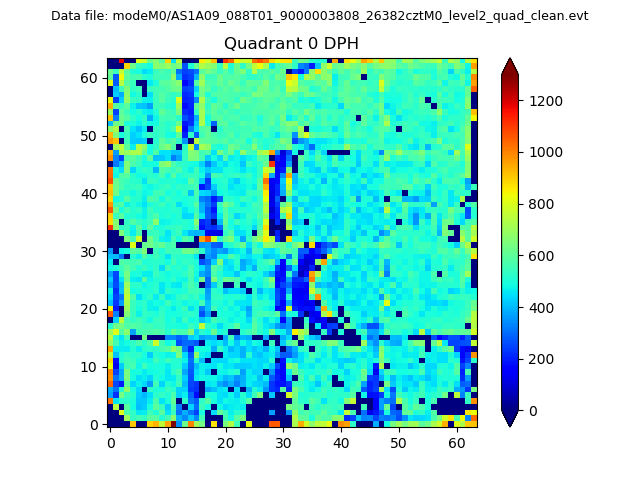 |
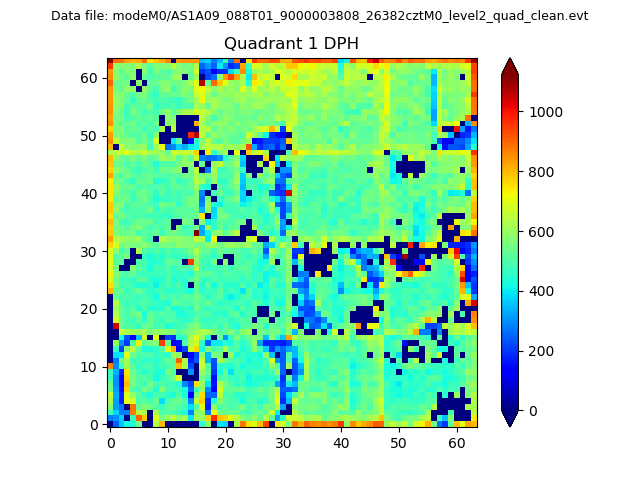 |
Quadrant B |
|---|---|---|---|
| Quadrant D | 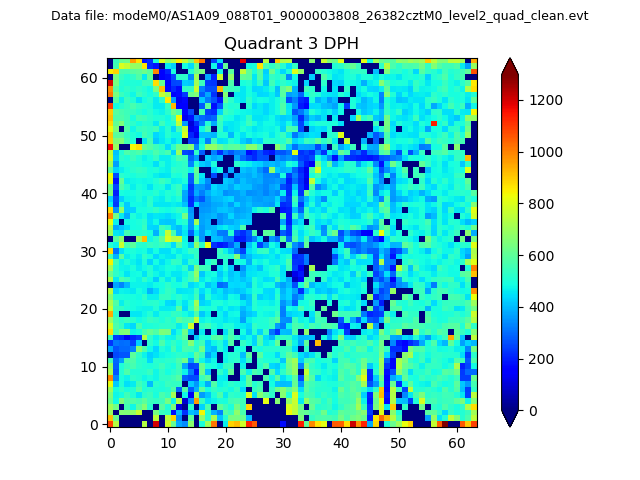 |
 |
Quadrant C |
| Plot type | Count rate plots | Images |
|---|---|---|
| Comparison with Poisson distribution Blue bars denote a histogram of data divided into 1 sec bins. Red curve is a Poisson curve with rate = median count rate of data. |
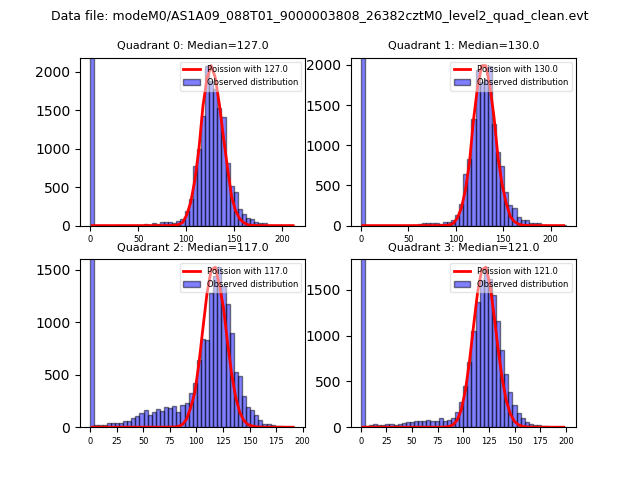 |
 |
| Quadrant-wise count rates Data is divided into 100 sec bins |
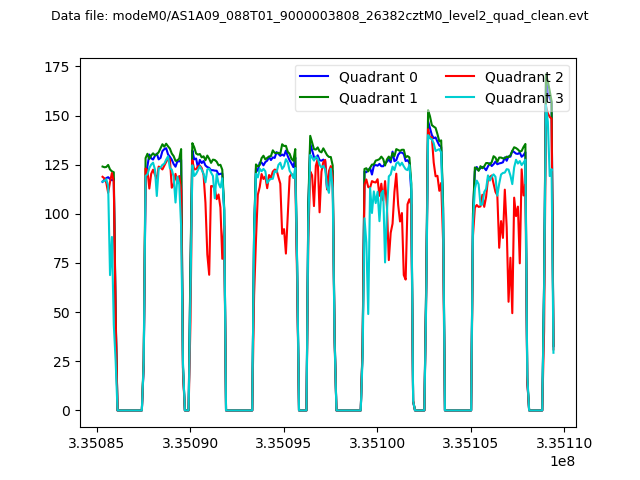 |
|
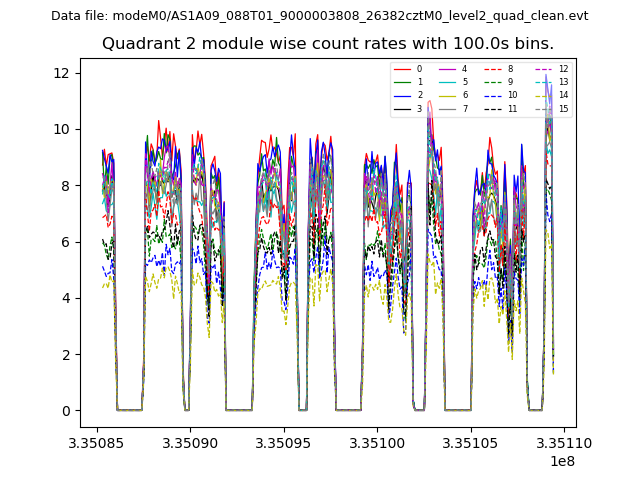
| Module-wise count rates for Quadrant A Data is divided into 100 sec bins |
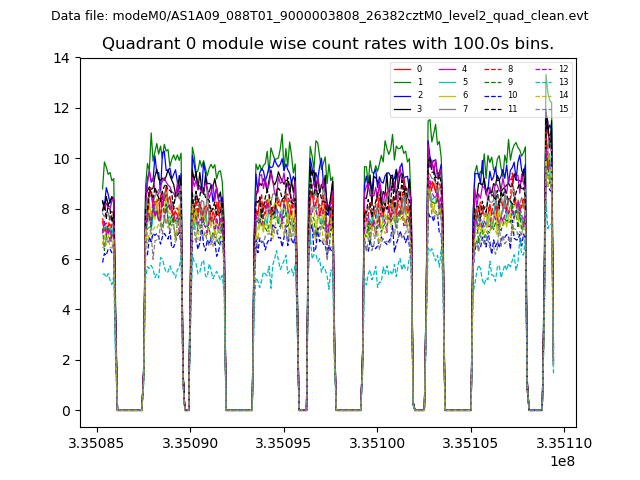 |
 |
| Module-wise count rates for Quadrant B Data is divided into 100 sec bins |
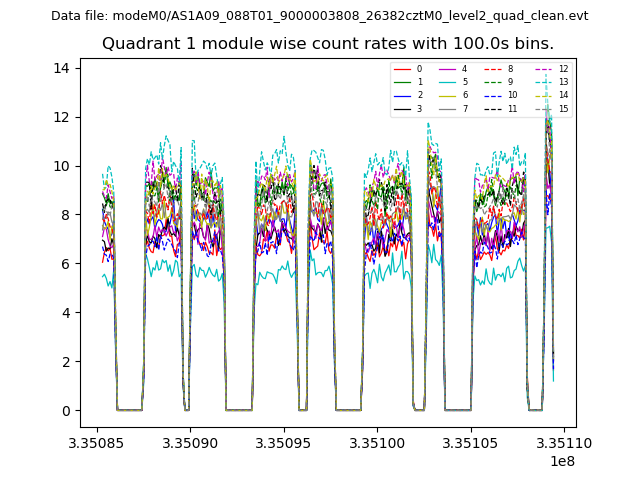 |
 |
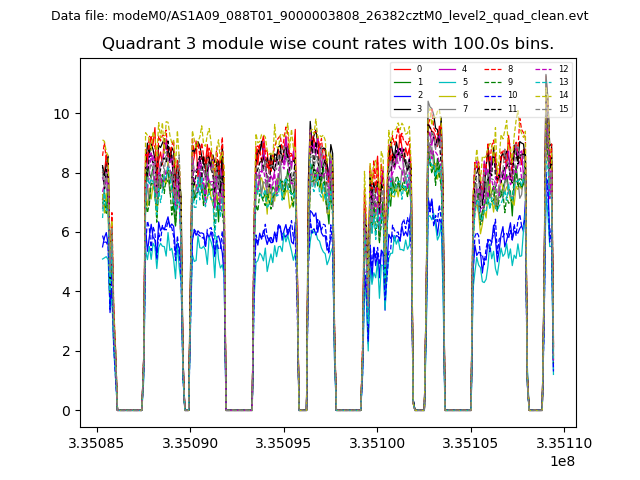
| Module-wise count rates for Quadrant C Data is divided into 100 sec bins |
 |
 |
| Module-wise count rates for Quadrant D Data is divided into 100 sec bins |
 |
 |
| Parameter | Plot |
|---|---|
| CZT HV Monitor | 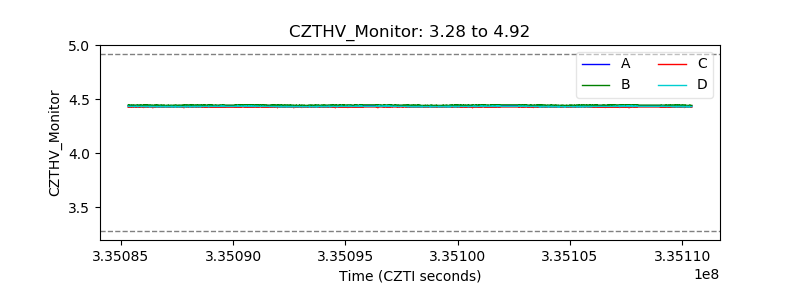 |
| D_VDD | 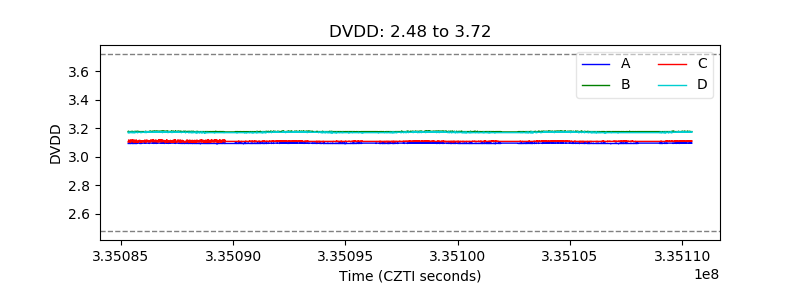 |
| Temperature 1 | 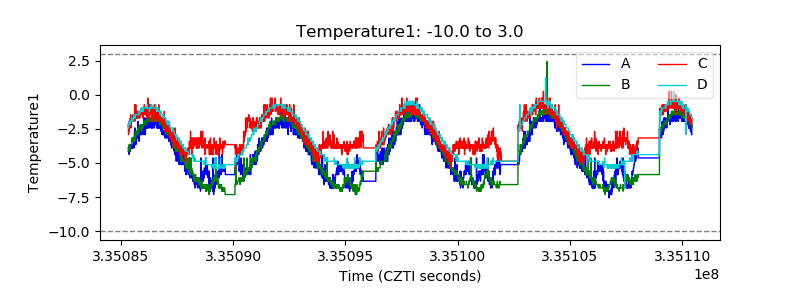 |
| Veto HV Monitor | 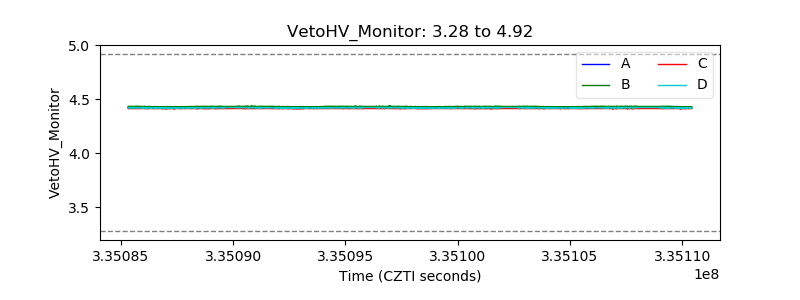 |
| Veto LLD | 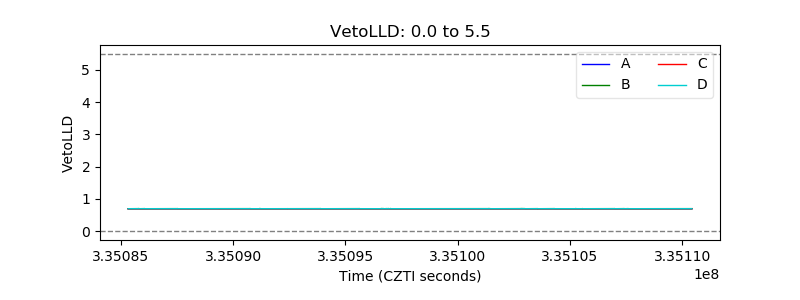 |
| Alpha Counter | 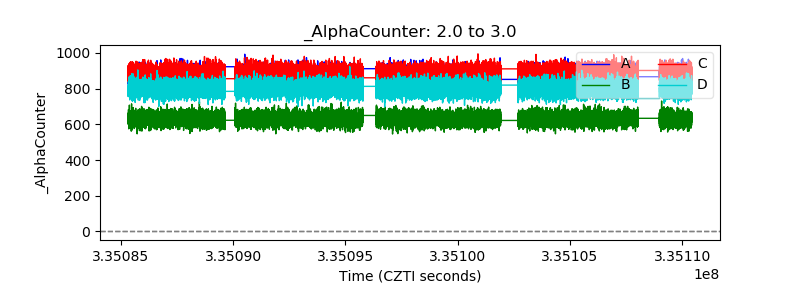 |
| _CPM_Rate | 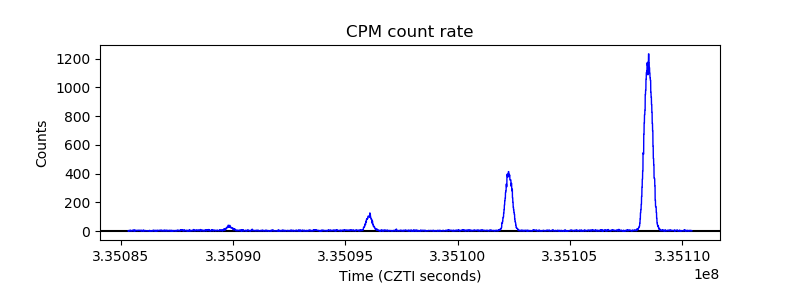 |
| CZT Counter |  |
| +2.5 Volts monitor |  |
| +5 Volts monitor | 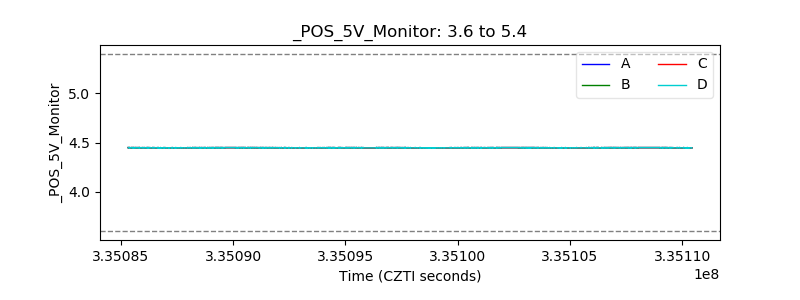 |
| _ROLL_ROT | 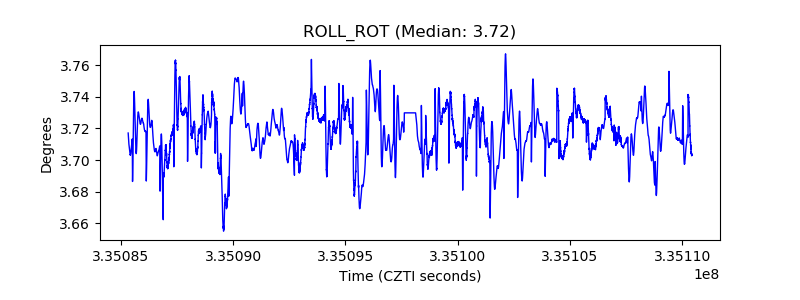 |
| _Roll_DEC | 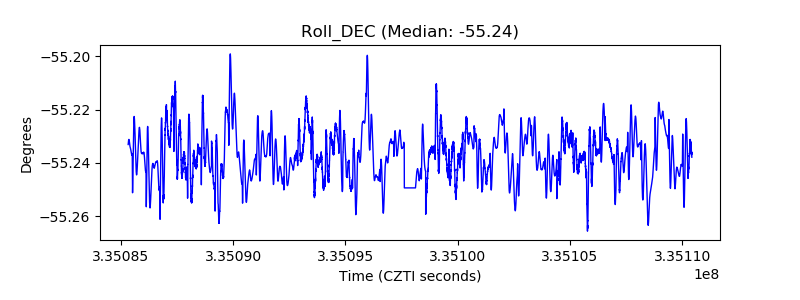 |
| _Roll_RA | 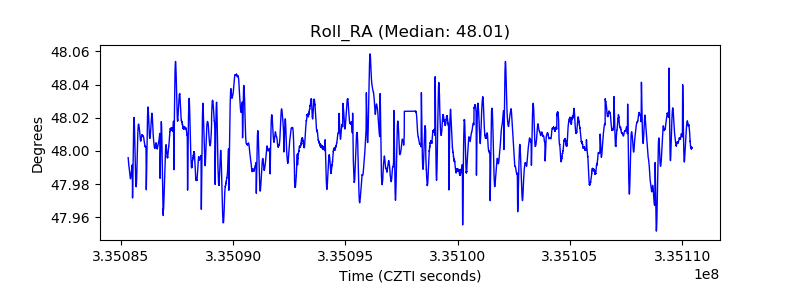 |
| Veto Counter | 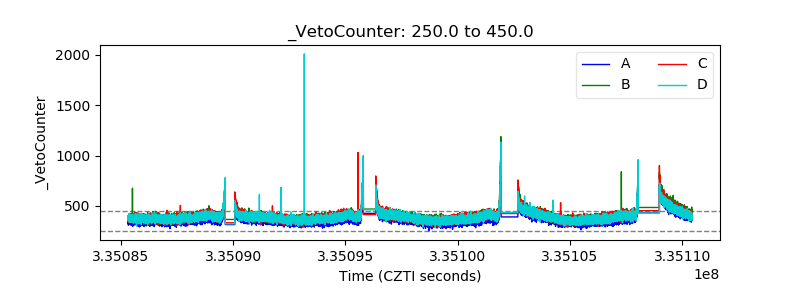 |