| Param | Original file | Final file |
|---|---|---|
| Filename | modeM0/AS1A09_088T01_9000003808_26383cztM0_level2.evt | modeM0/AS1A09_088T01_9000003808_26383cztM0_level2_quad_clean.evt |
| Size (bytes) | 710,956,800 | 72,115,200 |
| Size | 678.0 MB | 68.8 MB |
| Events in quadrant A | 3,191,564 | 458,856 |
| Events in quadrant B | 3,276,316 | 464,007 |
| Events in quadrant C | 6,416,151 | 412,998 |
| Events in quadrant D | 8,213,944 | 399,618 |
| Mode M9 | |||
|---|---|---|---|
| Quadrant | BADHDUFLAG | Total packets | Discarded packets |
| A | 0 | 11 | 0 |
| B | 0 | 11 | 0 |
| C | 0 | 11 | 0 |
| D | 0 | 11 | 0 |
| Mode M0 | |||
|---|---|---|---|
| Quadrant | BADHDUFLAG | Total packets | Discarded packets |
| A | 0 | 13703 | 0 |
| B | 0 | 13817 | 0 |
| C | 0 | 23671 | 0 |
| D | 0 | 28842 | 0 |
| Quadrant | Total seconds | Saturated seconds | Saturation percentage |
|---|---|---|---|
| A | 6414 | 43 | 0.670408% |
| B | 6414 | 67 | 1.044590% |
| C | 6415 | 836 | 13.031956% |
| D | 6415 | 1445 | 22.525331% |
Noise dominated data is calculated using 1-second bins in cleaned event files. If a bin has >2000 counts, and if more than 50% of those come from <1% of pixels, then it is considered to be noise-dominated and hence unusable.
| Quadrant | # 1 sec bins | Bins with >0 counts | Bins with >2000 counts | High rate bins dominated by noise | Noise dominated (total time) | Noise dominated (detector-on time) | Marked lightcurve |
|---|---|---|---|---|---|---|---|
| A | 7509 | 6414 | 2 | 2 | 0.03% | 0.03% | 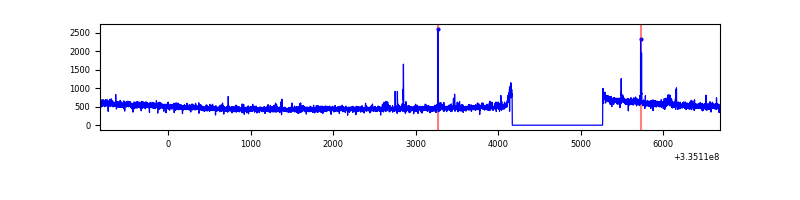 |
| B | 7509 | 6415 | 17 | 17 | 0.23% | 0.27% | 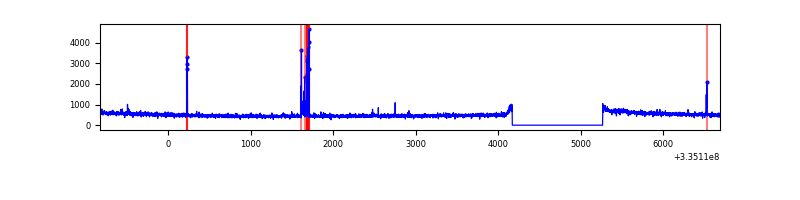 |
| C | 7509 | 6415 | 390 | 390 | 5.19% | 6.08% | 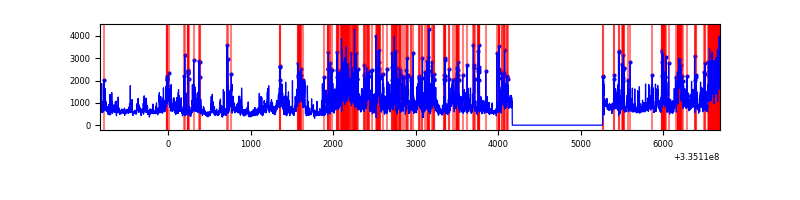 |
| D | 7510 | 6416 | 1193 | 1193 | 15.89% | 18.59% | 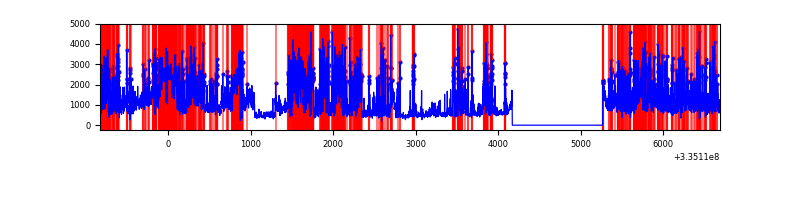 |
Top three noisy pixels from each quadrant. If the there are fewer than three noisy pixels in the level2.evt file, extra rows are filled as -1
| Pixel properties | Quadrant properties | ||||||
|---|---|---|---|---|---|---|---|
| Quadrant | DetID | PixID | Counts | Sigma | Mean | Median | Sigma |
| A | 0 | 13 | 56551 | 344.14 | 813 | 796 | 162.0 |
| A | 13 | 254 | 11116 | 63.7 | 813 | 796 | 162.0 |
| A | 3 | 137 | 7341 | 40.4 | 813 | 796 | 162.0 |
| B | 0 | 245 | 89796 | 587.87 | 807 | 788 | 151.4 |
| B | 5 | 172 | 21442 | 136.41 | 807 | 788 | 151.4 |
| B | 0 | 230 | 18021 | 113.82 | 807 | 788 | 151.4 |
| C | 3 | 233 | 3358562 | 19594.47 | 742 | 746 | 171.4 |
| C | 14 | 238 | 121342 | 703.74 | 742 | 746 | 171.4 |
| C | 2 | 16 | 31101 | 177.14 | 742 | 746 | 171.4 |
| D | 7 | 80 | 3638606 | 21554.45 | 712 | 695 | 168.8 |
| D | 1 | 52 | 1762674 | 10439.64 | 712 | 695 | 168.8 |
| D | 12 | 233 | 55298 | 323.52 | 712 | 695 | 168.8 |
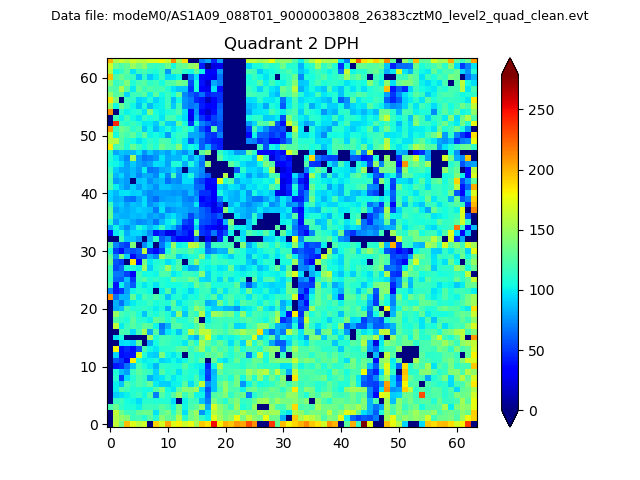
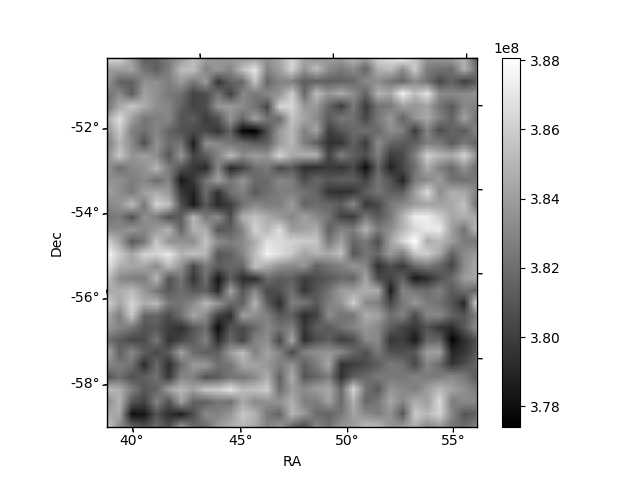
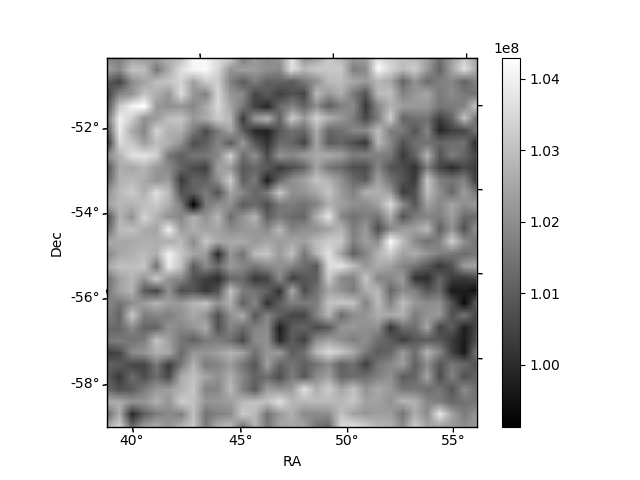
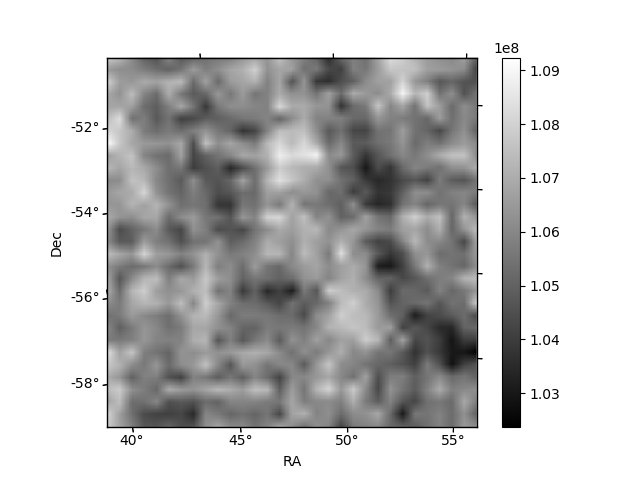
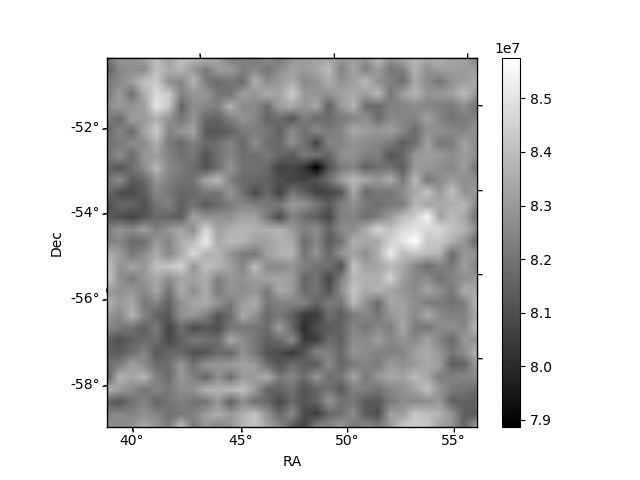
Histogram calculated using DETX and DETY for each event in the final _common_clean file
| Quadrant A | 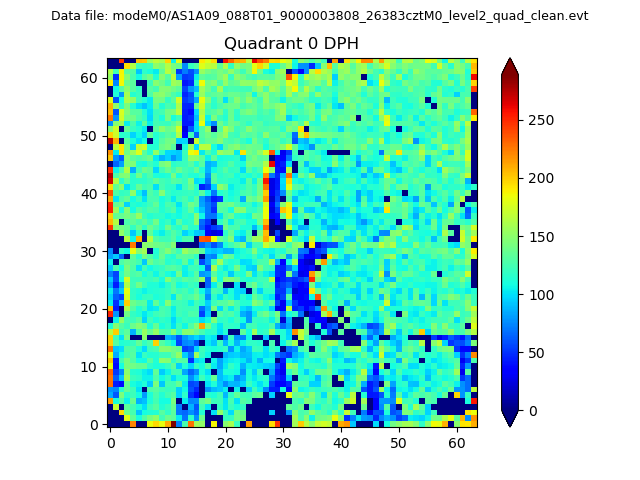 |
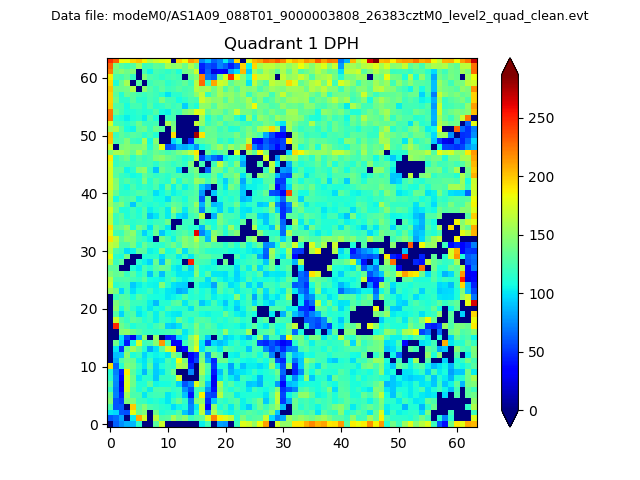 |
Quadrant B |
|---|---|---|---|
| Quadrant D | 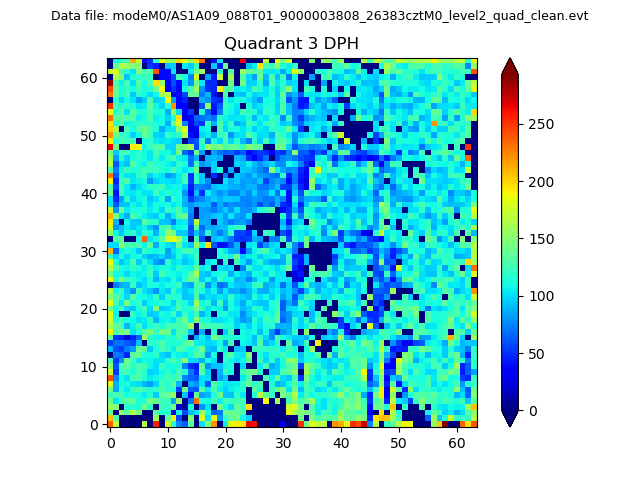 |
 |
Quadrant C |
| Plot type | Count rate plots | Images |
|---|---|---|
| Comparison with Poisson distribution Blue bars denote a histogram of data divided into 1 sec bins. Red curve is a Poisson curve with rate = median count rate of data. |
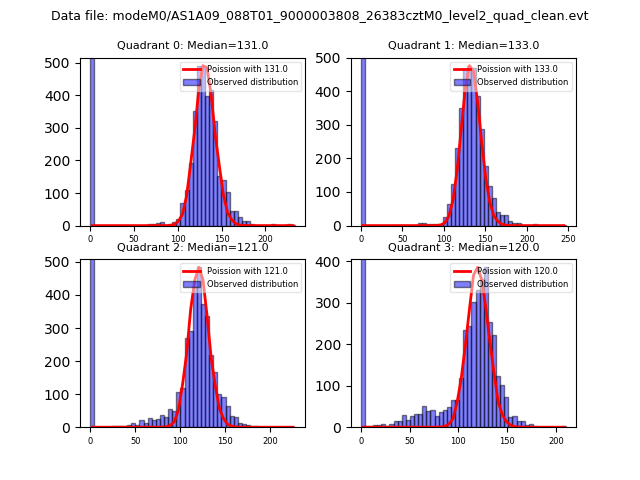 |
 |
| Quadrant-wise count rates Data is divided into 100 sec bins |
 |
|
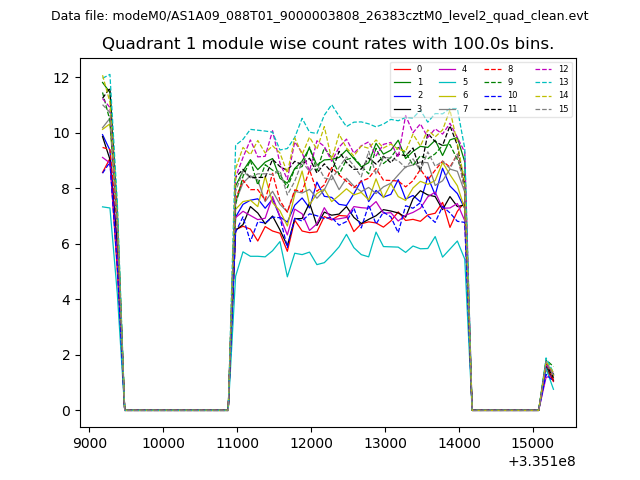
| Module-wise count rates for Quadrant A Data is divided into 100 sec bins |
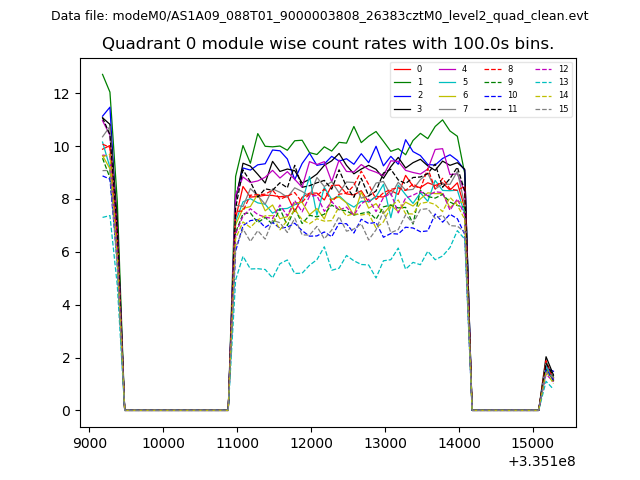 |
 |
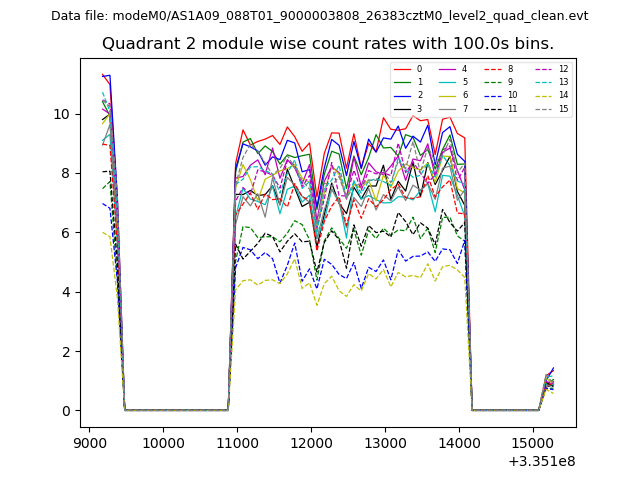
| Module-wise count rates for Quadrant B Data is divided into 100 sec bins |
 |
 |
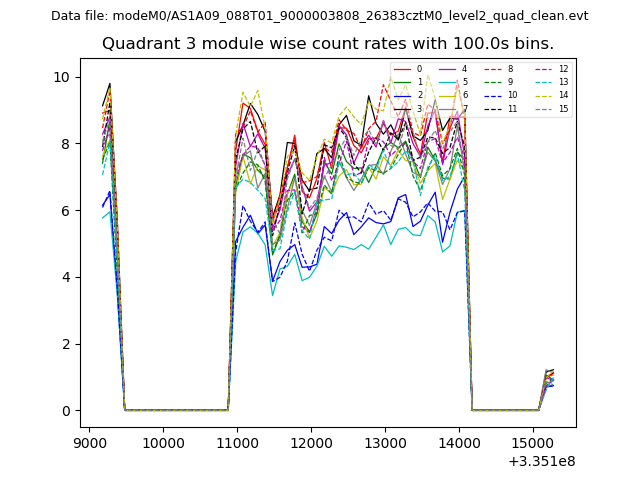
| Module-wise count rates for Quadrant C Data is divided into 100 sec bins |
 |
 |
| Module-wise count rates for Quadrant D Data is divided into 100 sec bins |
 |
 |
| Parameter | Plot |
|---|---|
| CZT HV Monitor | 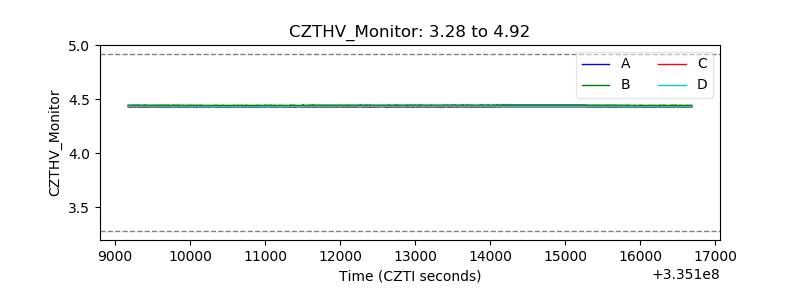 |
| D_VDD | 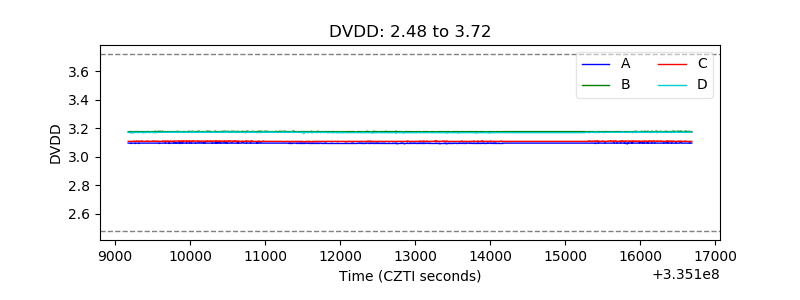 |
| Temperature 1 | 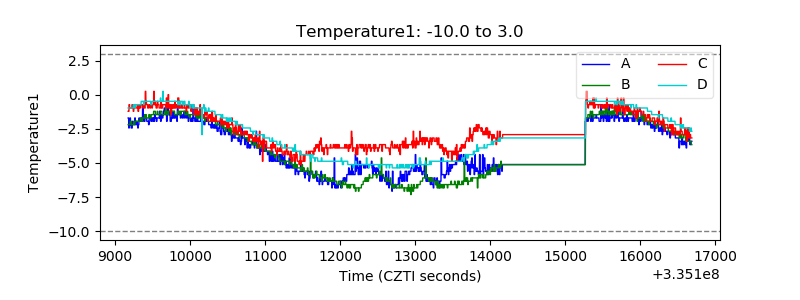 |
| Veto HV Monitor | 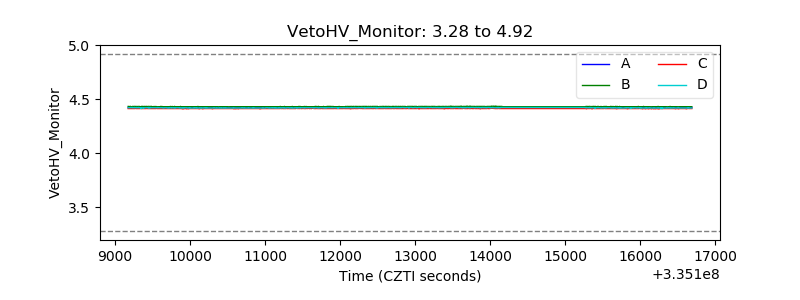 |
| Veto LLD | 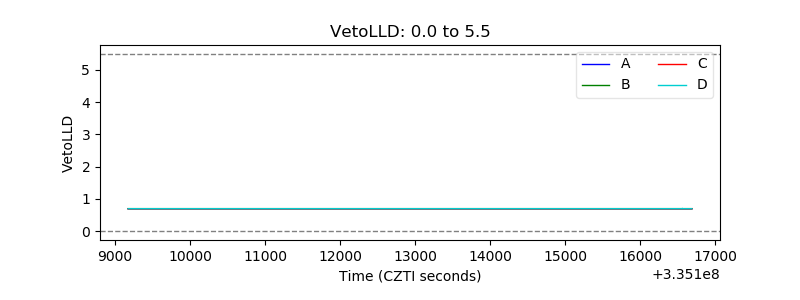 |
| Alpha Counter | 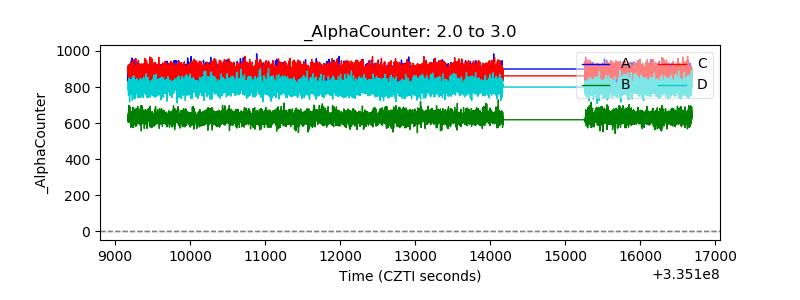 |
| _CPM_Rate | 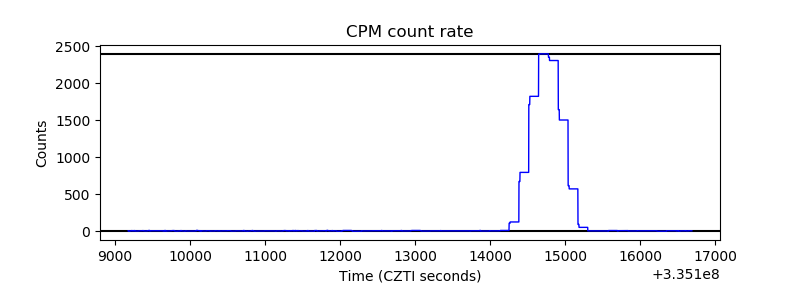 |
| CZT Counter | 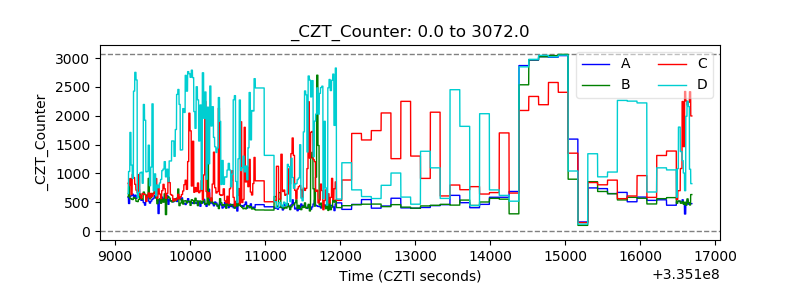 |
| +2.5 Volts monitor |  |
| +5 Volts monitor |  |
| _ROLL_ROT | 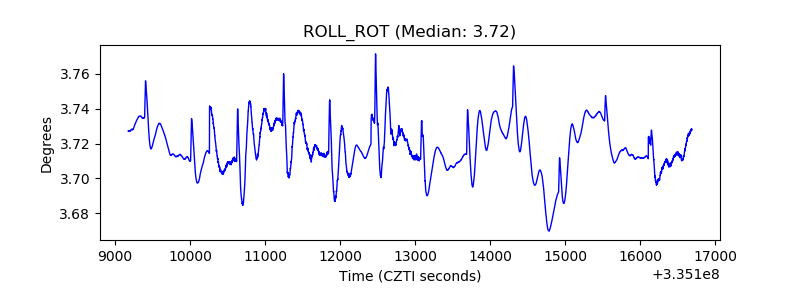 |
| _Roll_DEC | 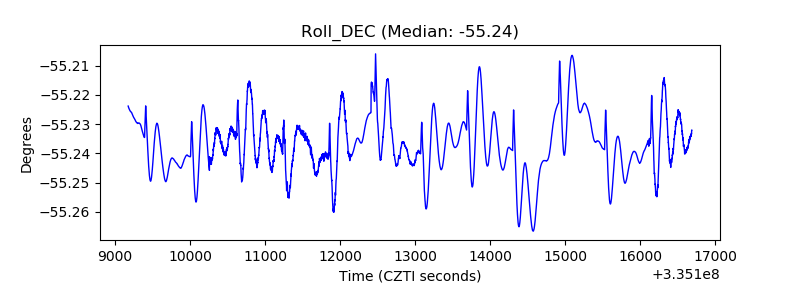 |
| _Roll_RA | 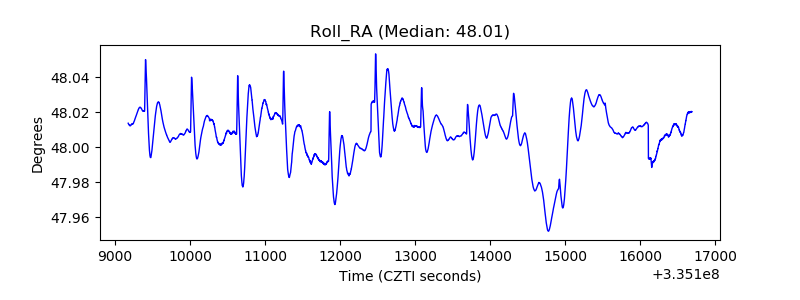 |
| Veto Counter | 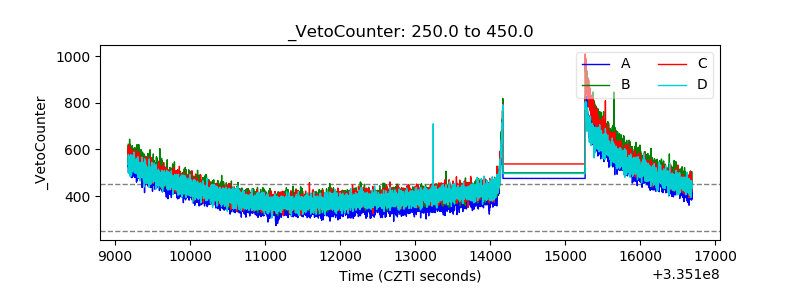 |