| Param | Original file | Final file |
|---|---|---|
| Filename | modeM0/AS1A09_088T01_9000003808_26385cztM0_level2.evt | modeM0/AS1A09_088T01_9000003808_26385cztM0_level2_quad_clean.evt |
| Size (bytes) | 662,316,480 | 77,883,840 |
| Size | 631.6 MB | 74.3 MB |
| Events in quadrant A | 3,300,370 | 499,234 |
| Events in quadrant B | 3,318,322 | 507,565 |
| Events in quadrant C | 6,828,142 | 449,701 |
| Events in quadrant D | 6,182,790 | 459,142 |
| Mode M9 | |||
|---|---|---|---|
| Quadrant | BADHDUFLAG | Total packets | Discarded packets |
| A | 0 | 13 | 0 |
| B | 0 | 14 | 0 |
| C | 0 | 14 | 0 |
| D | 0 | 14 | 0 |
| Mode M0 | |||
|---|---|---|---|
| Quadrant | BADHDUFLAG | Total packets | Discarded packets |
| A | 0 | 14050 | 0 |
| B | 0 | 13966 | 0 |
| C | 0 | 24739 | 0 |
| D | 0 | 22722 | 0 |
| Quadrant | Total seconds | Saturated seconds | Saturation percentage |
|---|---|---|---|
| A | 6337 | 61 | 0.962601% |
| B | 6337 | 63 | 0.994161% |
| C | 6337 | 1154 | 18.210510% |
| D | 6337 | 762 | 12.024617% |
Noise dominated data is calculated using 1-second bins in cleaned event files. If a bin has >2000 counts, and if more than 50% of those come from <1% of pixels, then it is considered to be noise-dominated and hence unusable.
| Quadrant | # 1 sec bins | Bins with >0 counts | Bins with >2000 counts | High rate bins dominated by noise | Noise dominated (total time) | Noise dominated (detector-on time) | Marked lightcurve |
|---|---|---|---|---|---|---|---|
| A | 7532 | 6337 | 3 | 3 | 0.04% | 0.05% |  |
| B | 7532 | 6337 | 2 | 2 | 0.03% | 0.03% |  |
| C | 7532 | 6338 | 520 | 520 | 6.90% | 8.20% |  |
| D | 7532 | 6338 | 553 | 553 | 7.34% | 8.73% |  |
Top three noisy pixels from each quadrant. If the there are fewer than three noisy pixels in the level2.evt file, extra rows are filled as -1
| Pixel properties | Quadrant properties | ||||||
|---|---|---|---|---|---|---|---|
| Quadrant | DetID | PixID | Counts | Sigma | Mean | Median | Sigma |
| A | 0 | 13 | 43893 | 259.68 | 844 | 831 | 165.8 |
| A | 13 | 254 | 10893 | 60.68 | 844 | 831 | 165.8 |
| A | 0 | 226 | 7440 | 39.85 | 844 | 831 | 165.8 |
| B | 12 | 111 | 17673 | 107.16 | 842 | 823 | 157.2 |
| B | 0 | 230 | 17652 | 107.03 | 842 | 823 | 157.2 |
| B | 11 | 111 | 16001 | 96.53 | 842 | 823 | 157.2 |
| C | 3 | 233 | 3709572 | 21342.07 | 759 | 765 | 173.8 |
| C | 14 | 238 | 124362 | 711.23 | 759 | 765 | 173.8 |
| C | 2 | 16 | 28670 | 160.58 | 759 | 765 | 173.8 |
| D | 7 | 80 | 1725995 | 9485.96 | 768 | 748 | 181.9 |
| D | 1 | 52 | 1366646 | 7510.14 | 768 | 748 | 181.9 |
| D | 12 | 233 | 61499 | 334.03 | 768 | 748 | 181.9 |
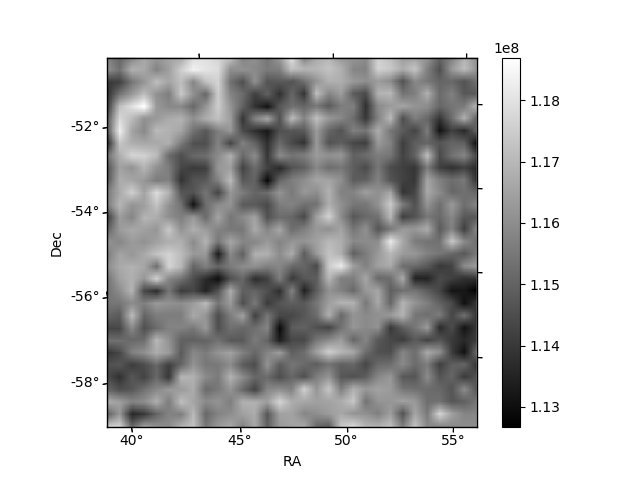
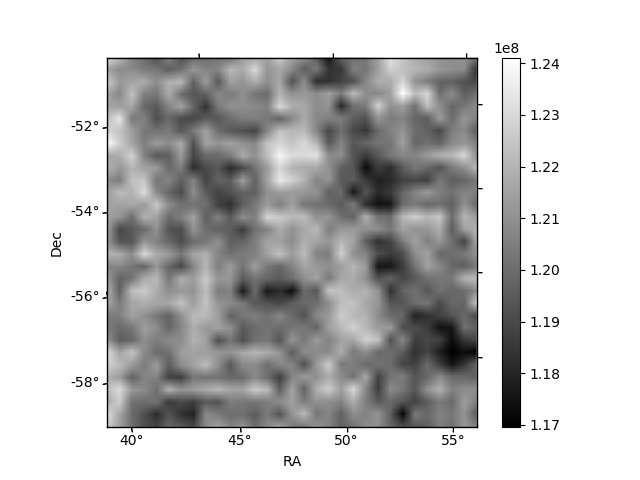
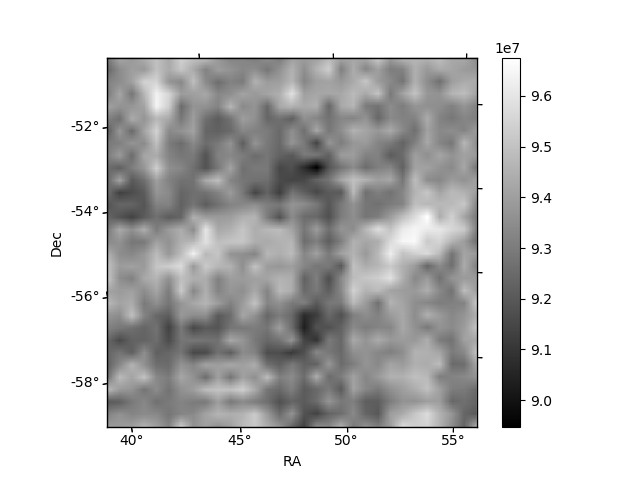
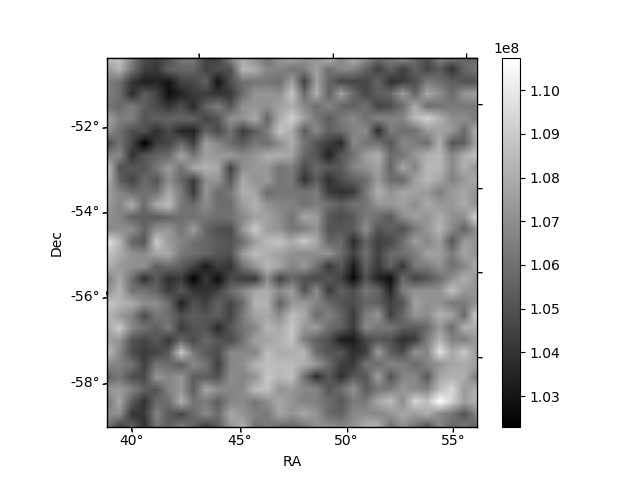
Histogram calculated using DETX and DETY for each event in the final _common_clean file
| Quadrant A | 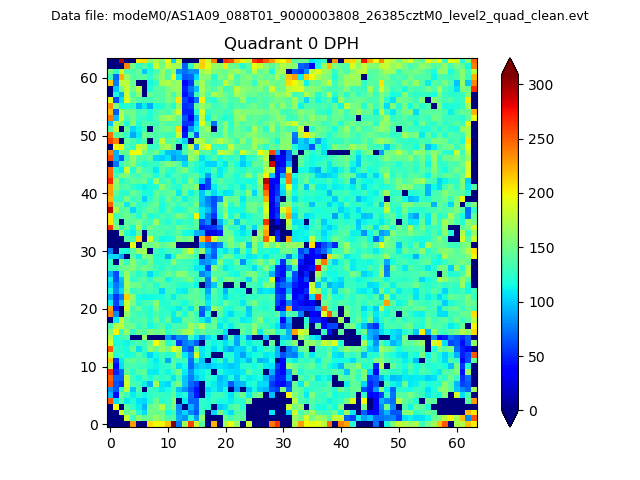 |
 |
Quadrant B |
|---|---|---|---|
| Quadrant D | 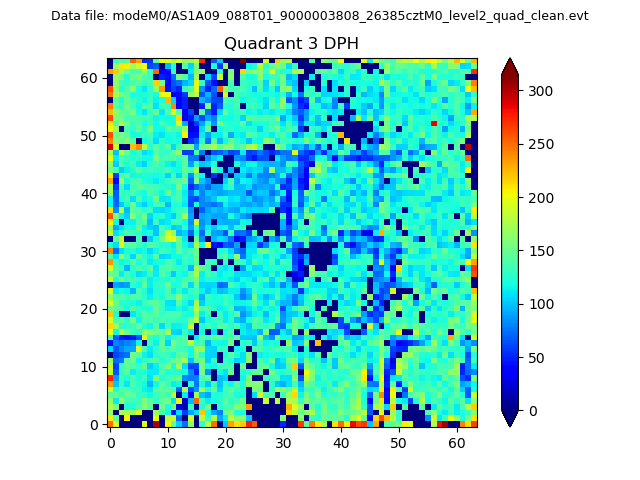 |
 |
Quadrant C |
| Plot type | Count rate plots | Images |
|---|---|---|
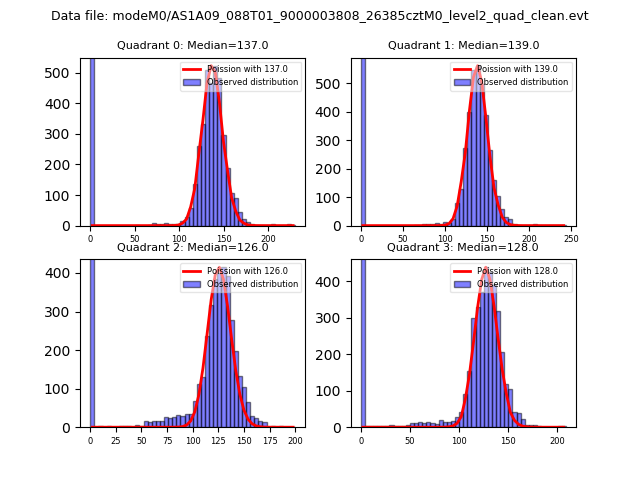
| Comparison with Poisson distribution Blue bars denote a histogram of data divided into 1 sec bins. Red curve is a Poisson curve with rate = median count rate of data. |
 |
 |
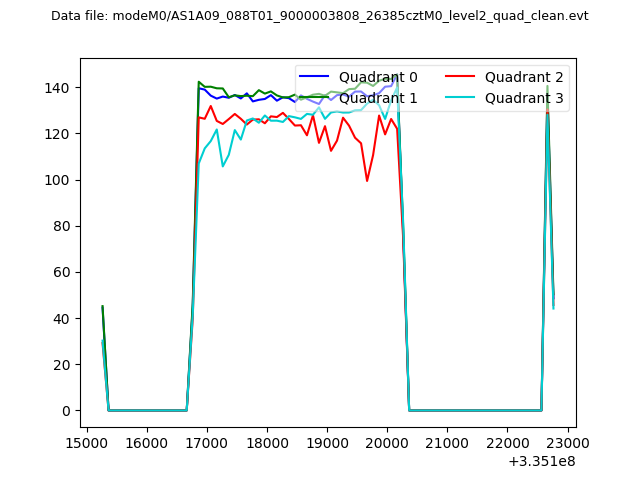
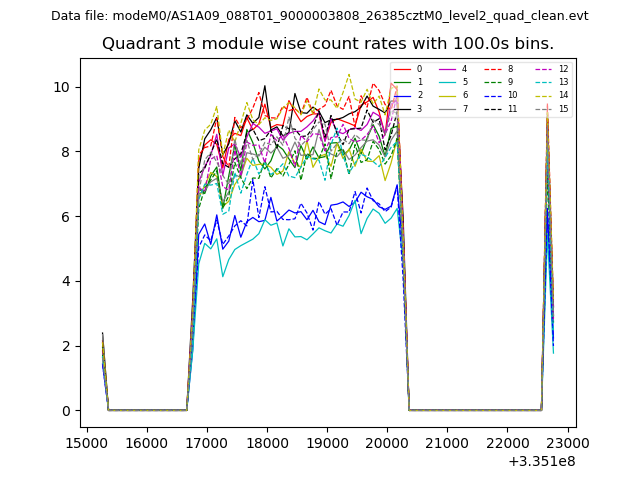
| Quadrant-wise count rates Data is divided into 100 sec bins |
 |
|
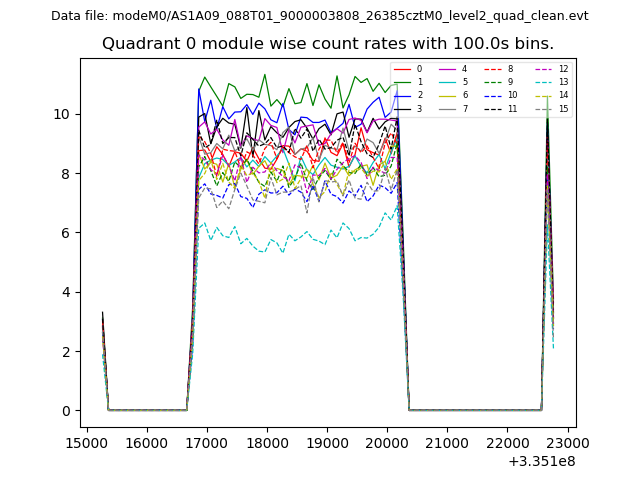
| Module-wise count rates for Quadrant A Data is divided into 100 sec bins |
 |
 |
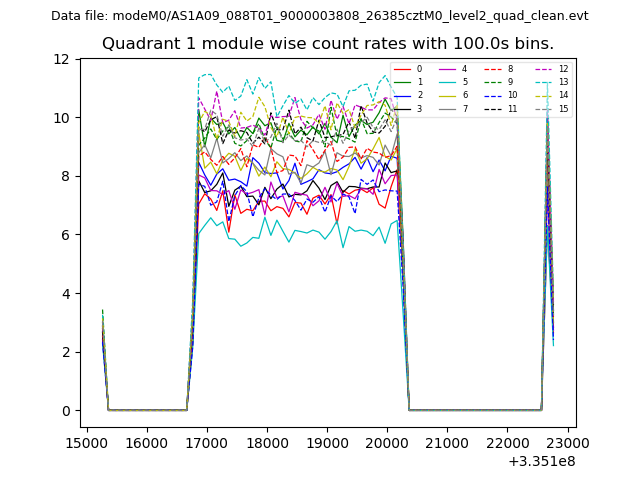
| Module-wise count rates for Quadrant B Data is divided into 100 sec bins |
 |
 |
| Module-wise count rates for Quadrant C Data is divided into 100 sec bins |
 |
 |
| Module-wise count rates for Quadrant D Data is divided into 100 sec bins |
 |
 |
| Parameter | Plot |
|---|---|
| CZT HV Monitor | 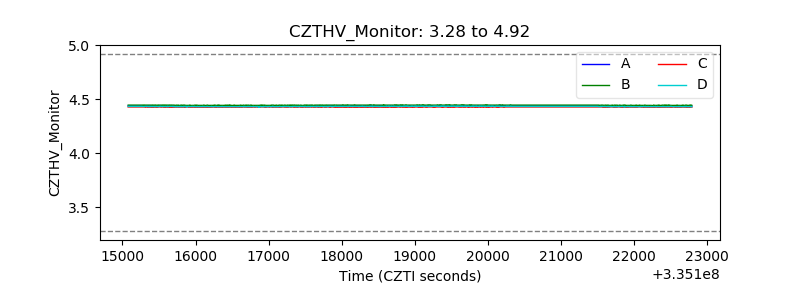 |
| D_VDD | 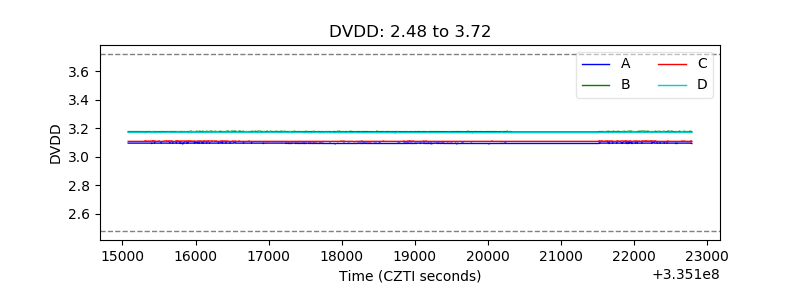 |
| Temperature 1 | 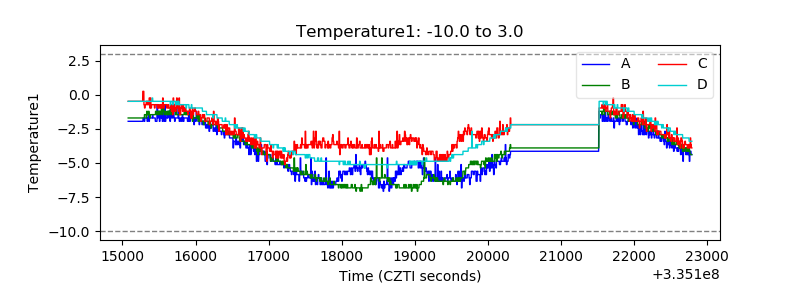 |
| Veto HV Monitor | 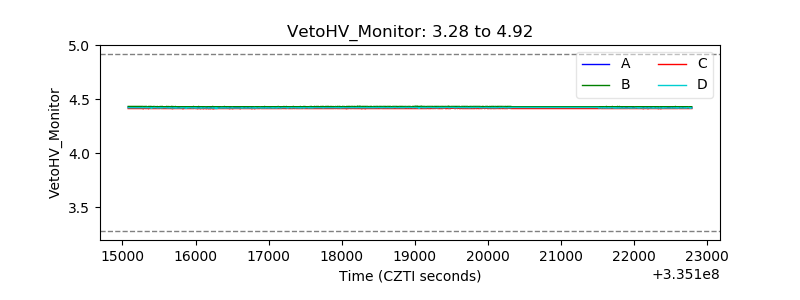 |
| Veto LLD | 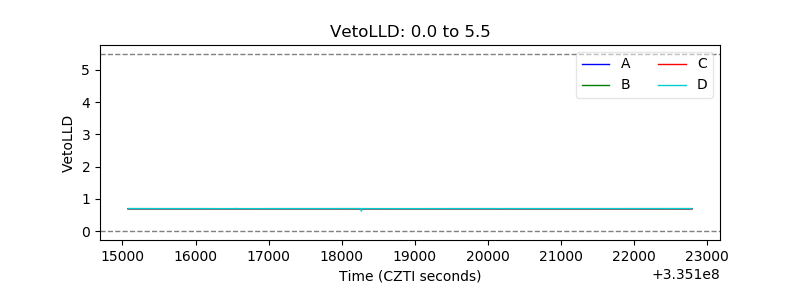 |
| Alpha Counter | 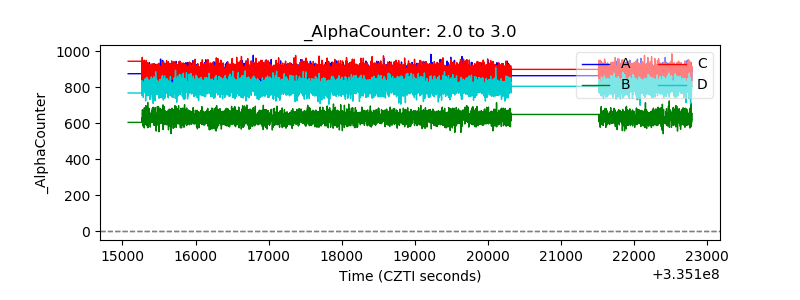 |
| _CPM_Rate | 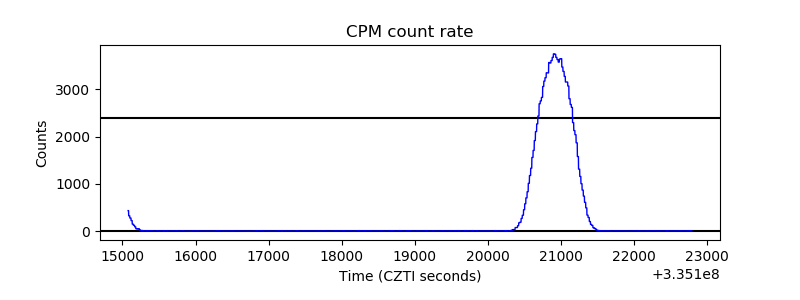 |
| CZT Counter | 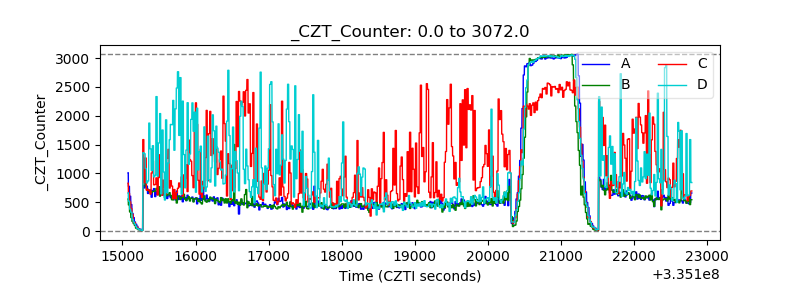 |
| +2.5 Volts monitor | 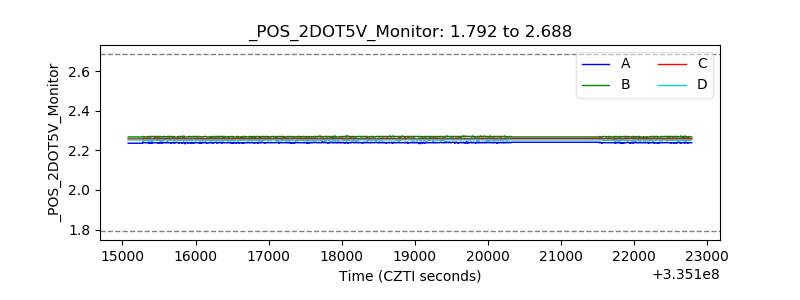 |
| +5 Volts monitor | 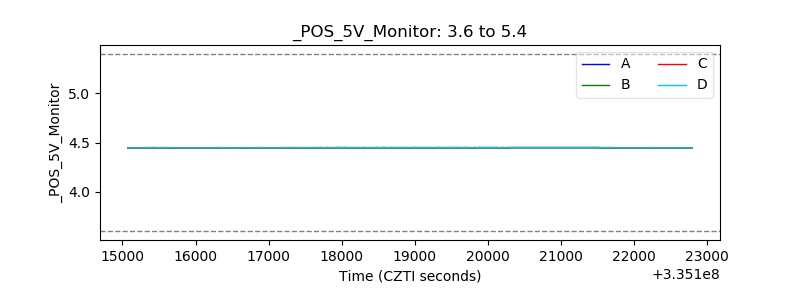 |
| _ROLL_ROT | 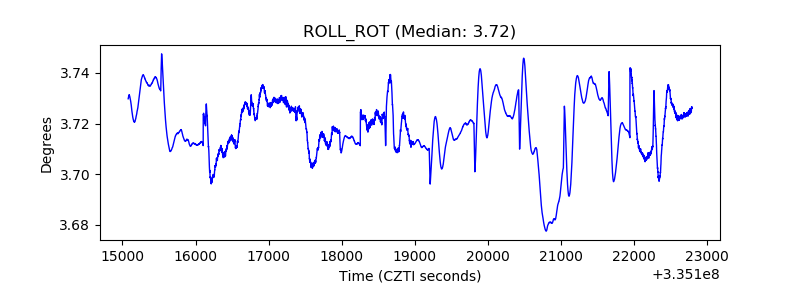 |
| _Roll_DEC | 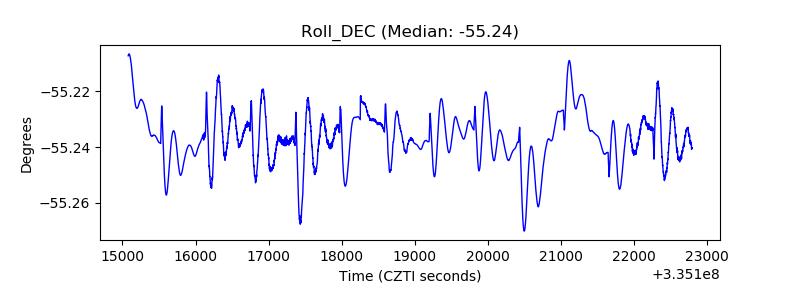 |
| _Roll_RA |  |
| Veto Counter | 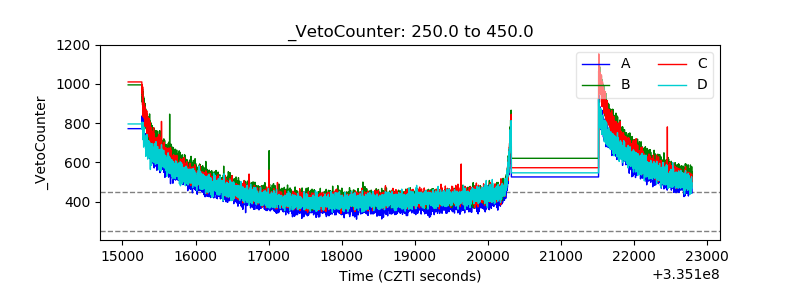 |