| Param | Original file | Final file |
|---|---|---|
| Filename | modeM0/AS1A09_088T01_9000003808_26386cztM0_level2.evt | modeM0/AS1A09_088T01_9000003808_26386cztM0_level2_quad_clean.evt |
| Size (bytes) | 605,096,640 | 96,704,640 |
| Size | 577.1 MB | 92.2 MB |
| Events in quadrant A | 3,338,949 | 644,675 |
| Events in quadrant B | 3,427,917 | 658,730 |
| Events in quadrant C | 5,061,535 | 604,585 |
| Events in quadrant D | 6,073,148 | 583,396 |
| Mode M9 | |||
|---|---|---|---|
| Quadrant | BADHDUFLAG | Total packets | Discarded packets |
| A | 0 | 18 | 0 |
| B | 0 | 19 | 0 |
| C | 0 | 19 | 0 |
| D | 0 | 19 | 0 |
| Mode M0 | |||
|---|---|---|---|
| Quadrant | BADHDUFLAG | Total packets | Discarded packets |
| A | 0 | 13974 | 0 |
| B | 0 | 14230 | 0 |
| C | 0 | 19273 | 0 |
| D | 0 | 22406 | 0 |
| Quadrant | Total seconds | Saturated seconds | Saturation percentage |
|---|---|---|---|
| A | 6260 | 57 | 0.910543% |
| B | 6260 | 75 | 1.198083% |
| C | 6260 | 529 | 8.450479% |
| D | 6260 | 770 | 12.300319% |
Noise dominated data is calculated using 1-second bins in cleaned event files. If a bin has >2000 counts, and if more than 50% of those come from <1% of pixels, then it is considered to be noise-dominated and hence unusable.
| Quadrant | # 1 sec bins | Bins with >0 counts | Bins with >2000 counts | High rate bins dominated by noise | Noise dominated (total time) | Noise dominated (detector-on time) | Marked lightcurve |
|---|---|---|---|---|---|---|---|
| A | 7560 | 6261 | 0 | 0 | 0.00% | 0.00% | 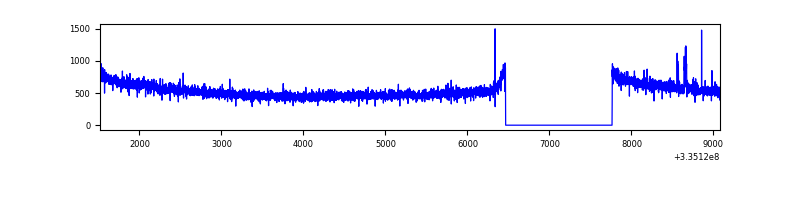 |
| B | 7560 | 6261 | 7 | 7 | 0.09% | 0.11% | 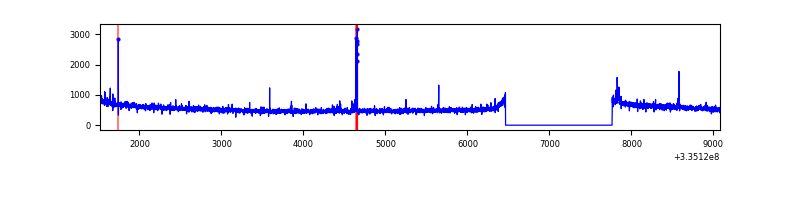 |
| C | 7560 | 6261 | 187 | 187 | 2.47% | 2.99% | 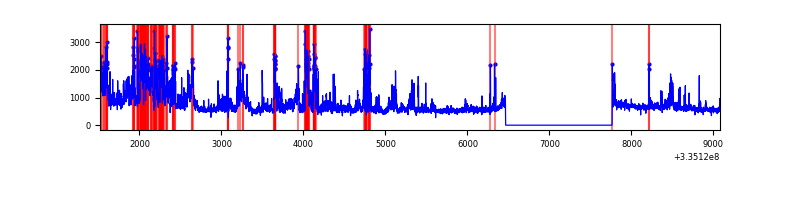 |
| D | 7560 | 6261 | 556 | 556 | 7.35% | 8.88% | 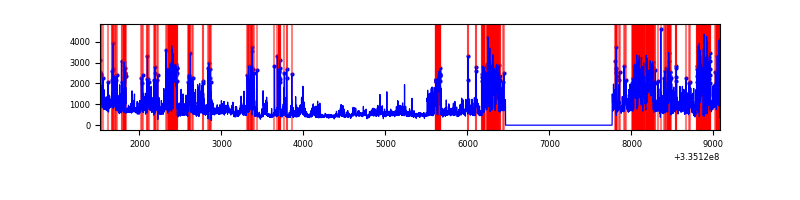 |
Top three noisy pixels from each quadrant. If the there are fewer than three noisy pixels in the level2.evt file, extra rows are filled as -1
| Pixel properties | Quadrant properties | ||||||
|---|---|---|---|---|---|---|---|
| Quadrant | DetID | PixID | Counts | Sigma | Mean | Median | Sigma |
| A | 0 | 13 | 19045 | 108.13 | 860 | 848 | 168.3 |
| A | 13 | 254 | 10682 | 58.44 | 860 | 848 | 168.3 |
| A | 0 | 226 | 7573 | 39.96 | 860 | 848 | 168.3 |
| B | 0 | 245 | 32012 | 195.98 | 860 | 842 | 159.0 |
| B | 5 | 172 | 24179 | 146.73 | 860 | 842 | 159.0 |
| B | 0 | 230 | 19600 | 117.94 | 860 | 842 | 159.0 |
| C | 3 | 233 | 1768402 | 9692.58 | 798 | 806 | 182.4 |
| C | 14 | 238 | 132240 | 720.72 | 798 | 806 | 182.4 |
| C | 2 | 16 | 47768 | 257.52 | 798 | 806 | 182.4 |
| D | 7 | 80 | 1902055 | 10223.85 | 790 | 772 | 186.0 |
| D | 1 | 52 | 1153926 | 6200.9 | 790 | 772 | 186.0 |
| D | 2 | 234 | 25945 | 135.36 | 790 | 772 | 186.0 |
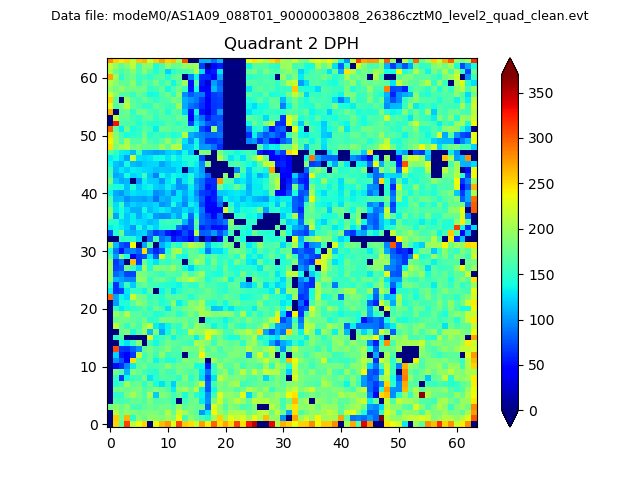
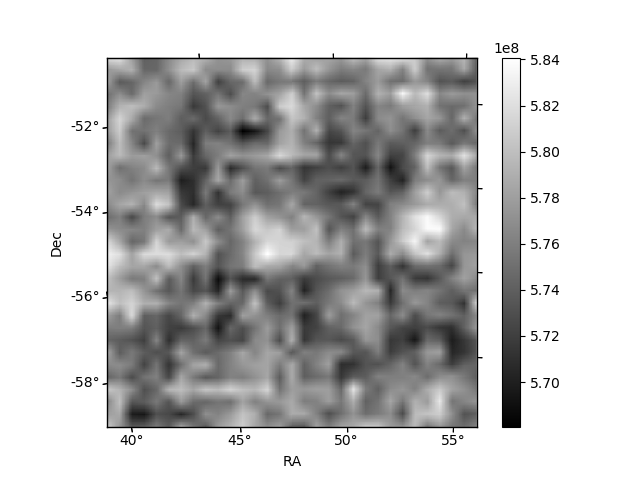
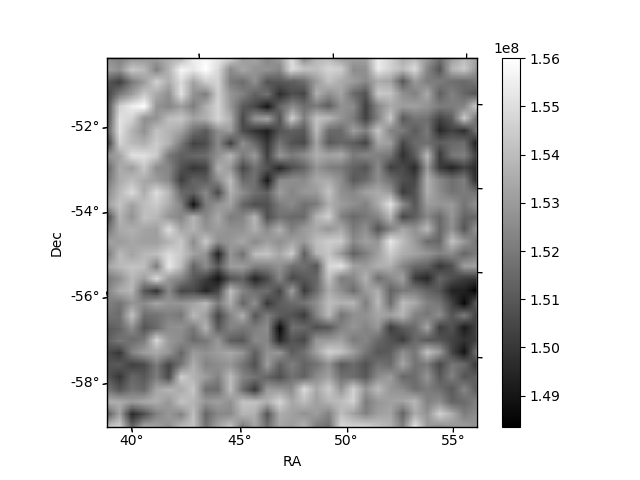
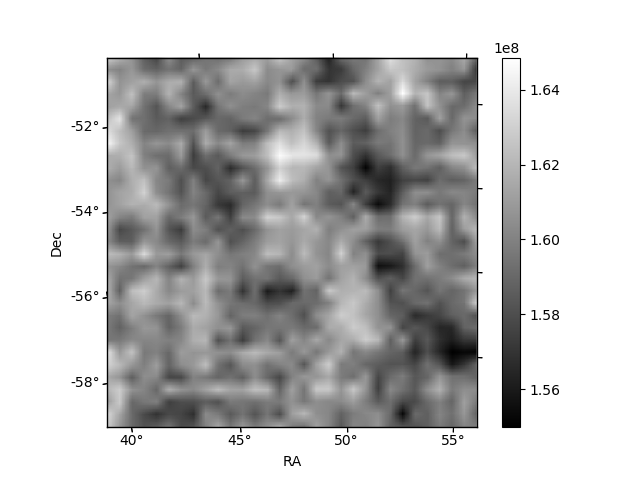
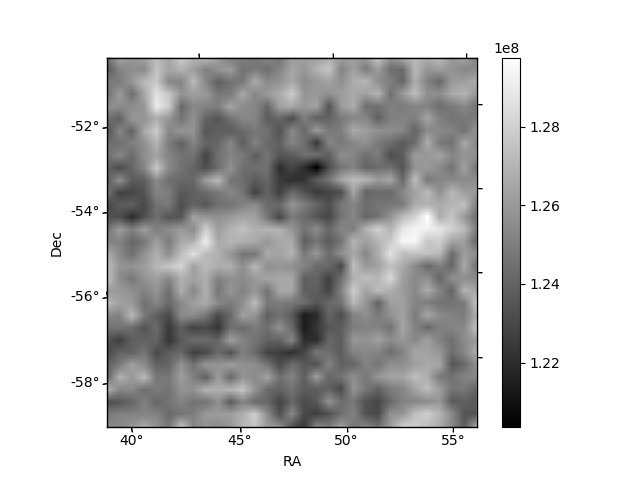
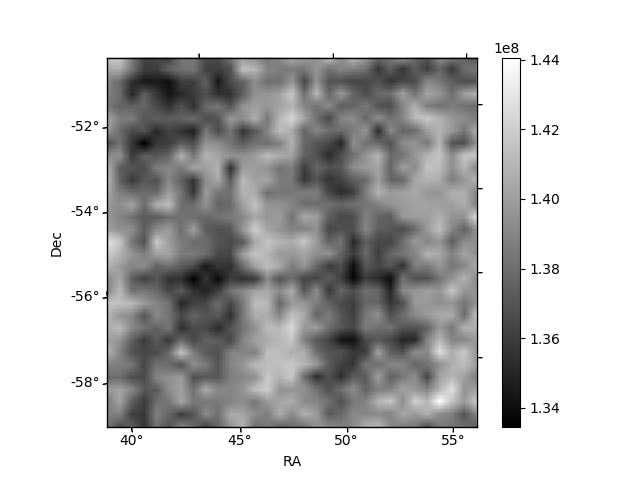
Histogram calculated using DETX and DETY for each event in the final _common_clean file
| Quadrant A | 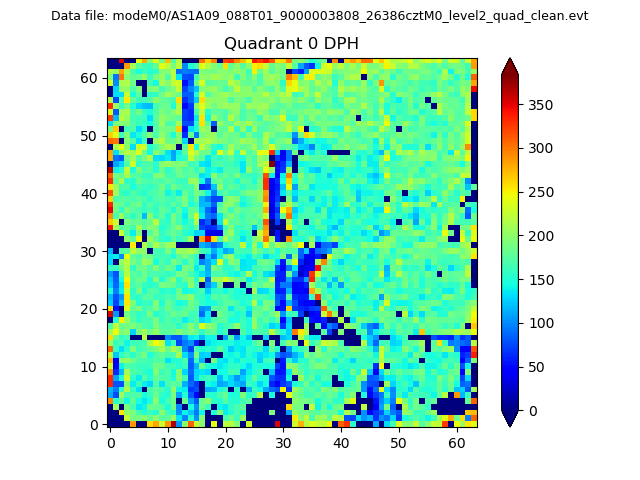 |
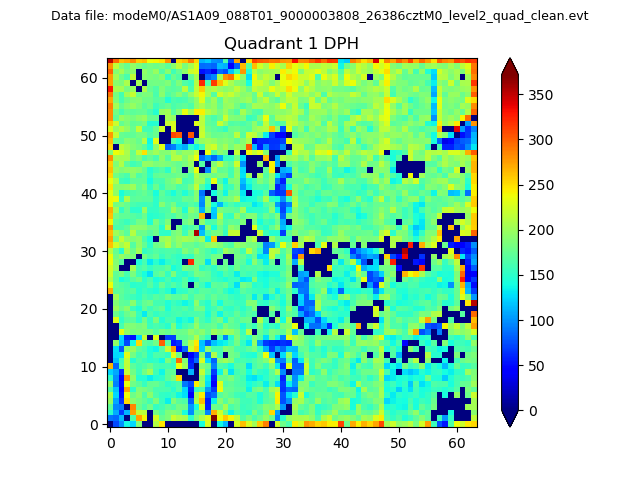 |
Quadrant B |
|---|---|---|---|
| Quadrant D | 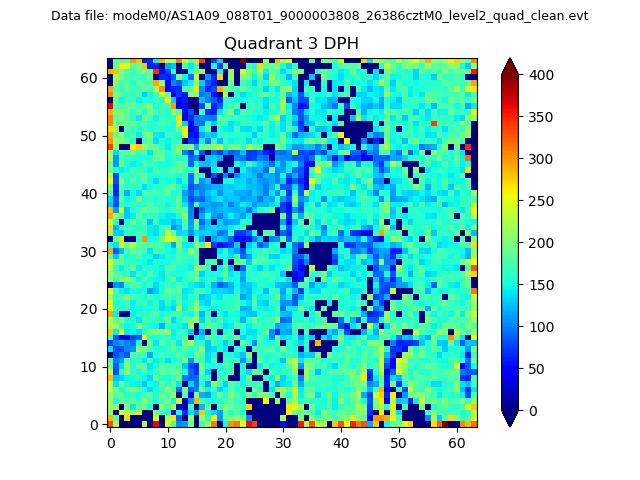 |
 |
Quadrant C |
| Plot type | Count rate plots | Images |
|---|---|---|
| Comparison with Poisson distribution Blue bars denote a histogram of data divided into 1 sec bins. Red curve is a Poisson curve with rate = median count rate of data. |
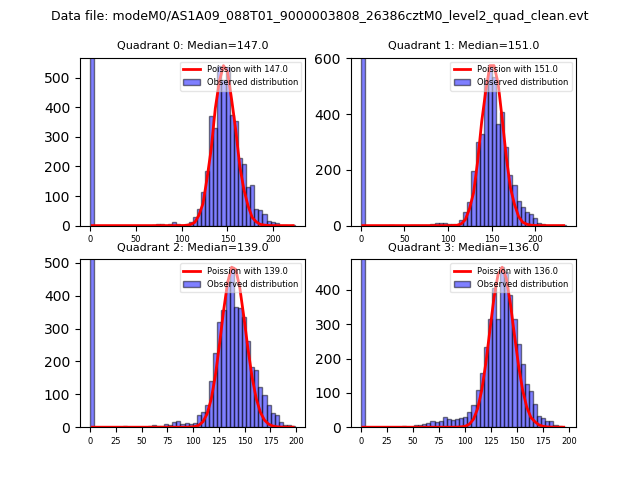 |
 |
| Quadrant-wise count rates Data is divided into 100 sec bins |
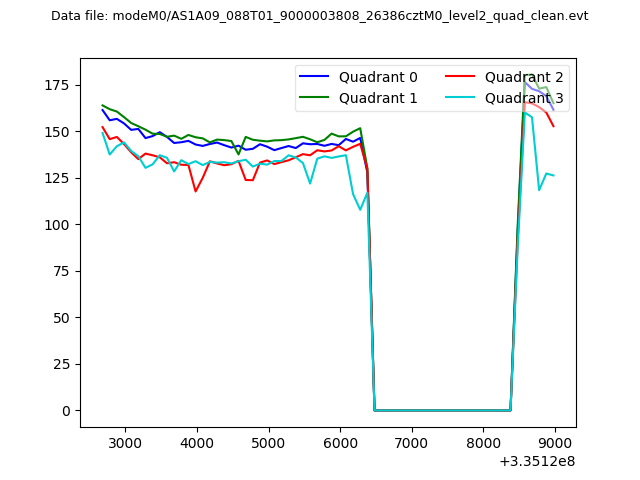 |
|
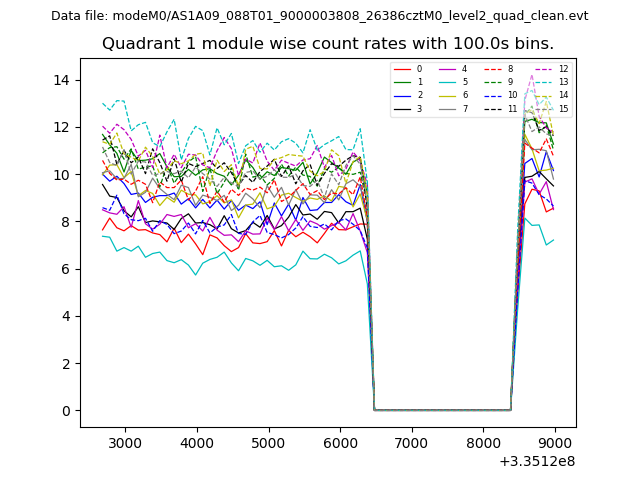
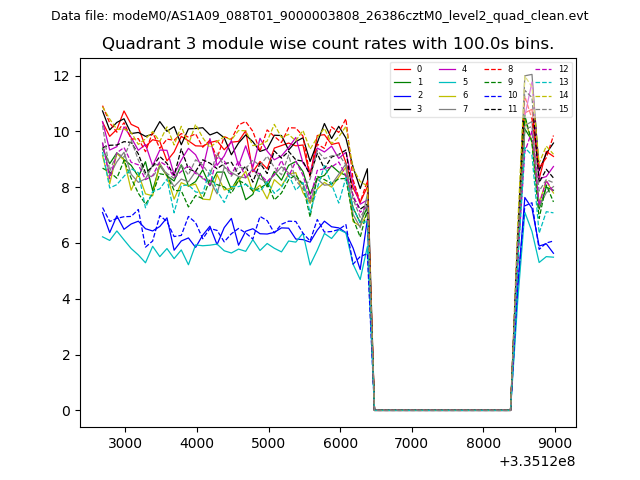
| Module-wise count rates for Quadrant A Data is divided into 100 sec bins |
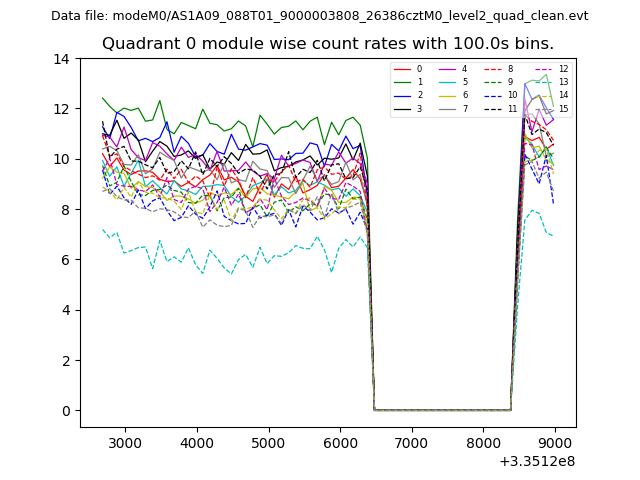 |
 |
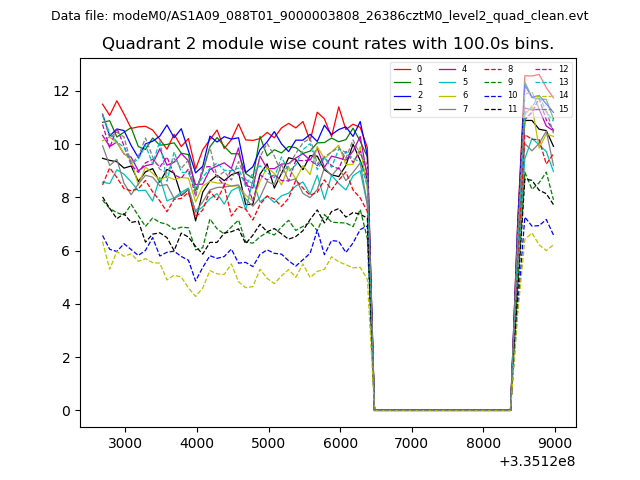
| Module-wise count rates for Quadrant B Data is divided into 100 sec bins |
 |
 |
| Module-wise count rates for Quadrant C Data is divided into 100 sec bins |
 |
 |
| Module-wise count rates for Quadrant D Data is divided into 100 sec bins |
 |
 |
| Parameter | Plot |
|---|---|
| CZT HV Monitor | 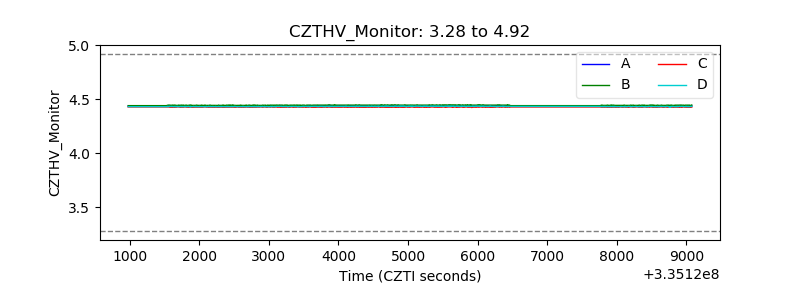 |
| D_VDD | 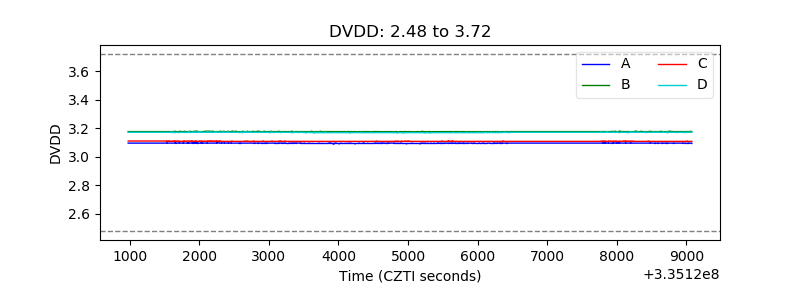 |
| Temperature 1 | 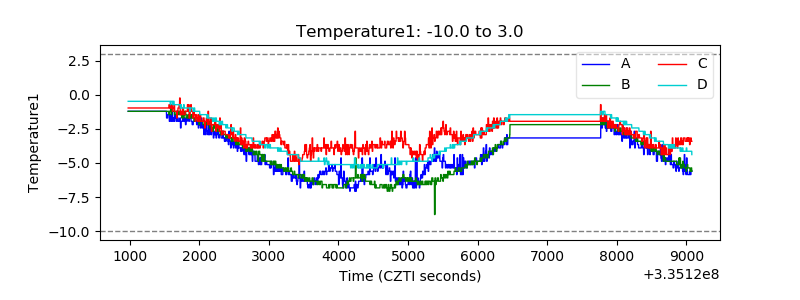 |
| Veto HV Monitor | 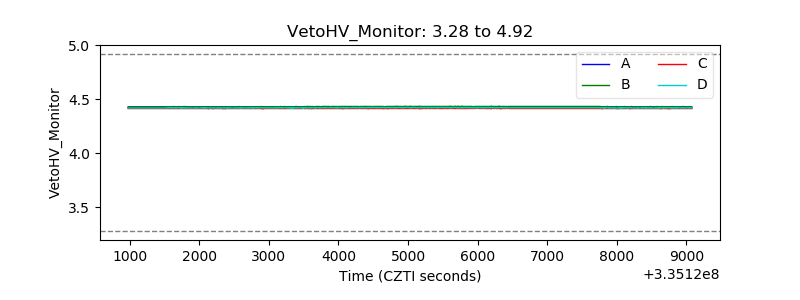 |
| Veto LLD | 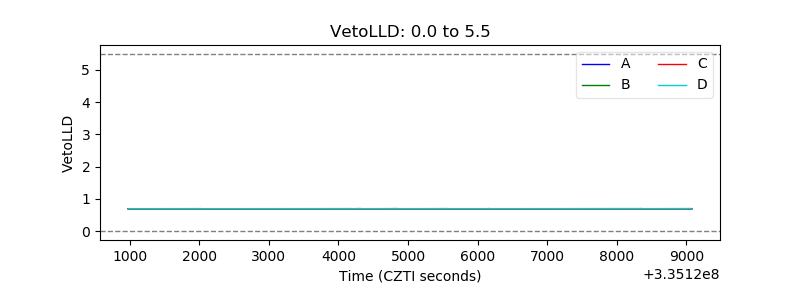 |
| Alpha Counter | 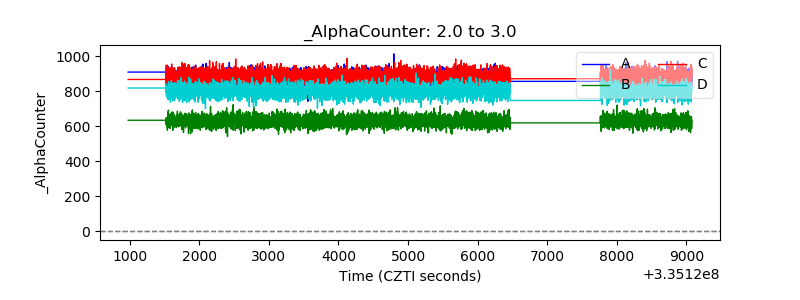 |
| _CPM_Rate | 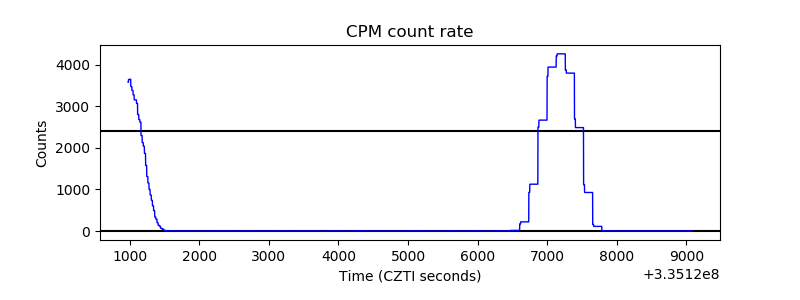 |
| CZT Counter | 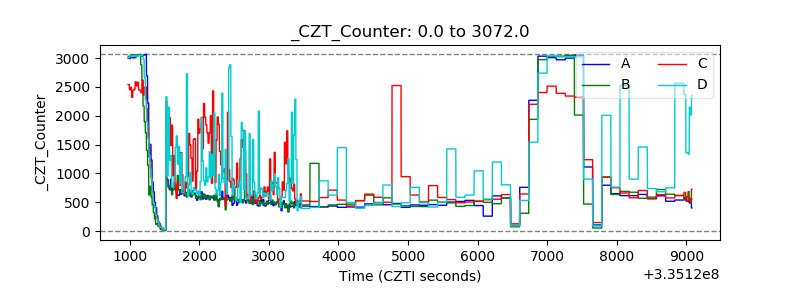 |
| +2.5 Volts monitor |  |
| +5 Volts monitor | 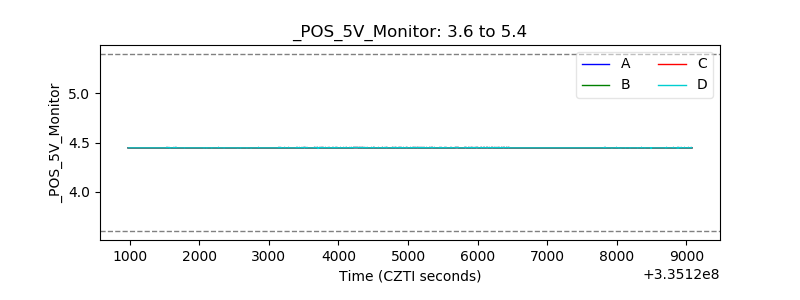 |
| _ROLL_ROT | 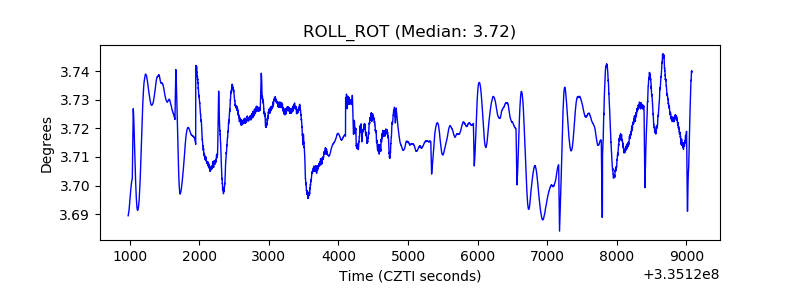 |
| _Roll_DEC | 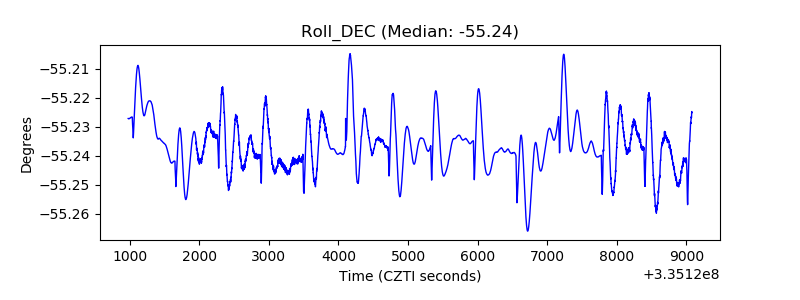 |
| _Roll_RA |  |
| Veto Counter | 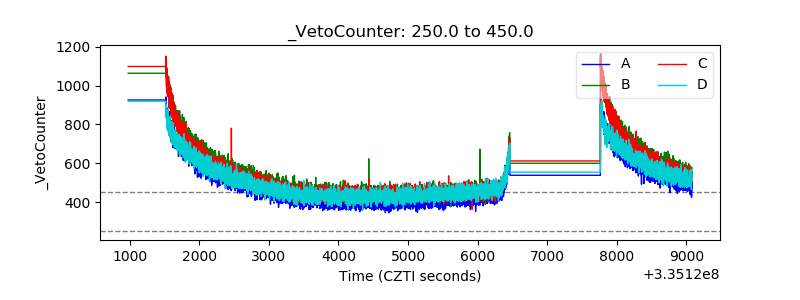 |