| Param | Original file | Final file |
|---|---|---|
| Filename | modeM0/AS1A09_088T01_9000003808_26387cztM0_level2.evt | modeM0/AS1A09_088T01_9000003808_26387cztM0_level2_quad_clean.evt |
| Size (bytes) | 240,891,840 | 38,364,480 |
| Size | 229.7 MB | 36.6 MB |
| Events in quadrant A | 1,367,382 | 258,556 |
| Events in quadrant B | 1,349,022 | 266,396 |
| Events in quadrant C | 1,491,041 | 244,639 |
| Events in quadrant D | 2,924,074 | 219,635 |
| Mode M9 | |||
|---|---|---|---|
| Quadrant | BADHDUFLAG | Total packets | Discarded packets |
| A | 0 | 7 | 0 |
| B | 0 | 8 | 0 |
| C | 0 | 8 | 0 |
| D | 0 | 8 | 0 |
| Mode M0 | |||
|---|---|---|---|
| Quadrant | BADHDUFLAG | Total packets | Discarded packets |
| A | 0 | 5620 | 0 |
| B | 0 | 5584 | 0 |
| C | 0 | 6030 | 0 |
| D | 0 | 10350 | 0 |
| Quadrant | Total seconds | Saturated seconds | Saturation percentage |
|---|---|---|---|
| A | 2390 | 16 | 0.669456% |
| B | 2390 | 11 | 0.460251% |
| C | 2390 | 46 | 1.924686% |
| D | 2390 | 484 | 20.251046% |
Noise dominated data is calculated using 1-second bins in cleaned event files. If a bin has >2000 counts, and if more than 50% of those come from <1% of pixels, then it is considered to be noise-dominated and hence unusable.
| Quadrant | # 1 sec bins | Bins with >0 counts | Bins with >2000 counts | High rate bins dominated by noise | Noise dominated (total time) | Noise dominated (detector-on time) | Marked lightcurve |
|---|---|---|---|---|---|---|---|
| A | 2390 | 2390 | 7 | 7 | 0.29% | 0.29% | 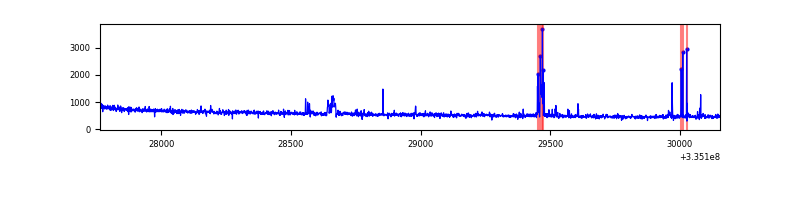 |
| B | 2390 | 2390 | 0 | 0 | 0.00% | 0.00% | 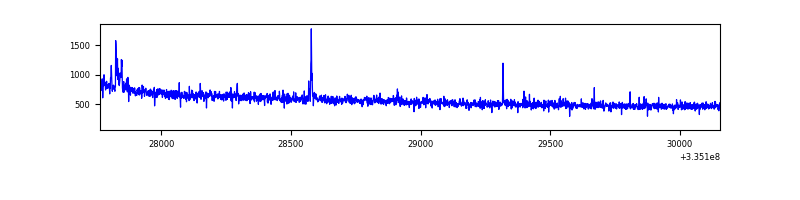 |
| C | 2390 | 2390 | 3 | 3 | 0.13% | 0.13% |  |
| D | 2390 | 2390 | 400 | 400 | 16.74% | 16.74% | 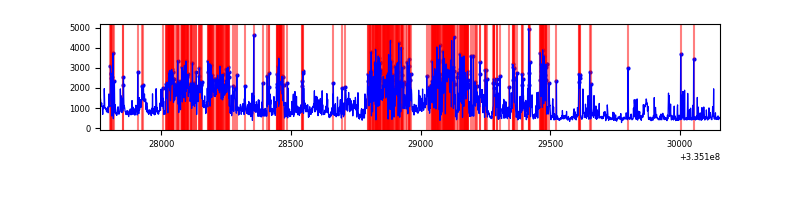 |
Top three noisy pixels from each quadrant. If the there are fewer than three noisy pixels in the level2.evt file, extra rows are filled as -1
| Pixel properties | Quadrant properties | ||||||
|---|---|---|---|---|---|---|---|
| Quadrant | DetID | PixID | Counts | Sigma | Mean | Median | Sigma |
| A | 0 | 13 | 66519 | 981.09 | 336 | 333 | 67.5 |
| A | 13 | 254 | 4084 | 55.6 | 336 | 333 | 67.5 |
| A | 6 | 16 | 3251 | 43.25 | 336 | 333 | 67.5 |
| B | 5 | 172 | 21196 | 330.56 | 338 | 332 | 63.1 |
| B | 0 | 230 | 10485 | 160.86 | 338 | 332 | 63.1 |
| B | 12 | 111 | 6741 | 101.54 | 338 | 332 | 63.1 |
| C | 3 | 233 | 183049 | 2497.35 | 316 | 319 | 73.2 |
| C | 14 | 238 | 53000 | 719.98 | 316 | 319 | 73.2 |
| C | 2 | 16 | 20978 | 282.34 | 316 | 319 | 73.2 |
| D | 7 | 80 | 1349824 | 18821.17 | 297 | 290 | 71.7 |
| D | 1 | 52 | 434613 | 6057.25 | 297 | 290 | 71.7 |
| D | 2 | 234 | 9749 | 131.92 | 297 | 290 | 71.7 |
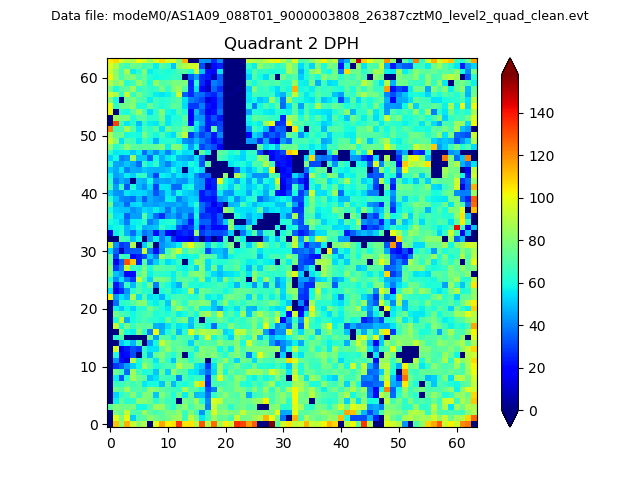
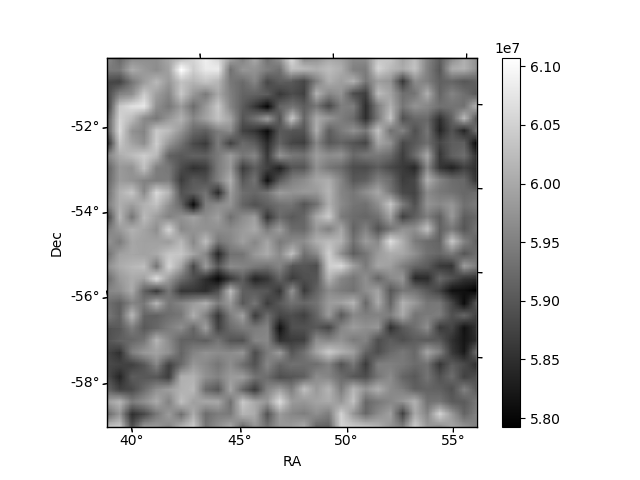
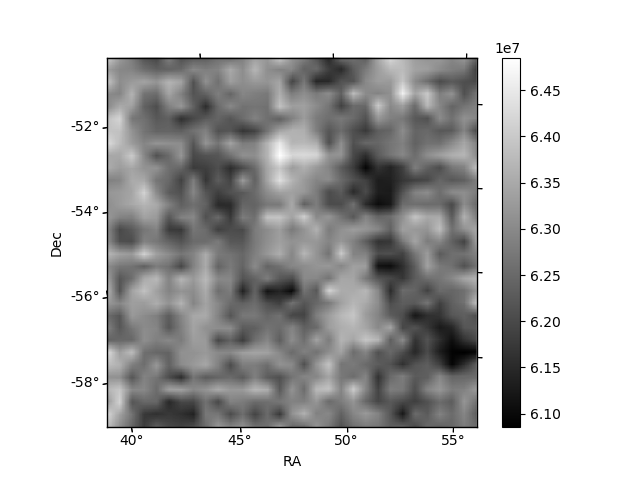
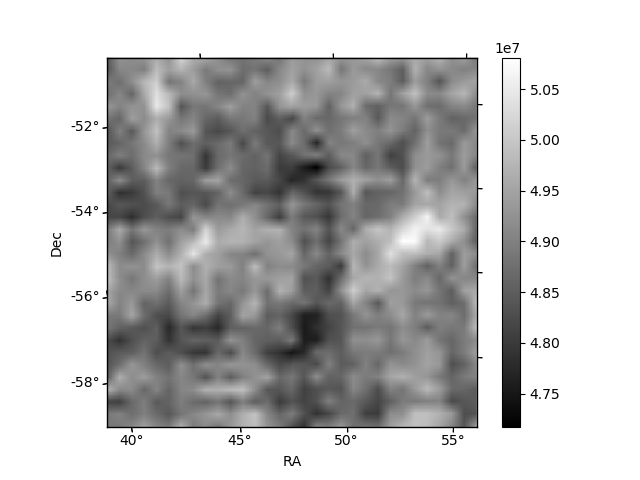
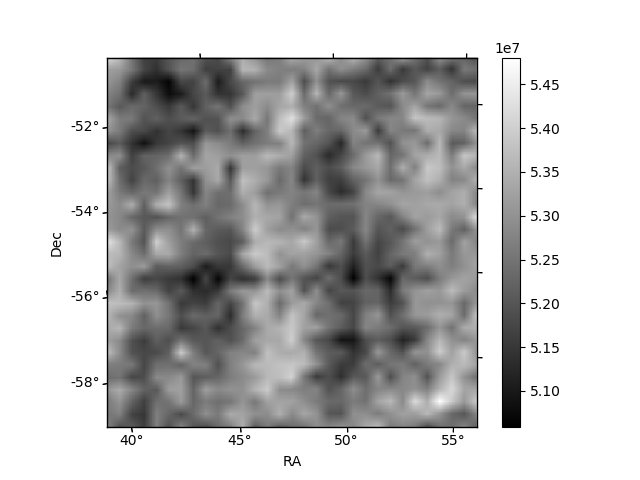
Histogram calculated using DETX and DETY for each event in the final _common_clean file
| Quadrant A | 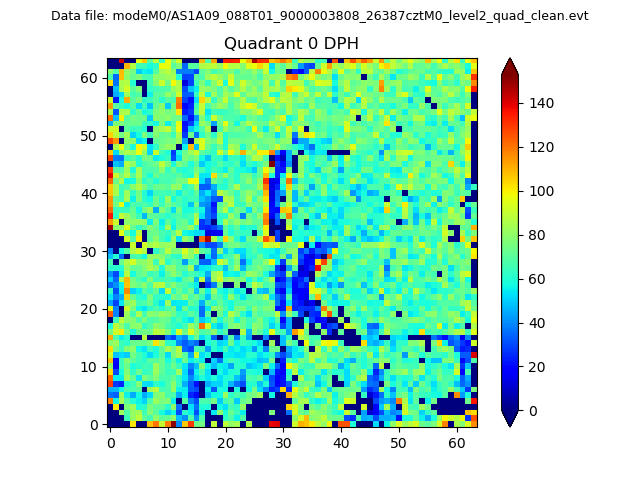 |
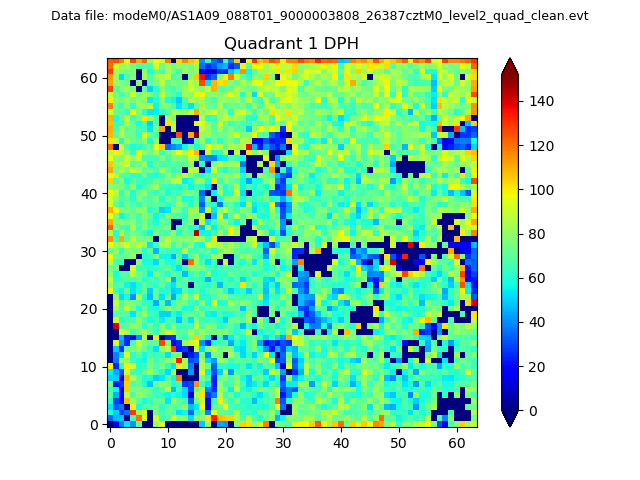 |
Quadrant B |
|---|---|---|---|
| Quadrant D | 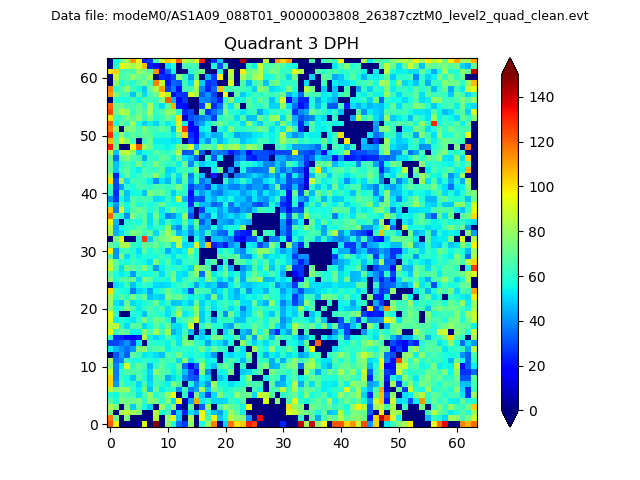 |
 |
Quadrant C |
| Plot type | Count rate plots | Images |
|---|---|---|
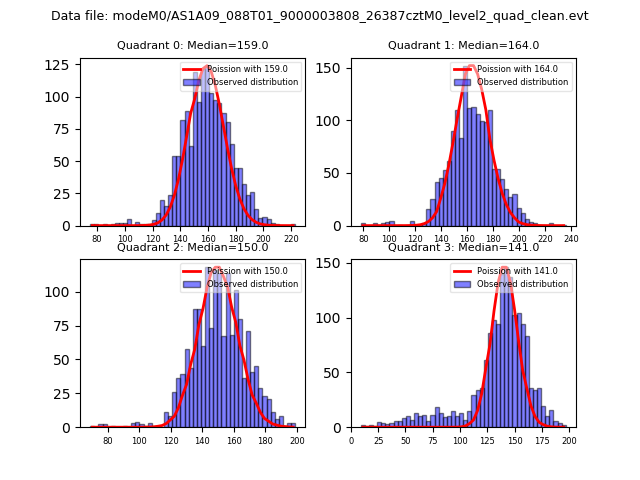
| Comparison with Poisson distribution Blue bars denote a histogram of data divided into 1 sec bins. Red curve is a Poisson curve with rate = median count rate of data. |
 |
 |
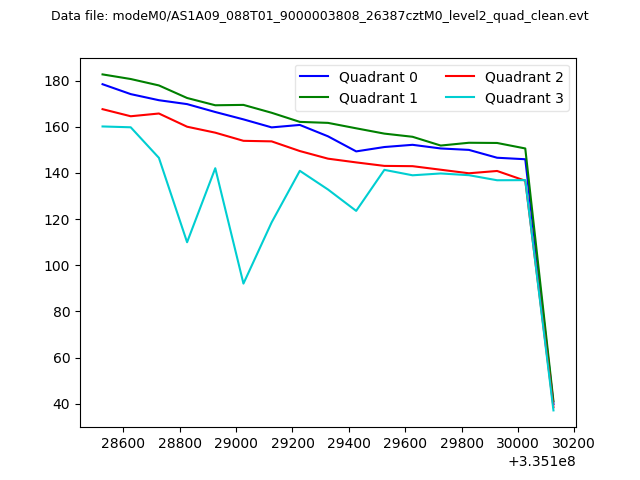
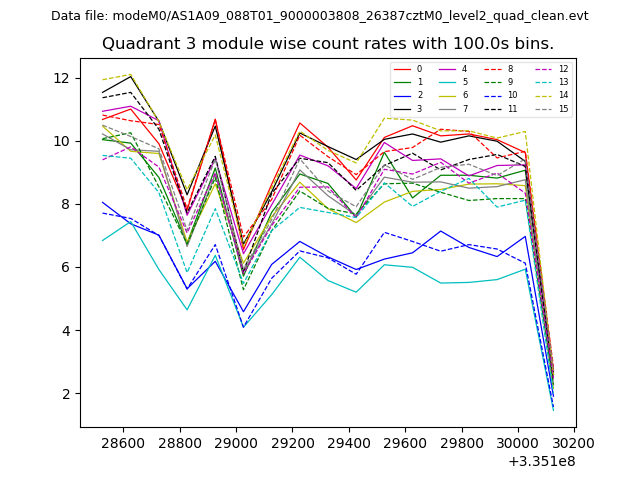
| Quadrant-wise count rates Data is divided into 100 sec bins |
 |
|
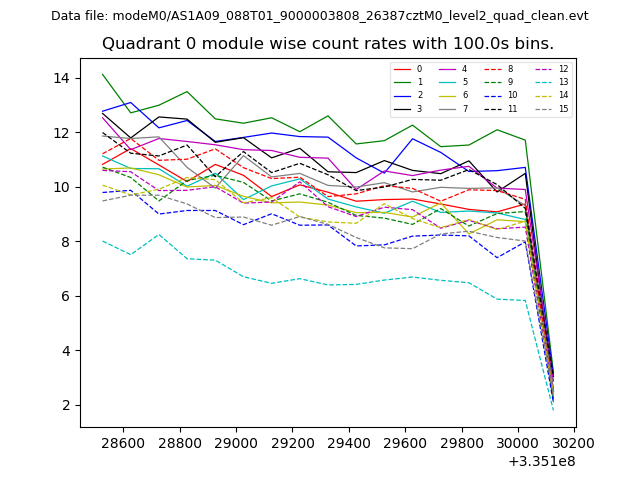
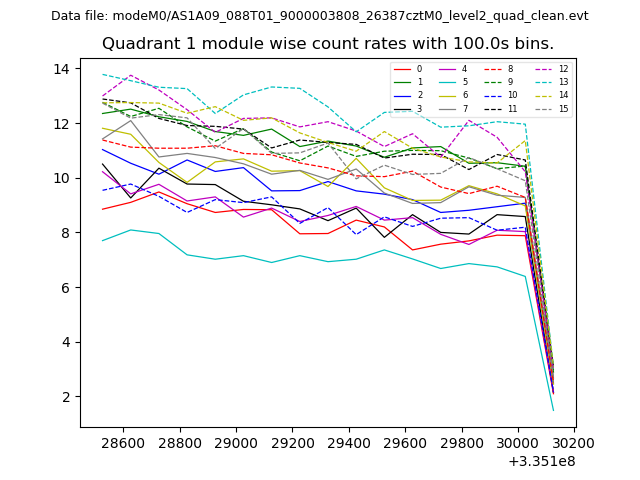
| Module-wise count rates for Quadrant A Data is divided into 100 sec bins |
 |
 |
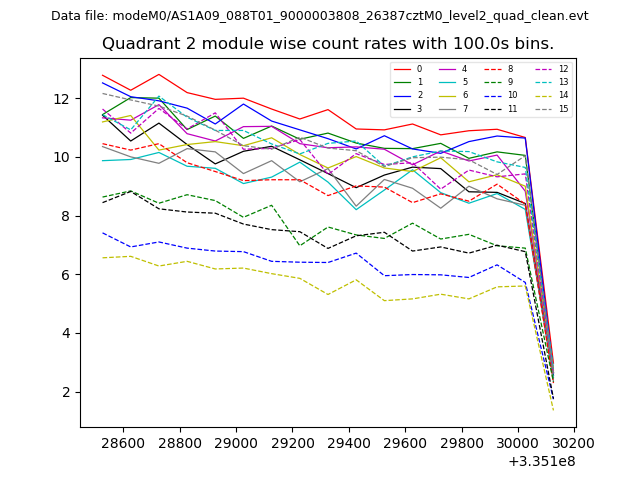
| Module-wise count rates for Quadrant B Data is divided into 100 sec bins |
 |
 |
| Module-wise count rates for Quadrant C Data is divided into 100 sec bins |
 |
 |
| Module-wise count rates for Quadrant D Data is divided into 100 sec bins |
 |
 |
| Parameter | Plot |
|---|---|
| CZT HV Monitor | 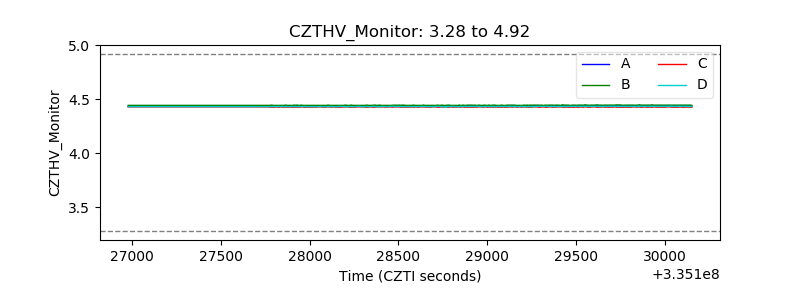 |
| D_VDD | 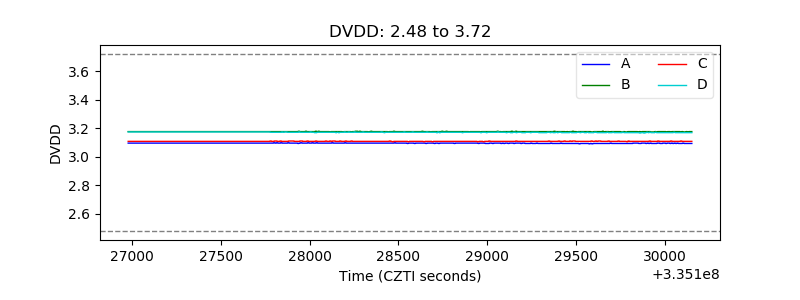 |
| Temperature 1 | 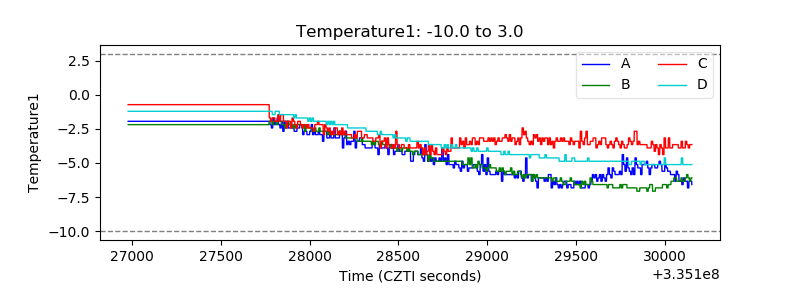 |
| Veto HV Monitor |  |
| Veto LLD |  |
| Alpha Counter | 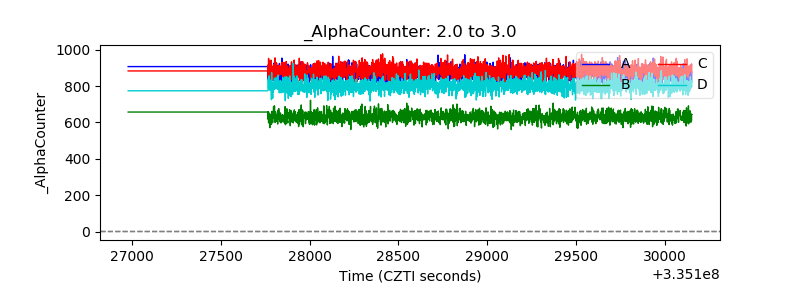 |
| _CPM_Rate | 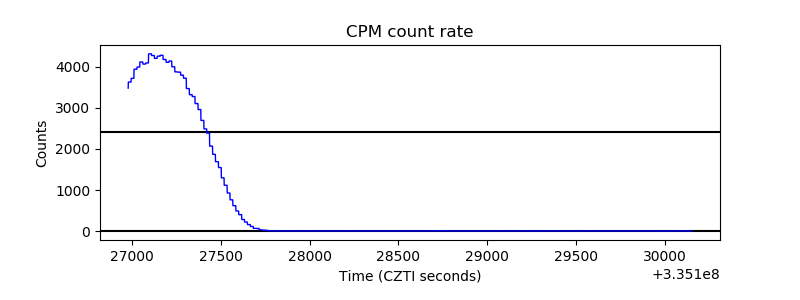 |
| CZT Counter | 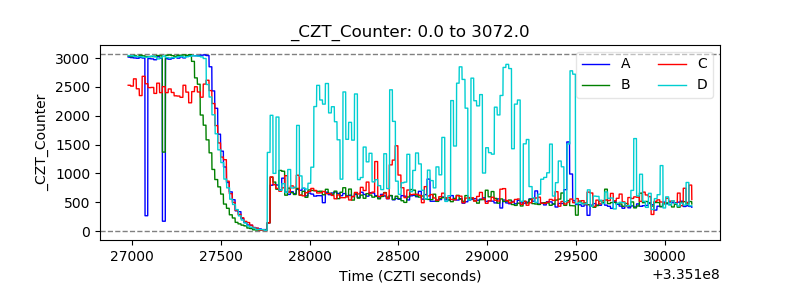 |
| +2.5 Volts monitor |  |
| +5 Volts monitor |  |
| _ROLL_ROT | 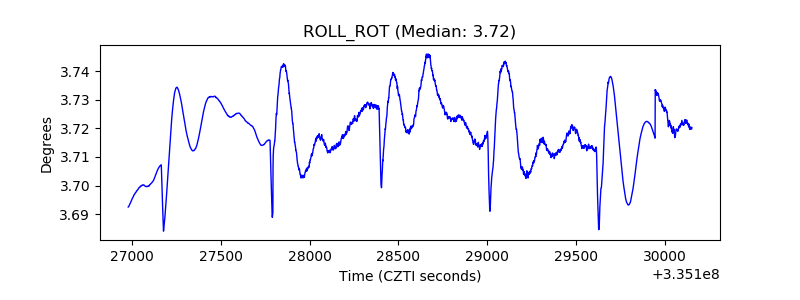 |
| _Roll_DEC | 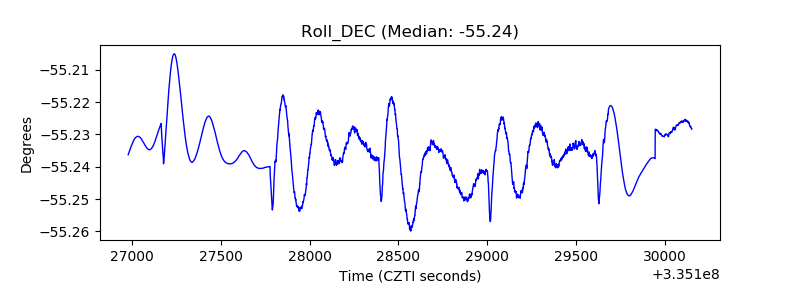 |
| _Roll_RA | 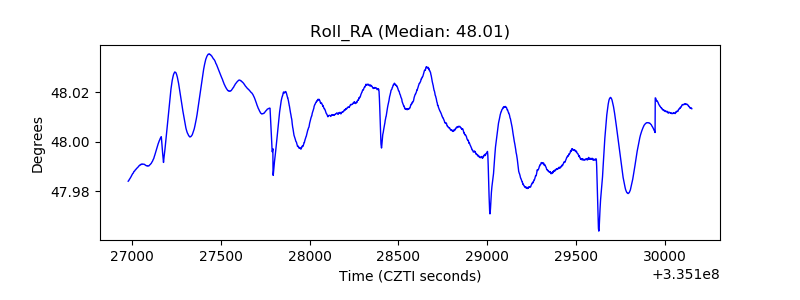 |
| Veto Counter | 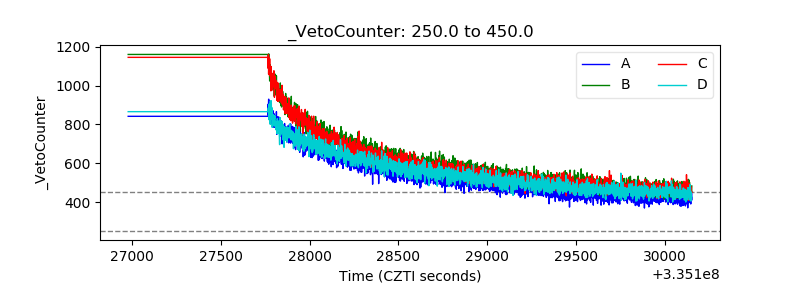 |