| Param | Original file | Final file |
|---|---|---|
| Filename | modeM0/AS1A09_143T05_9000003804cztM0_level2.fits | modeM0/AS1A09_143T05_9000003804cztM0_level2_quad_clean.evt |
| Size (bytes) | 169,634,880 | 154,382,400 |
| Size | 161.8 MB | 147.2 MB |
| Events in quadrant A | 1,048,630 | 933,248 |
| Events in quadrant B | 997,218 | 922,494 |
| Events in quadrant C | 965,526 | 785,294 |
| Events in quadrant D | 874,560 | 782,739 |
| Mode M0 | |||
|---|---|---|---|
| Quadrant | BADHDUFLAG | Total packets | Discarded packets |
| A | 0 | 37306 | 0 |
| B | 0 | 39641 | 0 |
| C | 0 | 58622 | 0 |
| D | 0 | 49871 | 0 |
| Mode M9 | |||
|---|---|---|---|
| Quadrant | BADHDUFLAG | Total packets | Discarded packets |
| A | 0 | 22 | 0 |
| B | 0 | 22 | 0 |
| C | 0 | 22 | 0 |
| D | 0 | 22 | 0 |
| Mode SS | |||
|---|---|---|---|
| Quadrant | BADHDUFLAG | Total packets | Discarded packets |
| A | 0 | 370 | 0 |
| B | 0 | 370 | 0 |
| C | 0 | 370 | 0 |
| D | 0 | 370 | 0 |
| Quadrant | Total seconds | Saturated seconds | Saturation percentage |
|---|---|---|---|
| A | 18141 | 139 | 0.766220% |
| B | 18141 | 281 | 1.548977% |
| C | 18141 | 1928 | 10.627860% |
| D | 18141 | 984 | 5.424177% |
Noise dominated data is calculated using 1-second bins in cleaned event files. If a bin has >2000 counts, and if more than 50% of those come from <1% of pixels, then it is considered to be noise-dominated and hence unusable.
| Quadrant | # 1 sec bins | Bins with >0 counts | Bins with >2000 counts | High rate bins dominated by noise | Noise dominated (total time) | Noise dominated (detector-on time) | Marked lightcurve |
|---|---|---|---|---|---|---|---|
| A | 20401 | 18140 | 0 | 0 | 0.00% | 0.00% |  |
| B | 20401 | 18141 | 0 | 0 | 0.00% | 0.00% | 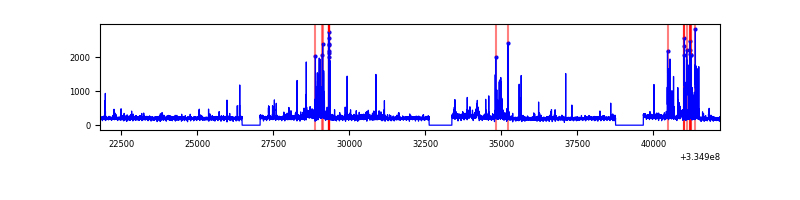 |
| C | 20401 | 18129 | 0 | 0 | 0.00% | 0.00% |  |
| D | 20401 | 18139 | 0 | 0 | 0.00% | 0.00% | 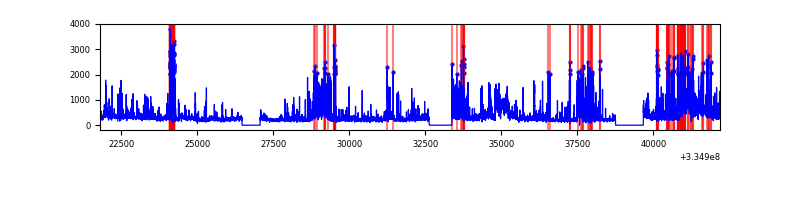 |
Top three noisy pixels from each quadrant. If the there are fewer than three noisy pixels in the level2.evt file, extra rows are filled as -1
| Pixel properties | Quadrant properties | ||||||
|---|---|---|---|---|---|---|---|
| Quadrant | DetID | PixID | Counts | Sigma | Mean | Median | Sigma |
| A | 7 | 110 | 887 | 9.04 | 272 | 255 | 69.9 |
| A | 0 | 29 | 870 | 8.79 | 272 | 255 | 69.9 |
| A | 0 | 30 | 805 | 7.86 | 272 | 255 | 69.9 |
| B | 2 | 9 | 862 | 11.28 | 263 | 252 | 54.1 |
| B | 5 | 232 | 684 | 7.99 | 263 | 252 | 54.1 |
| B | 2 | 8 | 676 | 7.84 | 263 | 252 | 54.1 |
| C | 1 | 81 | 754 | 7.7 | 254 | 236 | 67.3 |
| C | 1 | 80 | 722 | 7.22 | 254 | 236 | 67.3 |
| C | 12 | 241 | 688 | 6.72 | 254 | 236 | 67.3 |
| D | 3 | 14 | 658 | 6.26 | 249 | 227 | 68.9 |
| D | 10 | 189 | 631 | 5.87 | 249 | 227 | 68.9 |
| D | 6 | 231 | 625 | 5.78 | 249 | 227 | 68.9 |
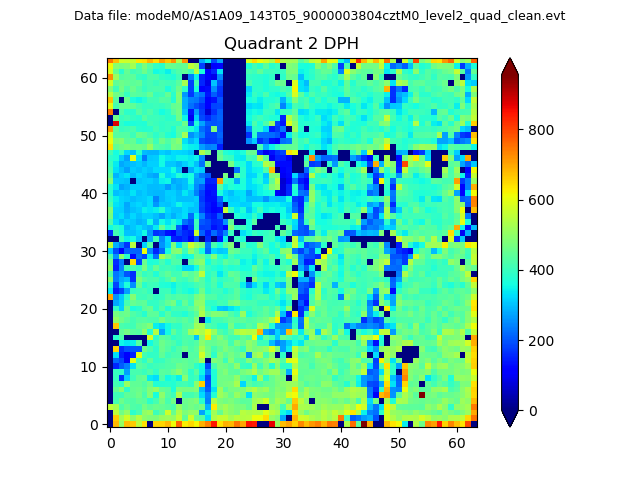
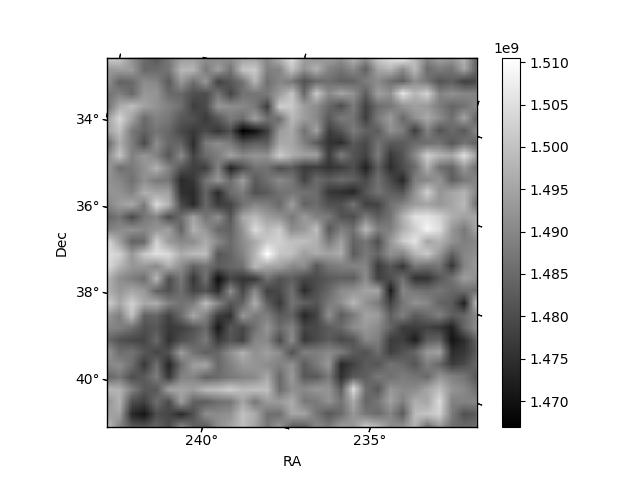
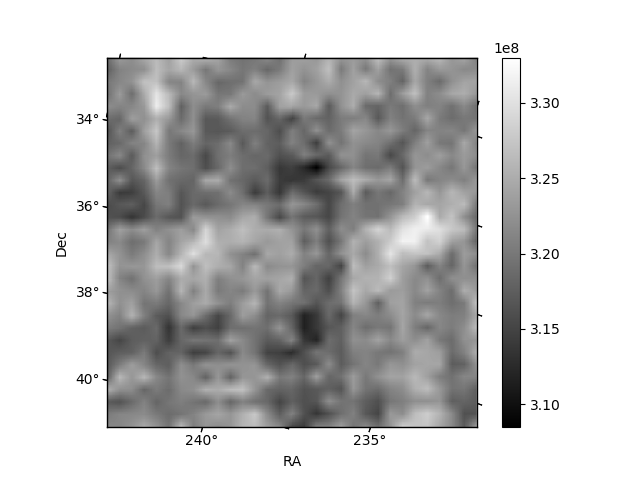
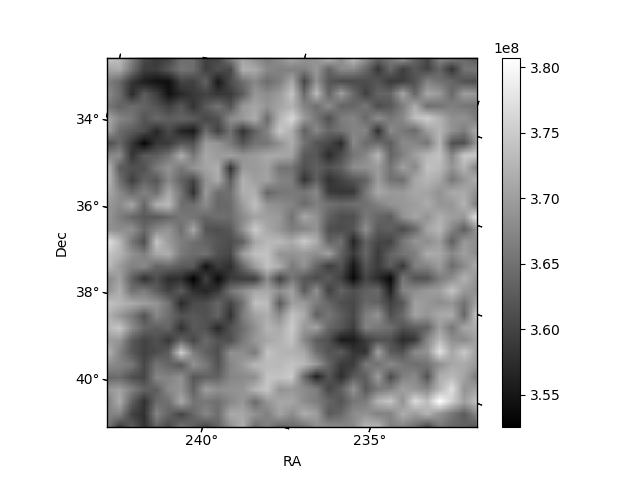
Histogram calculated using DETX and DETY for each event in the final _common_clean file
| Quadrant A |  |
 |
Quadrant B |
|---|---|---|---|
| Quadrant D | 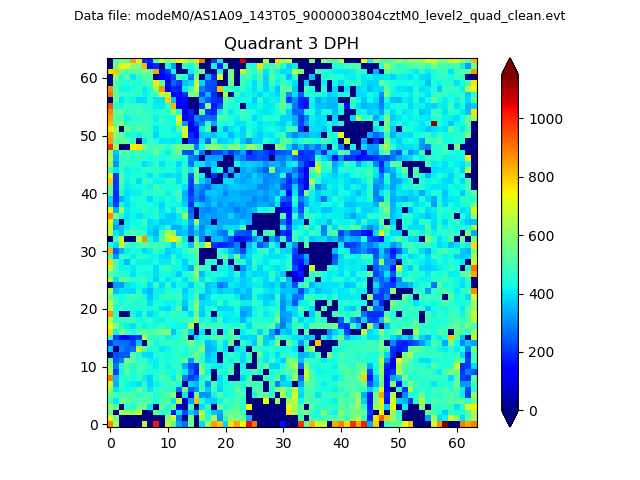 |
 |
Quadrant C |
| Plot type | Count rate plots | Images |
|---|---|---|
| Comparison with Poisson distribution Blue bars denote a histogram of data divided into 1 sec bins. Red curve is a Poisson curve with rate = median count rate of data. |
 |
 |
| Quadrant-wise count rates Data is divided into 100 sec bins |
 |
|
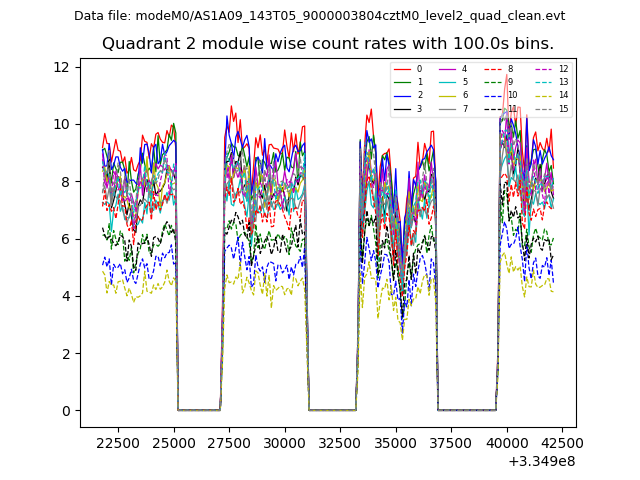
| Module-wise count rates for Quadrant A Data is divided into 100 sec bins |
 |
 |
| Module-wise count rates for Quadrant B Data is divided into 100 sec bins |
 |
 |
| Module-wise count rates for Quadrant C Data is divided into 100 sec bins |
 |
 |
| Module-wise count rates for Quadrant D Data is divided into 100 sec bins |
 |
 |
| Parameter | Plot |
|---|---|
| CZT HV Monitor | 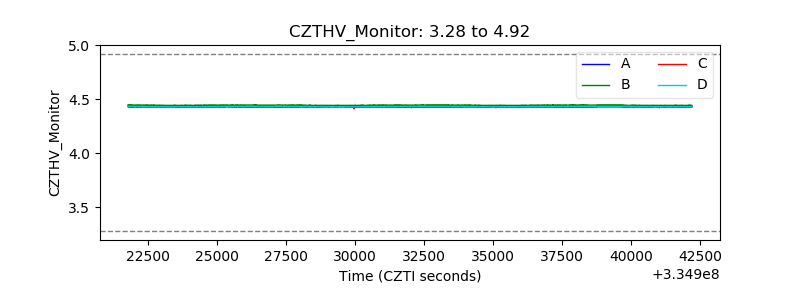 |
| D_VDD |  |
| Temperature 1 |  |
| Veto HV Monitor |  |
| Veto LLD |  |
| Alpha Counter | 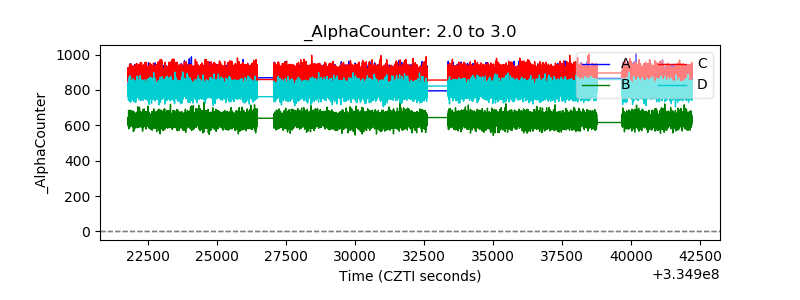 |
| _CPM_Rate |  |
| CZT Counter |  |
| +2.5 Volts monitor |  |
| +5 Volts monitor |  |
| _ROLL_ROT |  |
| _Roll_DEC |  |
| _Roll_RA |  |
| Veto Counter |  |