| Param | Original file | Final file |
|---|---|---|
| Filename | modeM0/AS1A09_143T05_9000003804_26352cztM0_level2.evt | modeM0/AS1A09_143T05_9000003804_26352cztM0_level2_quad_clean.evt |
| Size (bytes) | 973,025,280 | 169,214,400 |
| Size | 927.9 MB | 161.4 MB |
| Events in quadrant A | 5,501,958 | 1,115,238 |
| Events in quadrant B | 6,085,396 | 1,123,554 |
| Events in quadrant C | 9,471,871 | 1,024,574 |
| Events in quadrant D | 7,610,981 | 1,044,671 |
| Mode M0 | |||
|---|---|---|---|
| Quadrant | BADHDUFLAG | Total packets | Discarded packets |
| A | 0 | 24073 | 0 |
| B | 0 | 25483 | 0 |
| C | 0 | 35964 | 0 |
| D | 0 | 30362 | 0 |
| Mode M9 | |||
|---|---|---|---|
| Quadrant | BADHDUFLAG | Total packets | Discarded packets |
| A | 0 | 13 | 0 |
| B | 0 | 13 | 0 |
| C | 0 | 13 | 0 |
| D | 0 | 13 | 0 |
| Quadrant | Total seconds | Saturated seconds | Saturation percentage |
|---|---|---|---|
| A | 11807 | 87 | 0.736851% |
| B | 11806 | 148 | 1.253600% |
| C | 11806 | 1064 | 9.012367% |
| D | 11806 | 477 | 4.040318% |
Noise dominated data is calculated using 1-second bins in cleaned event files. If a bin has >2000 counts, and if more than 50% of those come from <1% of pixels, then it is considered to be noise-dominated and hence unusable.
| Quadrant | # 1 sec bins | Bins with >0 counts | Bins with >2000 counts | High rate bins dominated by noise | Noise dominated (total time) | Noise dominated (detector-on time) | Marked lightcurve |
|---|---|---|---|---|---|---|---|
| A | 13152 | 11809 | 0 | 0 | 0.00% | 0.00% |  |
| B | 13151 | 11808 | 46 | 46 | 0.35% | 0.39% | 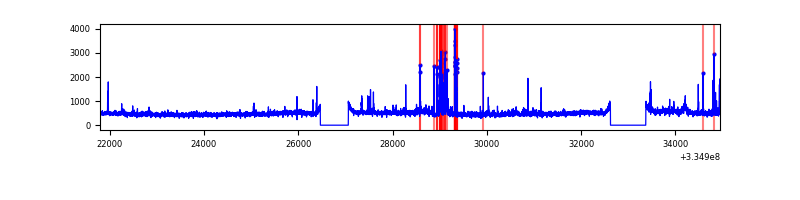 |
| C | 13150 | 11807 | 442 | 442 | 3.36% | 3.74% | 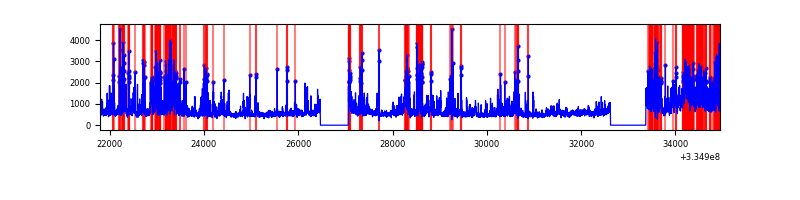 |
| D | 13151 | 11808 | 324 | 324 | 2.46% | 2.74% | 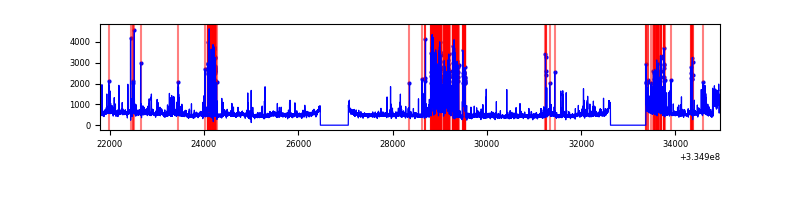 |
Top three noisy pixels from each quadrant. If the there are fewer than three noisy pixels in the level2.evt file, extra rows are filled as -1
| Pixel properties | Quadrant properties | ||||||
|---|---|---|---|---|---|---|---|
| Quadrant | DetID | PixID | Counts | Sigma | Mean | Median | Sigma |
| A | 13 | 254 | 20657 | 67.16 | 1421 | 1392 | 286.8 |
| A | 6 | 16 | 14496 | 45.68 | 1421 | 1392 | 286.8 |
| A | 3 | 137 | 13142 | 40.96 | 1421 | 1392 | 286.8 |
| B | 5 | 172 | 257496 | 946.47 | 1409 | 1369 | 270.6 |
| B | 0 | 230 | 227904 | 837.11 | 1409 | 1369 | 270.6 |
| B | 0 | 219 | 56044 | 202.04 | 1409 | 1369 | 270.6 |
| C | 3 | 233 | 3860562 | 12382.65 | 1330 | 1337 | 311.7 |
| C | 14 | 238 | 210121 | 669.9 | 1330 | 1337 | 311.7 |
| C | 0 | 239 | 150388 | 478.24 | 1330 | 1337 | 311.7 |
| D | 1 | 52 | 1475482 | 4529.66 | 1366 | 1337 | 325.4 |
| D | 12 | 233 | 704444 | 2160.46 | 1366 | 1337 | 325.4 |
| D | 11 | 176 | 164980 | 502.83 | 1366 | 1337 | 325.4 |
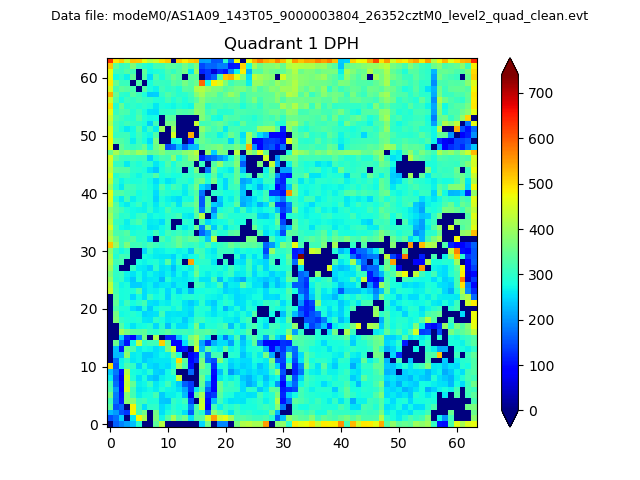
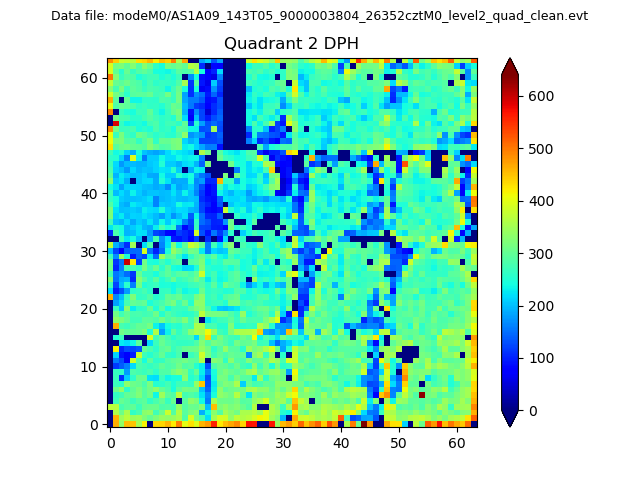
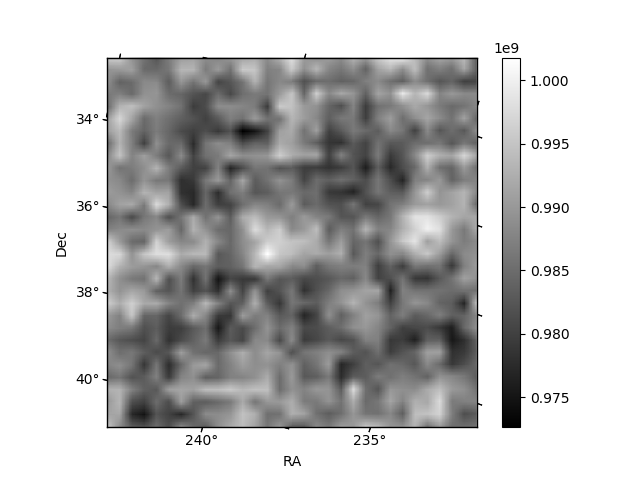
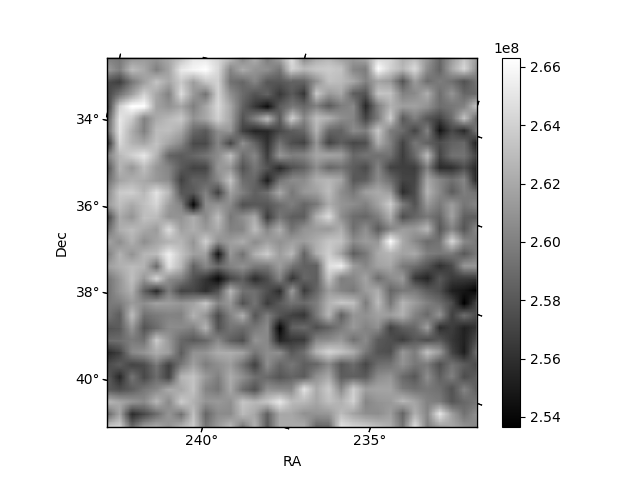
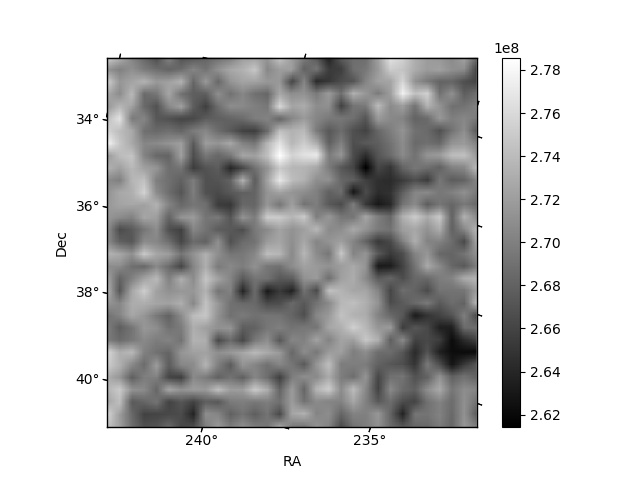
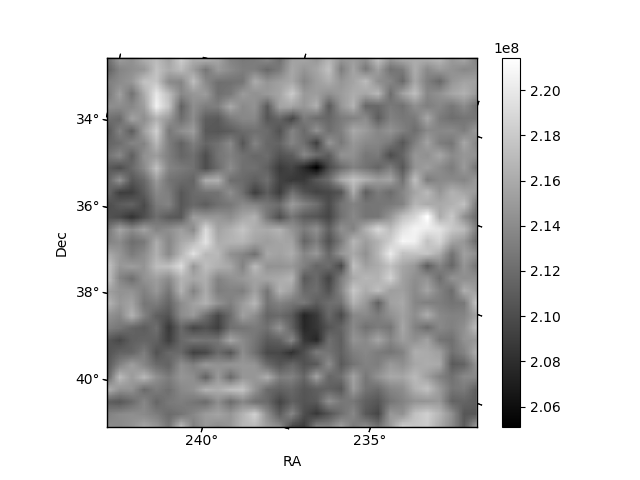
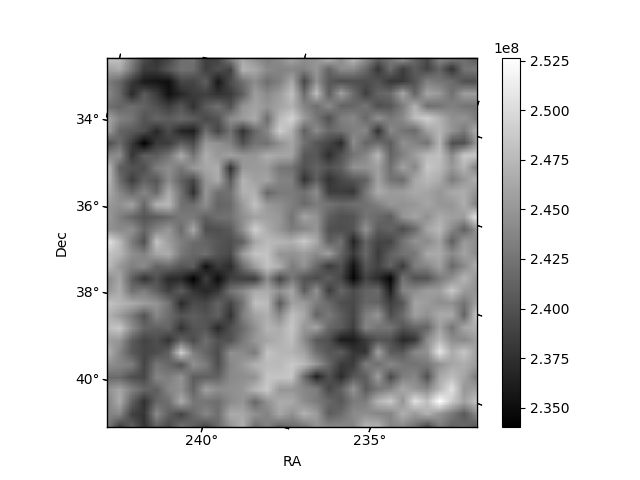
Histogram calculated using DETX and DETY for each event in the final _common_clean file
| Quadrant A | 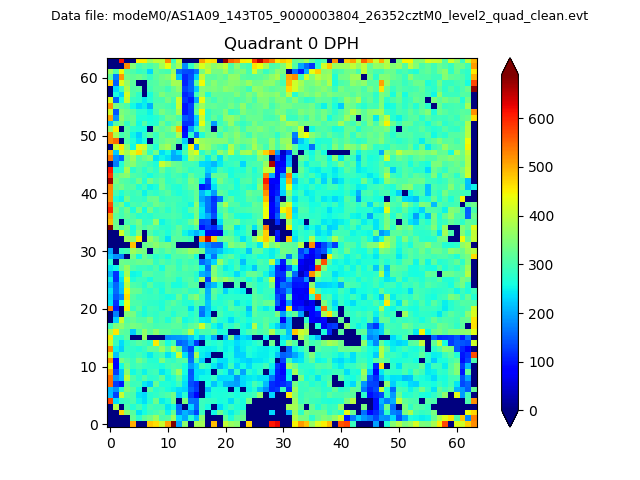 |
 |
Quadrant B |
|---|---|---|---|
| Quadrant D | 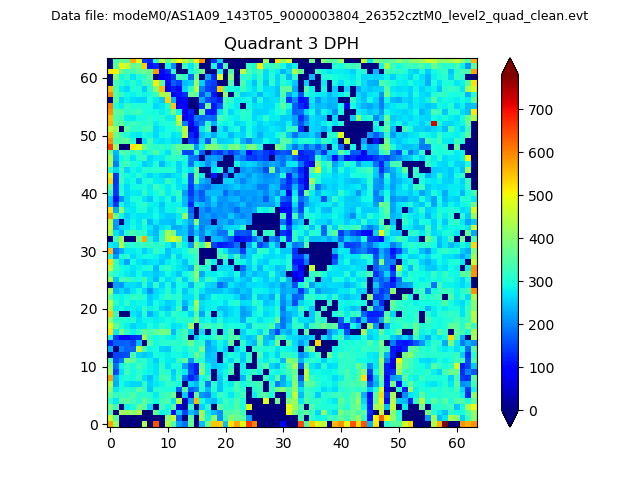 |
 |
Quadrant C |
| Plot type | Count rate plots | Images |
|---|---|---|
| Comparison with Poisson distribution Blue bars denote a histogram of data divided into 1 sec bins. Red curve is a Poisson curve with rate = median count rate of data. |
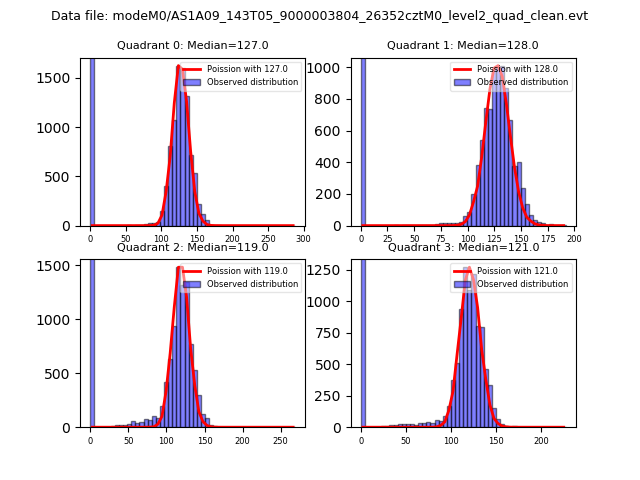 |
 |
| Quadrant-wise count rates Data is divided into 100 sec bins |
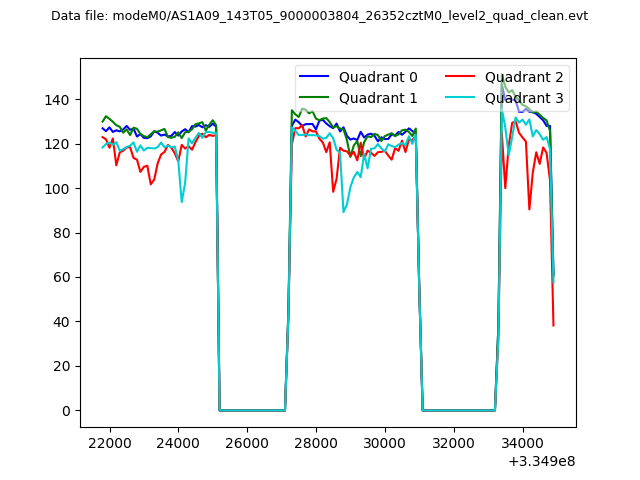 |
|
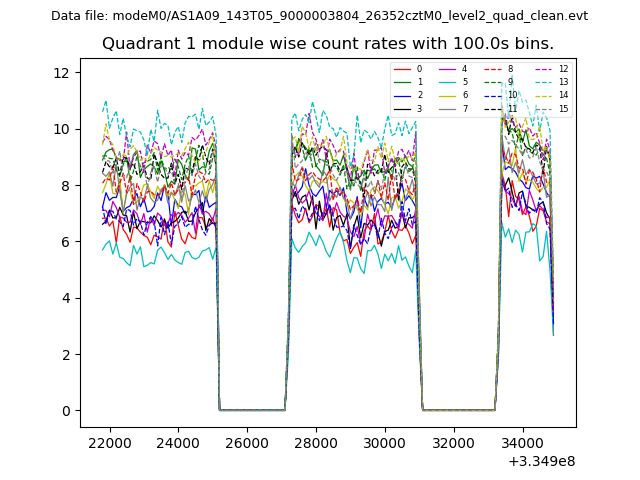
| Module-wise count rates for Quadrant A Data is divided into 100 sec bins |
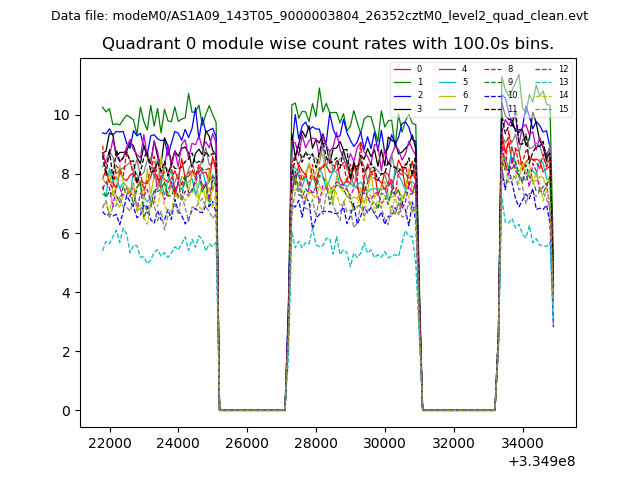 |
 |
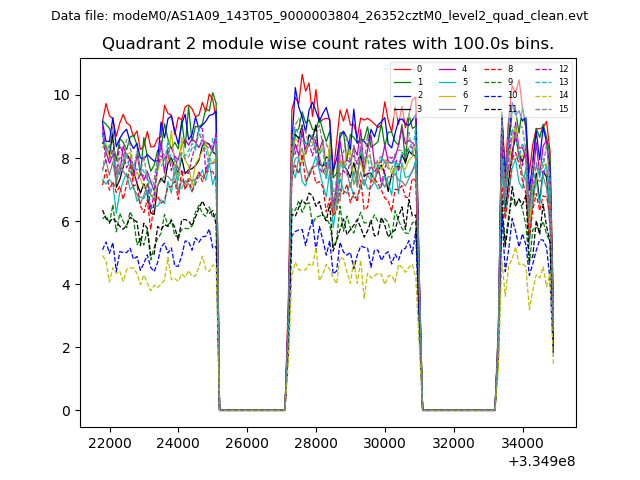
| Module-wise count rates for Quadrant B Data is divided into 100 sec bins |
 |
 |
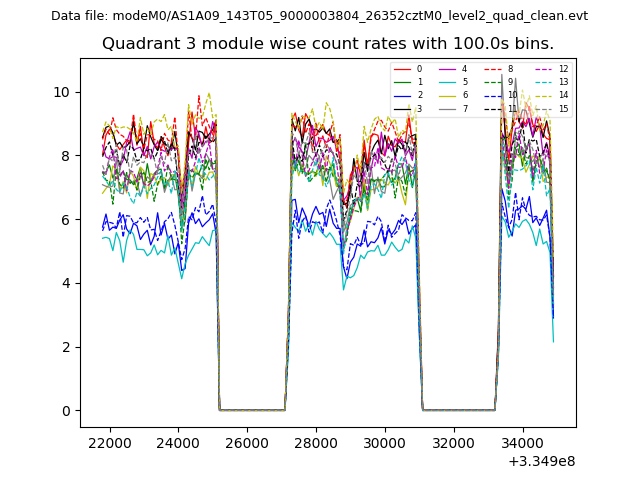
| Module-wise count rates for Quadrant C Data is divided into 100 sec bins |
 |
 |
| Module-wise count rates for Quadrant D Data is divided into 100 sec bins |
 |
 |
| Parameter | Plot |
|---|---|
| CZT HV Monitor | 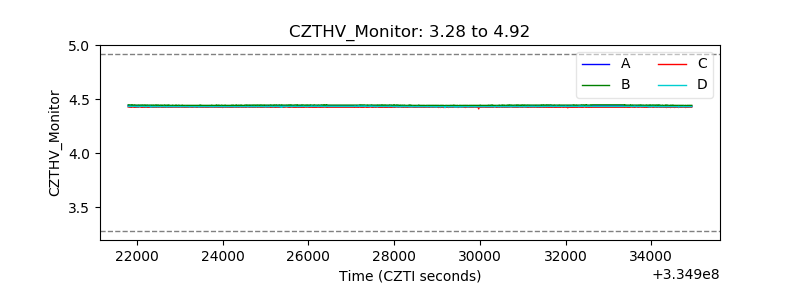 |
| D_VDD | 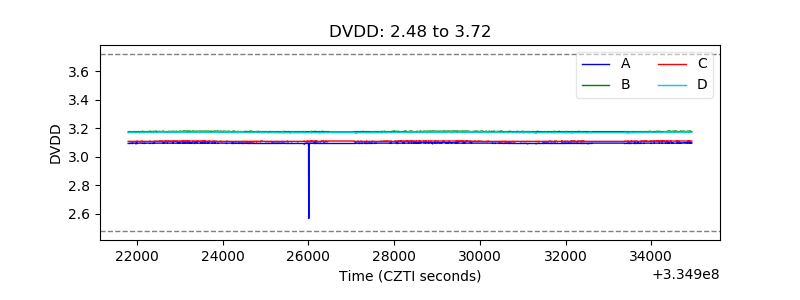 |
| Temperature 1 | 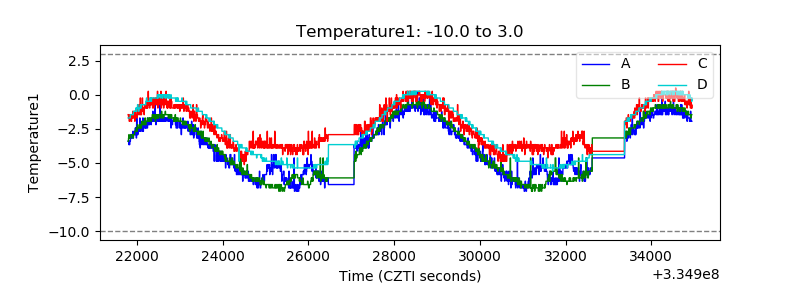 |
| Veto HV Monitor | 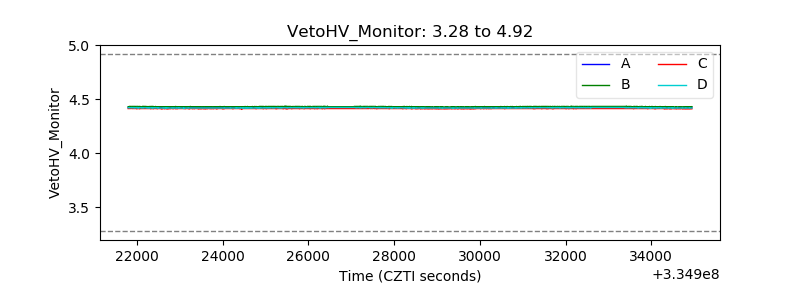 |
| Veto LLD | 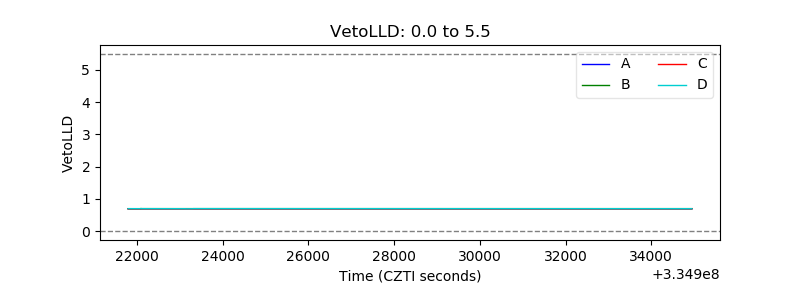 |
| Alpha Counter | 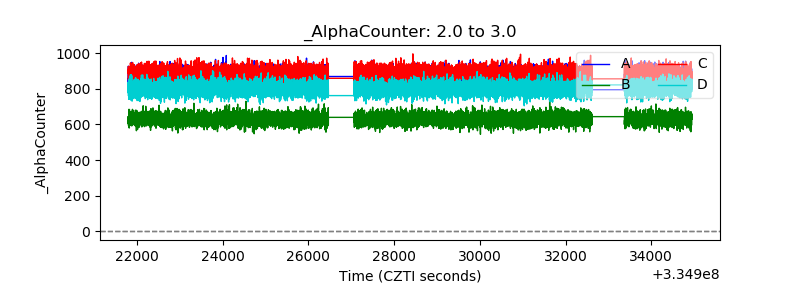 |
| _CPM_Rate | 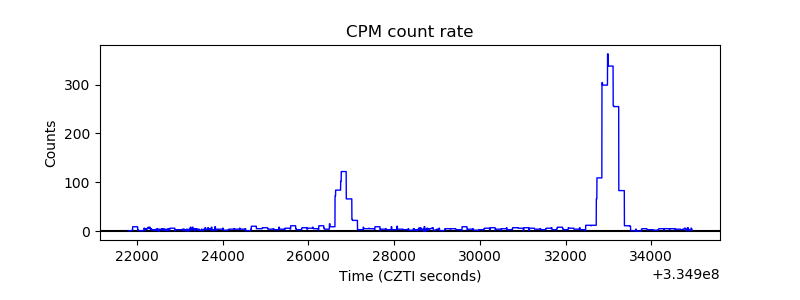 |
| CZT Counter | 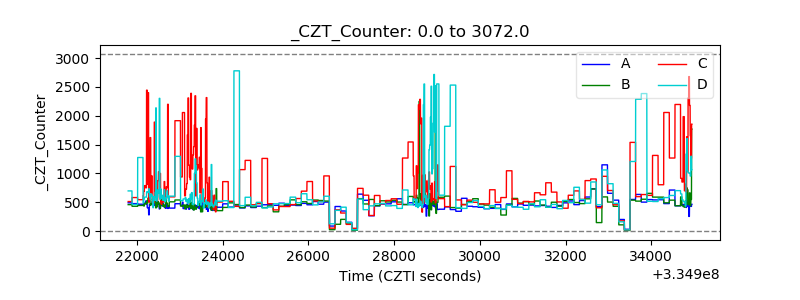 |
| +2.5 Volts monitor |  |
| +5 Volts monitor |  |
| _ROLL_ROT | 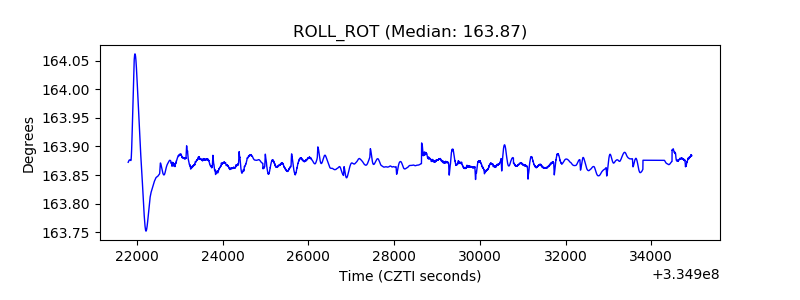 |
| _Roll_DEC | 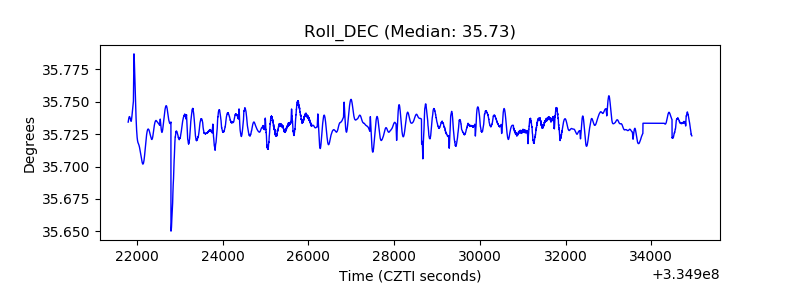 |
| _Roll_RA | 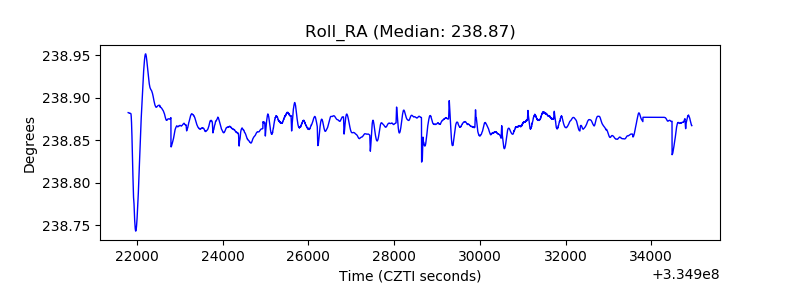 |
| Veto Counter | 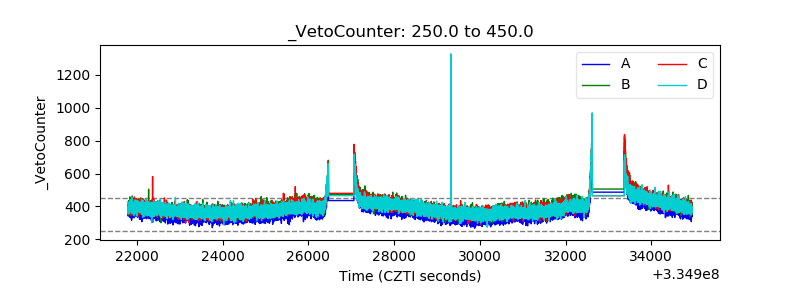 |